
A Matter Of Perception
I want to post something here that I pointed out to my subscribers last week. This is a great lesson on a day when Gold & Silver are selling down again.
.
Every now and then I do a little ‘lesson’ to keep us balanced. This one has to do with the difference between ‘trading’ & ‘buy and hold’ for weeks or months. The problem with Buy & Hold for some is that the daily wiggles can be uncomfortable to them. No one wants to see a down day give back some of our recent gains, but it happens in buy & hold. What can give us proper perspective?
.
Staying focused on the bigger picture. It is all about Perception. I am both a trader short term and a longer buy & hold under the right bullish conditions, so let’s take a look at perceptions. Enjoy!
.
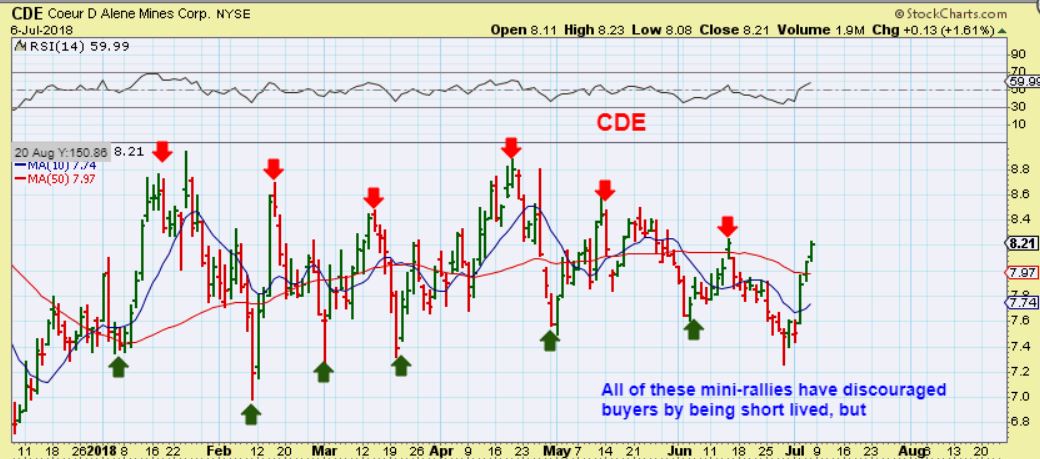
CDE #1– CDE has had many small runs in 2018, like a trading range between the green arrow to red arrow. I would say that people that own it using ‘buy & hold’ may even be a bit sick of this action. What you want to do is step back and get a bigger picture view of the situation. As noted in prior reports, CDE did excellent in 2016. Let’s step back…
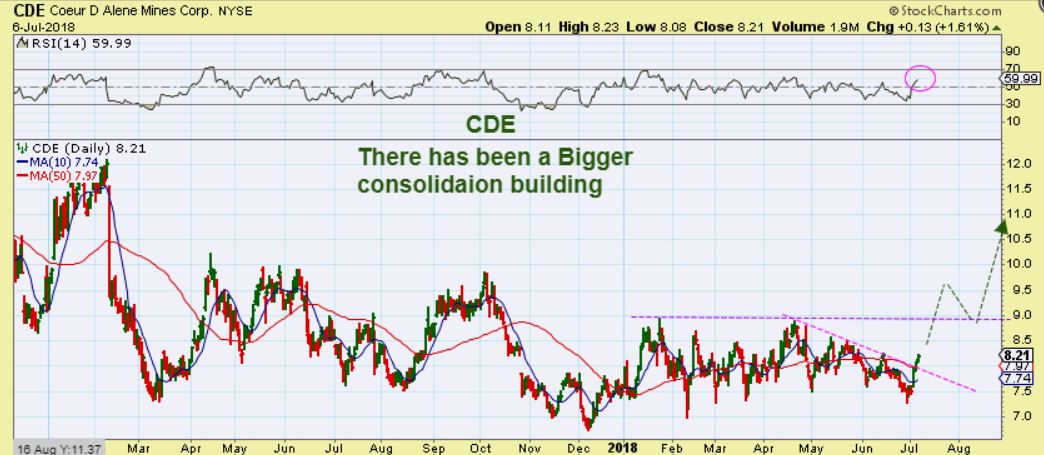
CDE #2 – So stepping back, we see a ‘Base’ is forming and a break out & run could tack on some nice gains rather quickly (Silver stocks do run quickly once they get going). This could quickly run to $9, however…
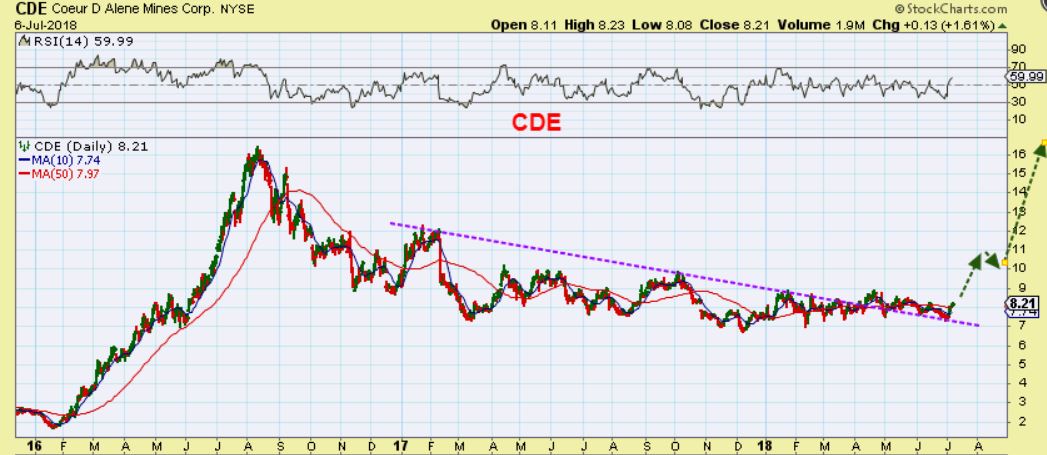
CDE #3– By really taking a step back and looking at what we are dealing with, we see what I would say is a massive bullish pattern forming. Look how CDE ran in 2016, from under $2 to $16! This year of 2018 has been the bottom right hand side of what looks like a massive base that could form a multi-year’cup’ on a run higher. CDE from $8 back to $16 would be 100% for the buy & hold investor, and then a break out could send it even higher, if these rally like they did in 2016.
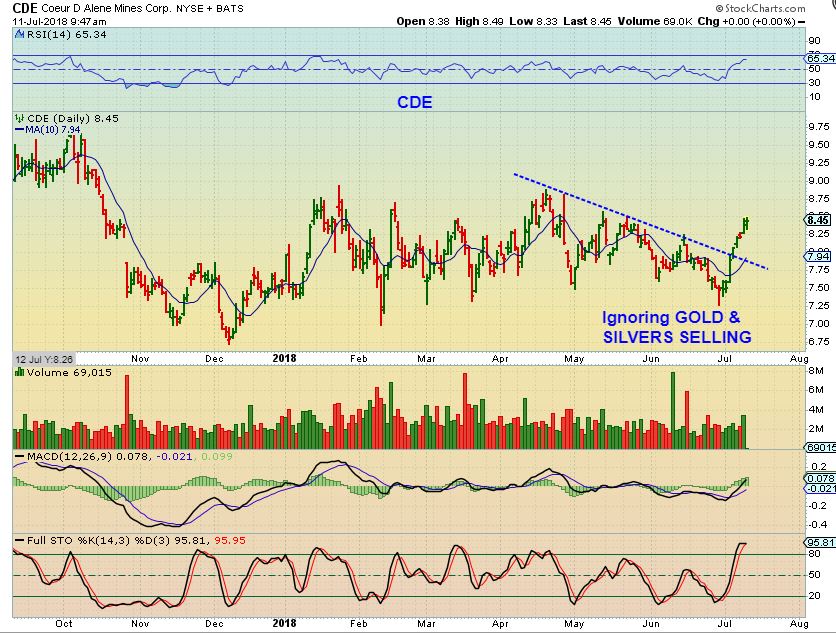
LAST WEEK, CDE WAS TRADING AT $7.20 AND STARTED MOVING HIGHER AGAIN. WHAT HAS CDE DONE SINCE I PUT THIS IN THE REPORT? SILVER HAS BEEN TAKEN DOWN MONDAY & TUESDAY AND WEDNESDAY, BUT THIS IS THE CURRENT CHART OF CDE
.
CDE WEDNESDAY 7-11 – $8.45. CDE continues Higher, even with Silver dropping this week. The BIG PICTURE VIEW would help one to avoid selling the ‘wiggles’, as long as the Precious Metals sector remains bullish (and my analysis shows that it is).
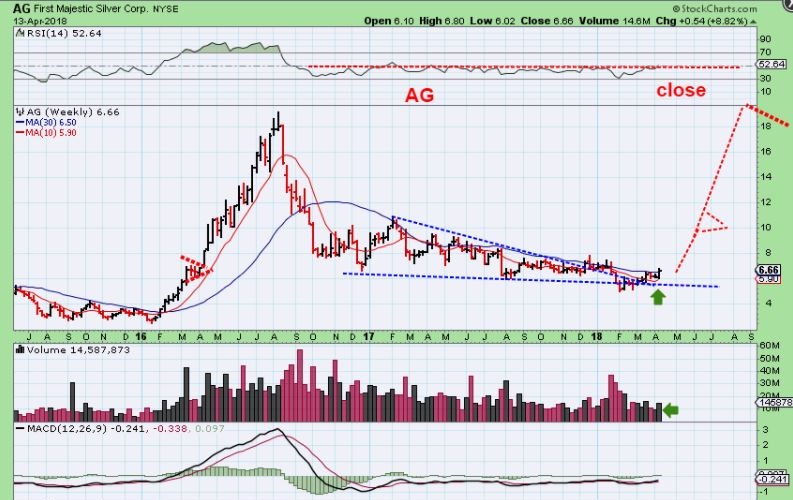
When I was pointing that out in AG as a ‘BUY’ in April, it looked similar to CDE now. A long descending wedge type of pattern had formed there too. This was my big Picture chart of AG for April 13. I mentioned that buying AG under $6 would probably look like a gift in the future.
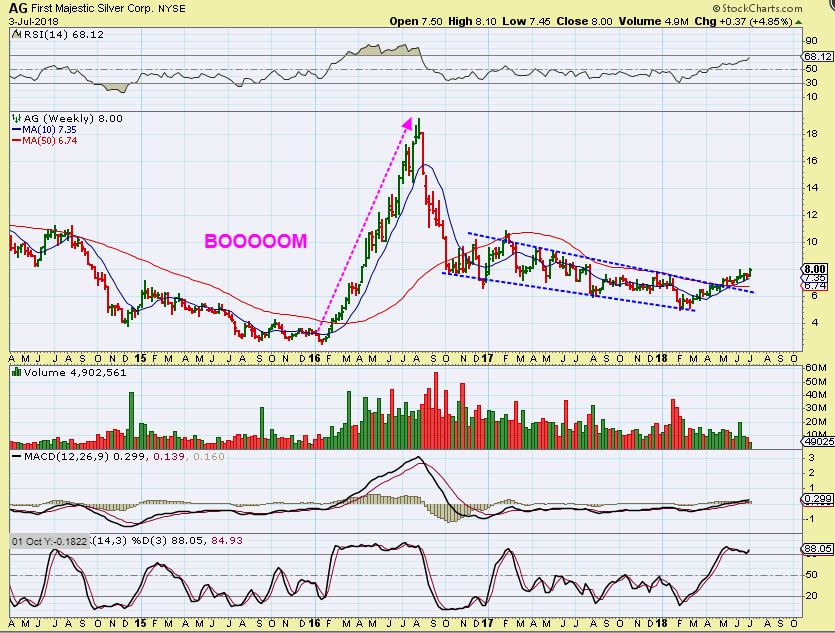
AG – Ag now trades near $8. Since the Feb lows, AG has begun to put in a steady run higher, breaking above the down trending channel. It has done this WHILE SILVER SOLD OFF TOO. Imagine when Gold & Silver run higher out of an ICL? CDE, AG, and other Miners should all do very well.
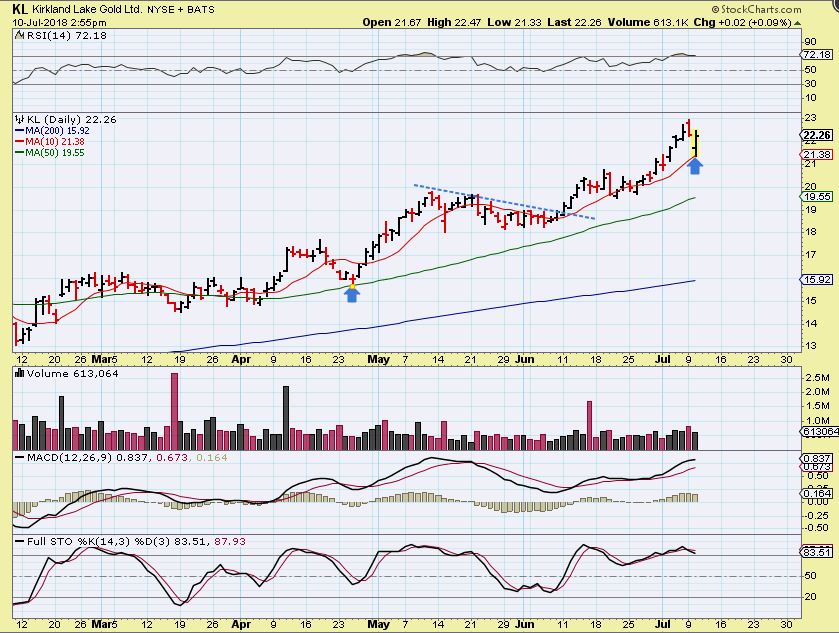
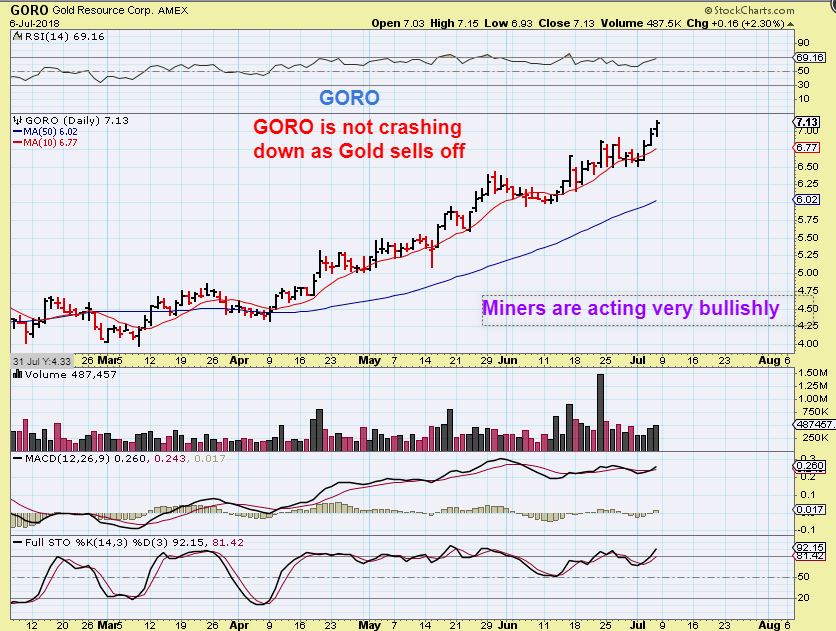
If Conditions remain bullish in this sector, whether it is inflation creeping in or the USD dropping into its 15 yr cycle low over then next few years, these Miners can become big winners in your portfolio. Some already are, and I have pointed out the leaders like KL, GORO, and so on in my reports. THEY ARE TRENDING HIGHER AS GOLD SELLS OFF TO NEW LOWS.
Try not to completely miss the train as it leaves the station by at least owning some Miners. I have been recommending them for a while now, and I will continue to cover individual miners as they set up to break out & move higher too.
Thanks for being here at Chartfreak!
~ALEX

