Archive for month: August, 2017
https://chartfreak.com/wp-content/uploads/sites/18/2017/08/BIO.jpg
894
1468
Alex - Chart Freak
https://www.chartfreak.com/wp-content/uploads/sites/18/2019/11/Chart-Freak-site-logo.png
Alex - Chart Freak2017-08-31 11:44:232017-08-31 12:45:59Thursday August 31
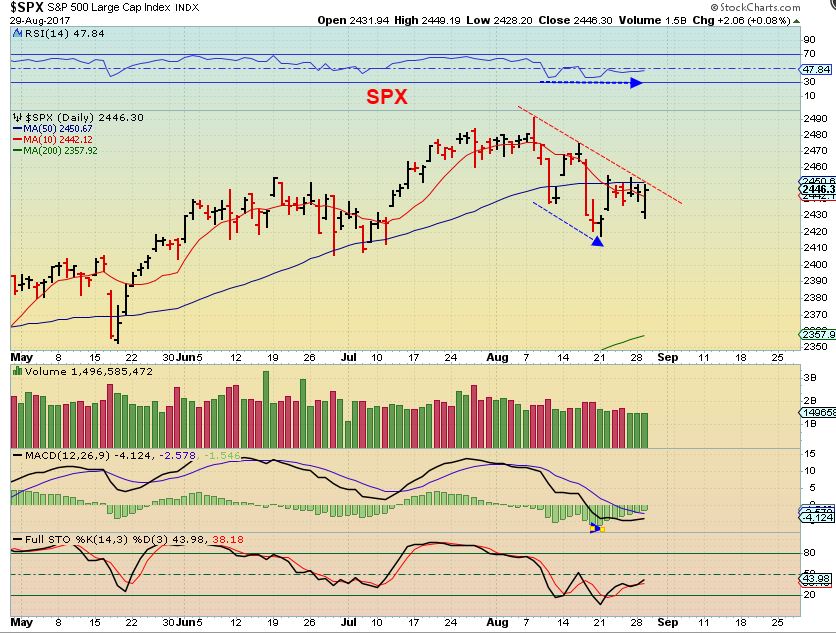
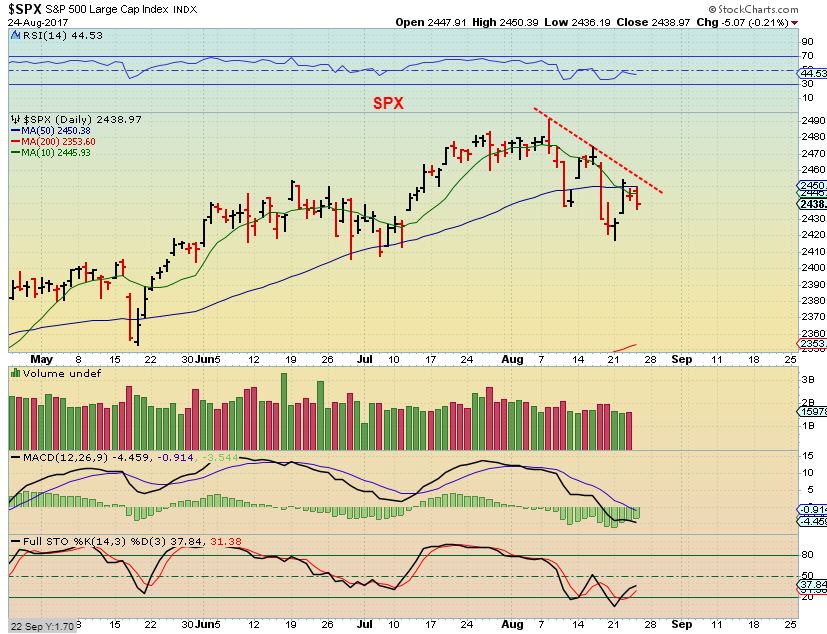
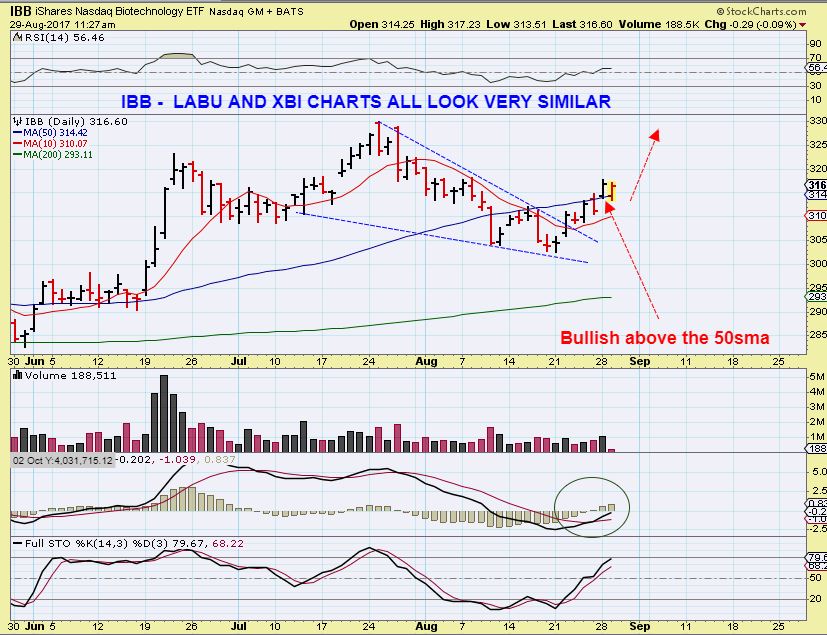
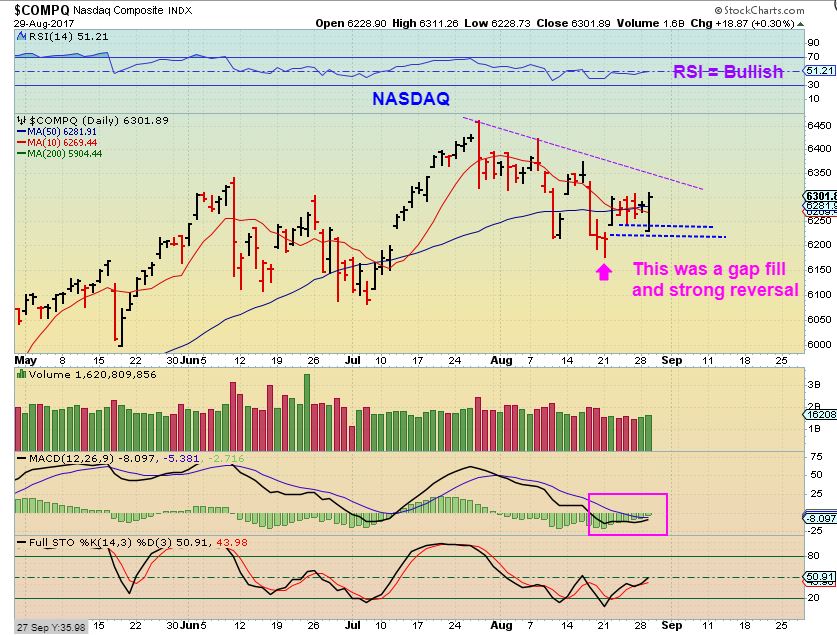
SPX- Yesterdays reversal filled a gap and strongly moved higher. It is right against the down trend line, and a push higher above the 50sma and the trend line is a buy if you ask me( I would have taken a chance and bought here). A break higher should indicate that we have a dcl and the markets are done consolidating for now.
Let's take a look at the NASDAQ
Read More We will talk about this and what it could mean for the Miners,
after a brief review...
Read MoreWere you prepared for this action today? At chartfreak, we have been selectively buying Miners and other commodity stocks for weeks, and discussing the bullishness in this sector, despite many articles expressing concern over it.
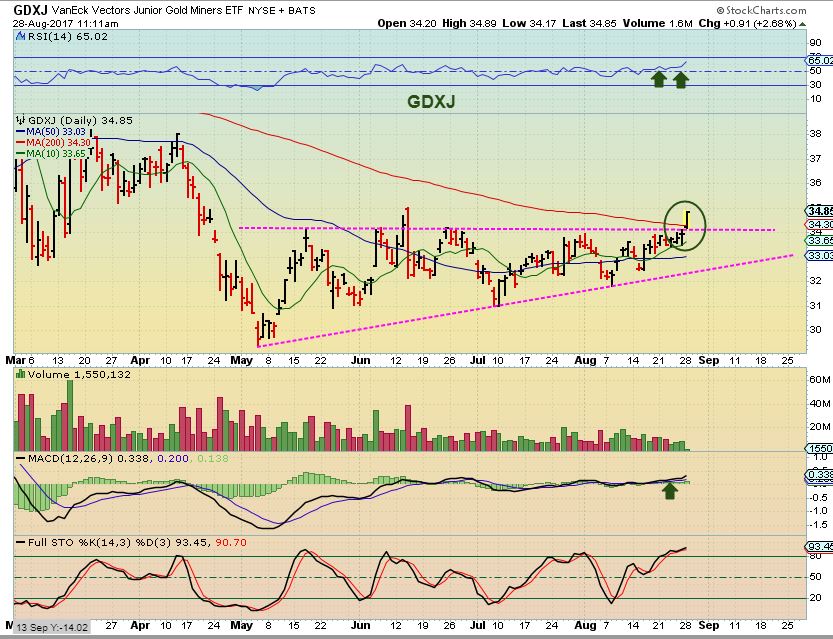
I'm opening up the weekend report, because we have been expecting this break out in Gold for weeks now. I have been posting various Miners chart set ups to show which ones were good low risk buys over the past few weeks, and my reports have been very focused on the bullish side of GOLD, SILVER , & The Miners. In addition to that, We also have been buying and trading commodity stocks like HBM, IPI, TGB, X, FCX, etc over the summer, and pretty much avoiding the General Markets as they topped out and consolidated for a bit. I was able to call THE lows in Oil in July, but the Energy sector using XLE & OIH was tricky, so I didn't enter a trade there. Set ups kept breaking down and even though the XLE did break out in late July and looked promising, it lacked strength and follow through after that break out . This was this weekends report is posted below in it's entirety, and follows up on all of those areas. IF you think that all the prior daily reports directing you to the Commodity stocks and Miners may have helped you with your trading, why not sign up for a month and try it out now? I will be closely watching this sector after todays break out. Enjoy!
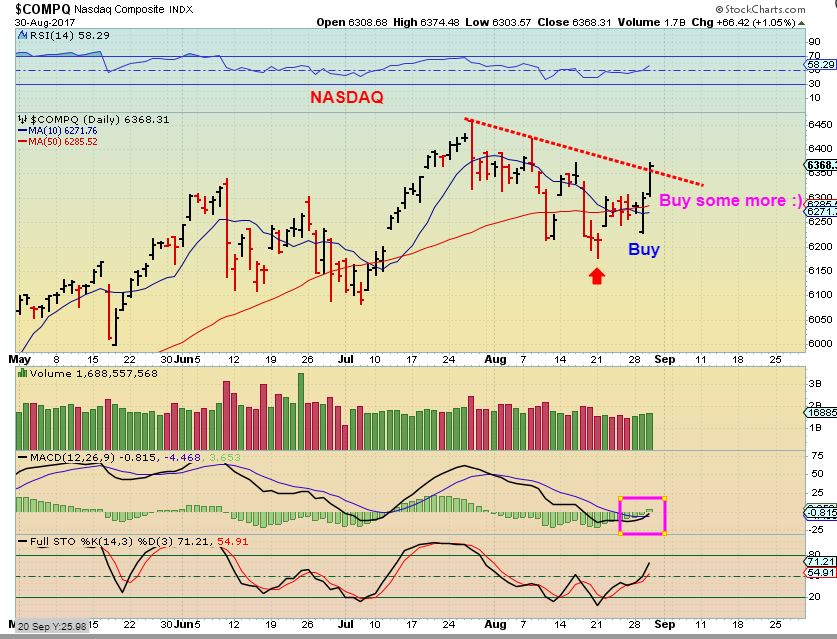
NASDAQ -We still haven't dropped into our ICL, but you can see that the NASDAQ has basically gone sideways all summer. Price is where it was in May. Is this reversal ready to move price higher out of this consolidation?
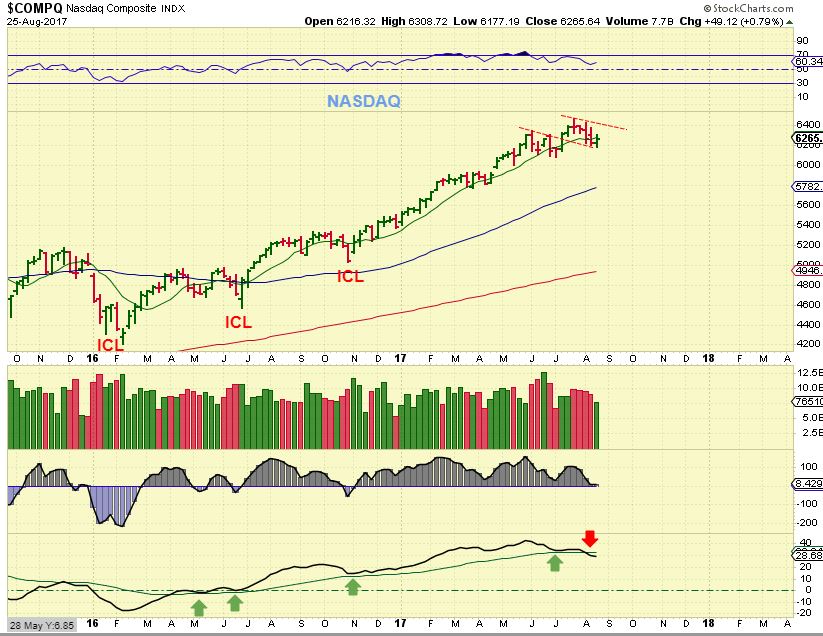
Well, we are within the timing for a DCL on the daily charts, but look at that lower indicator on the above NASDAQ chart. This sideways move has internal weakness, so the next daily cycle could roll over too, if you buy the reversal here, use a stop.
Read MoreLet's review the weeks market movement and see what is likely to happen next week.
NASDAQ -We still haven't dropped into our ICL, but you can see that the NASDAQ has basically gone sideways all summer. Price is where it was in May. Is this reversal ready to move price higher out of this consolidation?
Well, we are within the timing for a DCL on the daily charts, but look at that lower indicator on the above NASDAQ chart. This sideways move has internal weakness, so the next daily cycle could roll over too, if you buy the reversal here, use a stop.
Read More
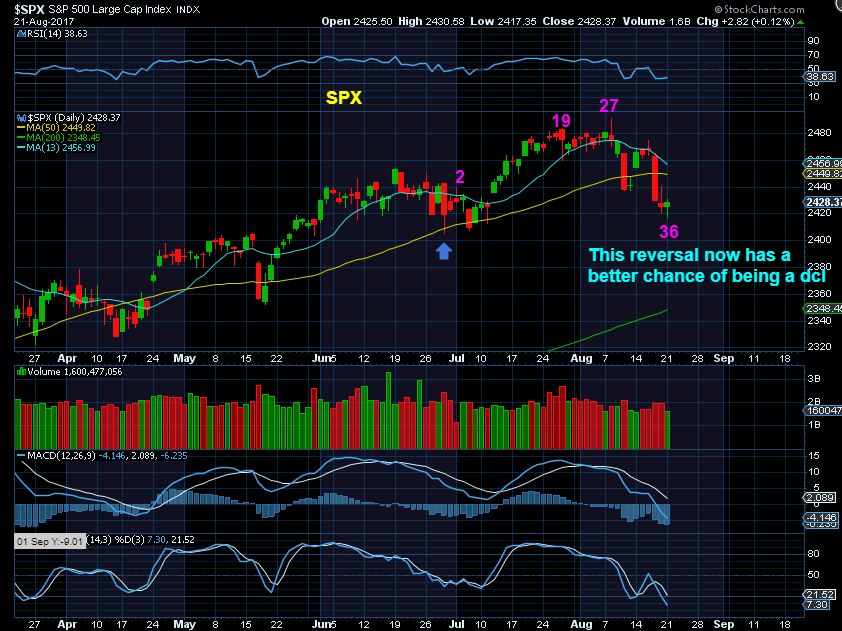
SPX - So the SPX has a swing low in place, and the timing is right for a dcl, but at the same time, we are overdue for an ICL and this drop did not fit that definition. The SPX was rejected at the 50sma and it is good to note that a drop to 2400 now would give us a failed daily cycle and begin to fit the criteria for an ICL drop. A break above the trend line overhead would signal that we do have a dcl already in place and confirmed.
 Read More
 Time for what? The clue is in the picture, and we'll discuss that after a brief review of the markets.
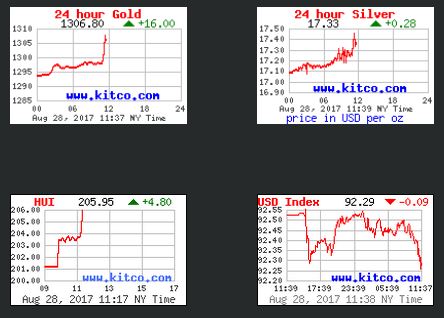
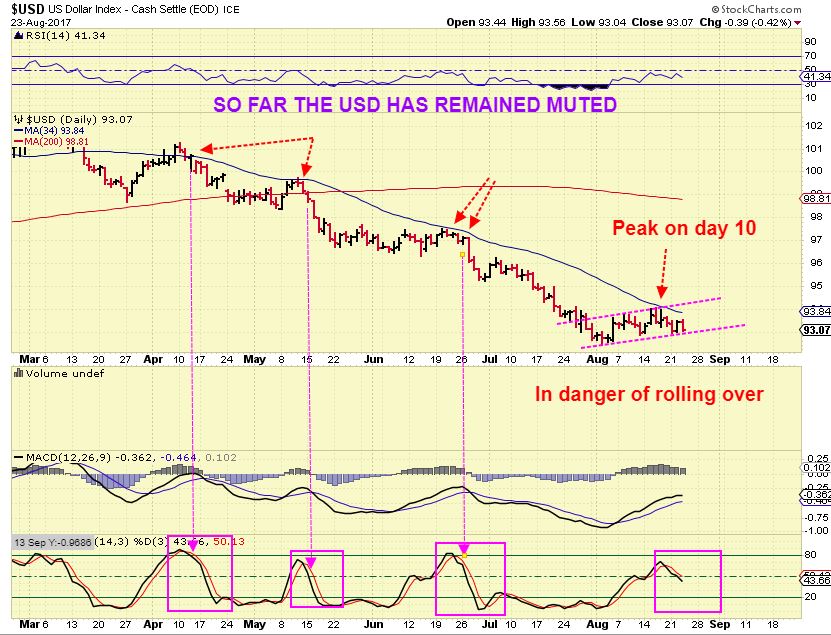
USD - We were due for an ICL and not just a dcl in August, but so far this low is acting just like the other dcls, and they rolled over after going sideways for a while. If this drops and rolls over, I feel that Gold will POP and RUN higher.
 Read More
SPX - We are well within the timing for a dcl, and the swing low on Tuesday gives a valid buy, with a stop under the low of Monday.

If we get the dcl in place here, will the General Markets now just recover and take off to new highs?
Read More After a pretty solid reversal candle on Friday, the Precious metals sector gave us a little surprise to the upside on Monday. We'll discuss that and a few other things in this report...
SPX - 6 days ago I warned about buying the reversal in the General Market, because the 'timing' was not quite right and some of the internals did not look healthy. The reversal on Monday is within the expected timing for a dcl, though some internals are still weak. This one may be the dcl if we get a swing low in place.
 Read More
I'm starting off the weekly report with 2 charts that I used in the comments section of a recent report. Then we will cover the markets and especially Oil & Precious metals.
These 2 charts were used last week simply to point out the phenomenon that often happens in the markets. It is the round number phenomenon, where markets tend to find support & resistance at round numbers.
SPX - Here you can see how traders temporarily sell at round number resistance or buy at round number support and this affects price action.
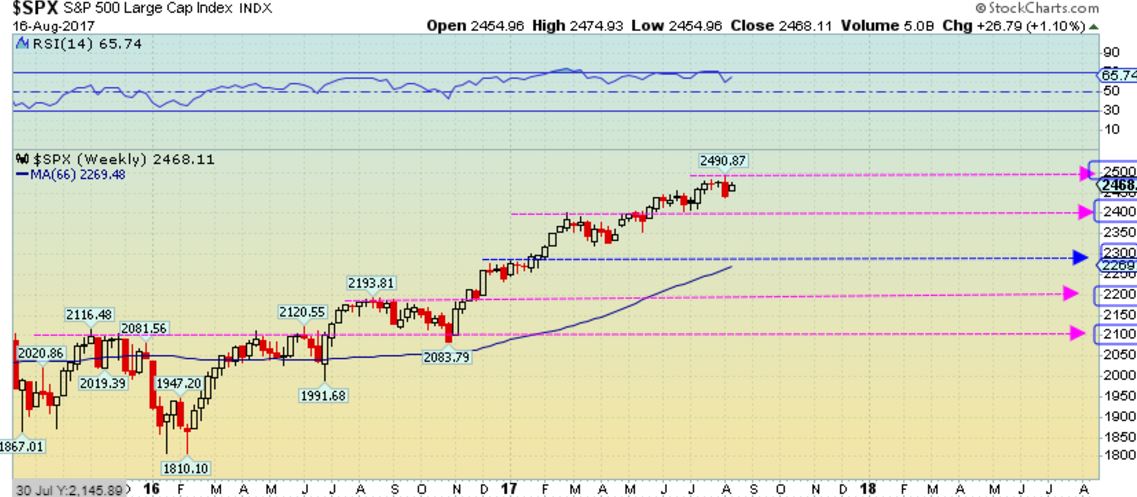
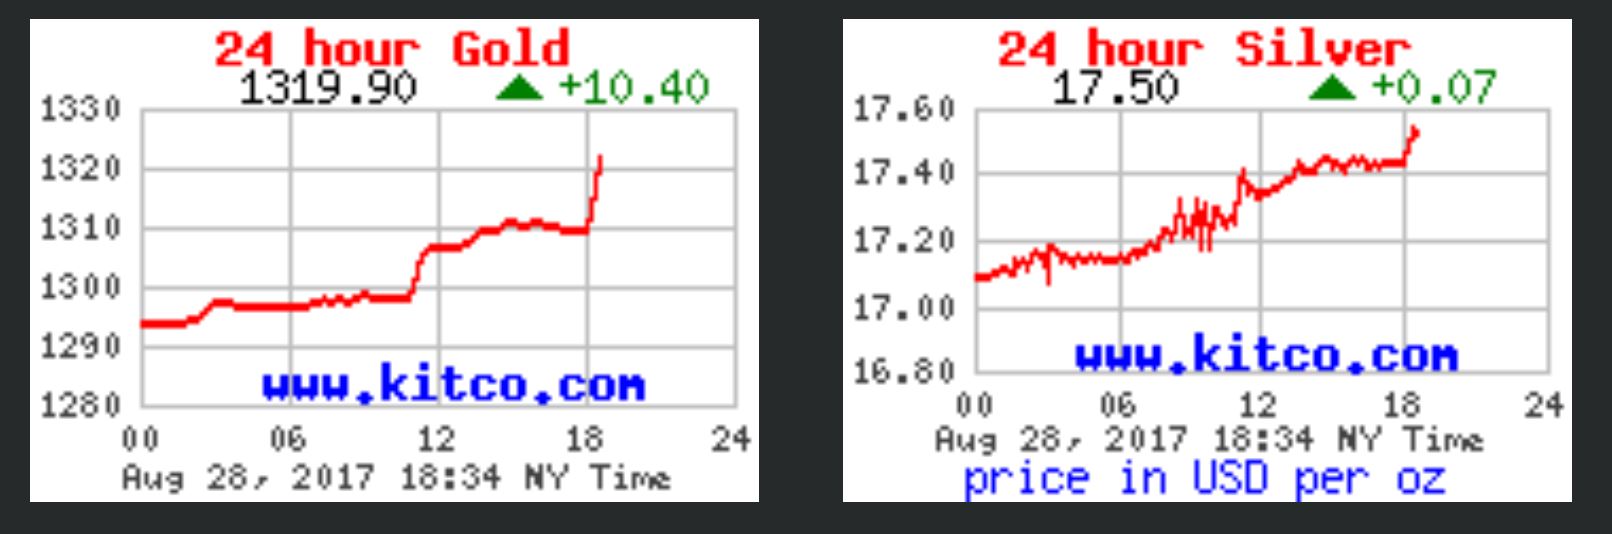
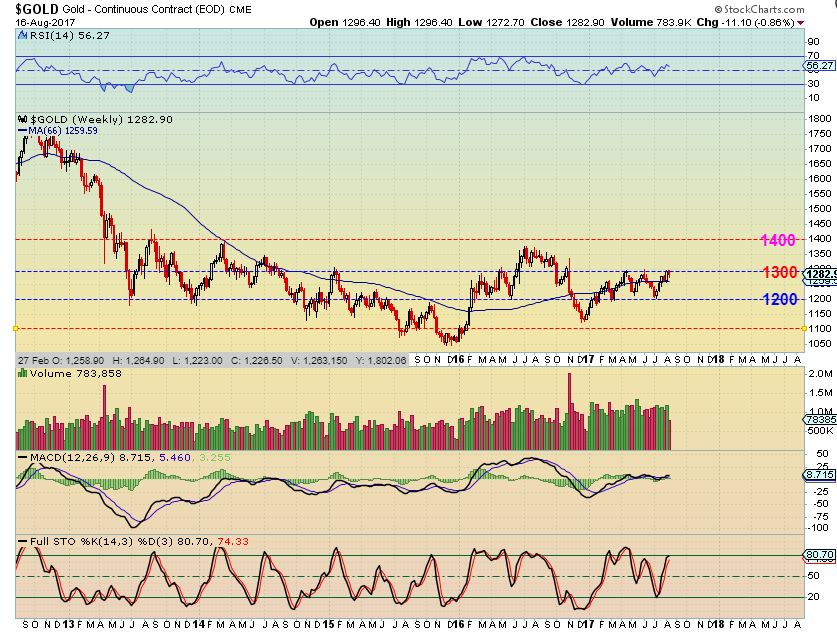
GOLD - And my point is that this can just be a temporary pause. A sideways move may begin and build energy for the next break of resistance. Gold was near 1300.
 Read More
Scroll to top


 Read More