It’s time to see what 2017 has to offer us as traders and investors!
We’ve started the new year and trading has already been very exciting in various sectors that we at Chartfreak have been looking into. So ‘What time is it?’ It’s also time to get on board and make some money in a variety of bullish set ups that are appearing in the markets! This is a glimpse what we have been looking at lately.
GOLD – I love deep sell offs, because they can lead to strong bounces or recovery. We were waiting for a close above the 10sma. Some Miners bottomed first, but Gold needed to close above the 10sma to start a bullish move higher.
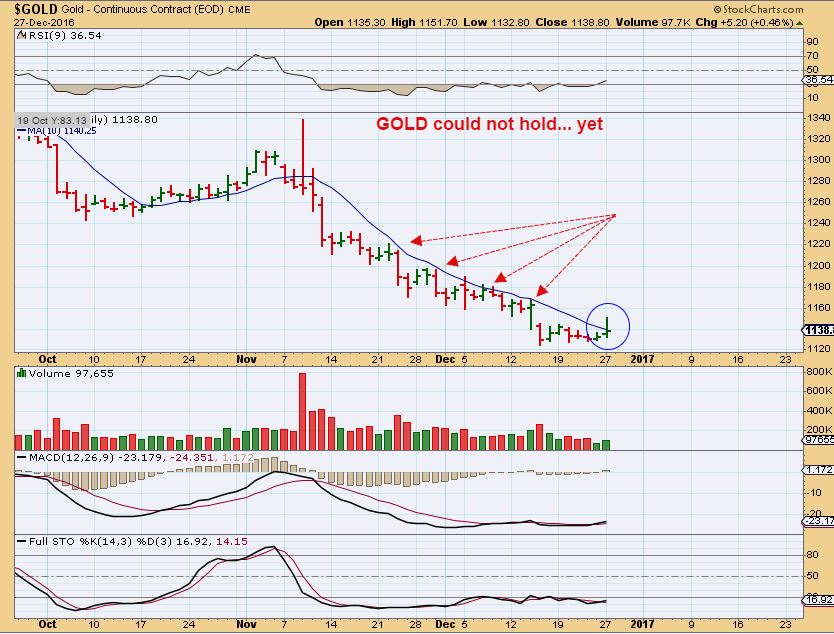
GOLD – We closed above the 10sma the next day. In my last weekend report I noted that the 50sma usually offers resistance, so that is the next challenge, but I’d like to see GOLD just punch right through it in this first daily cycle. Why?
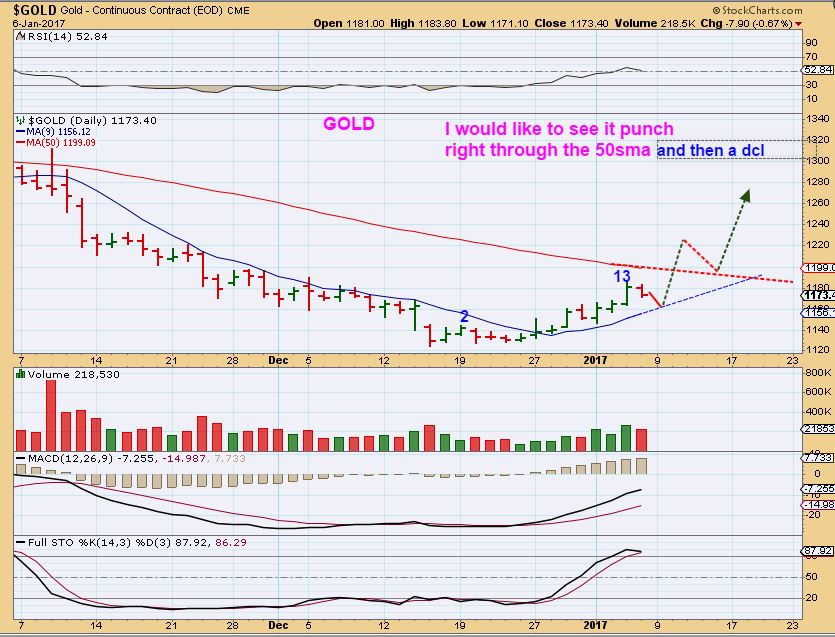
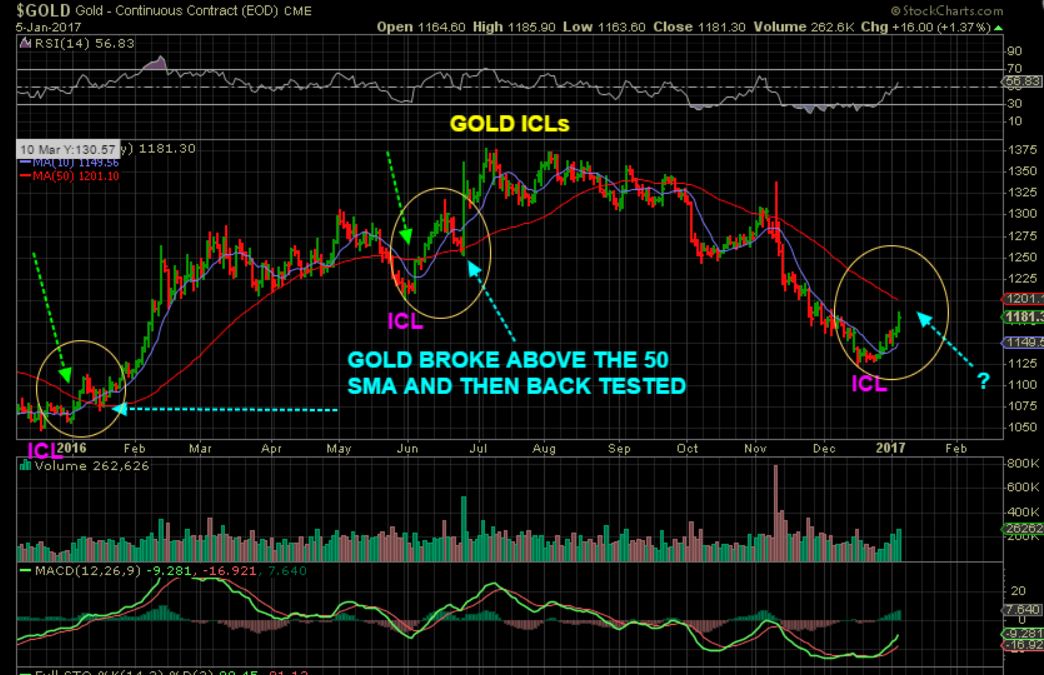
GOLD – At the start of the strong run higher out of an ICL ( intermediate Cycle Low) in the past, we broke the through 50sma and then back tested it. Either way, I have given other reasons to show why Gold is currently bullish.
What about Miners? >>>
In December, Signs were pointing toward a low coming in for various individual Miners. So while the short term & momentum traders were certainly buying, I pointed this out for the more conservative readers. A break out here would be another bullish development to watch for.
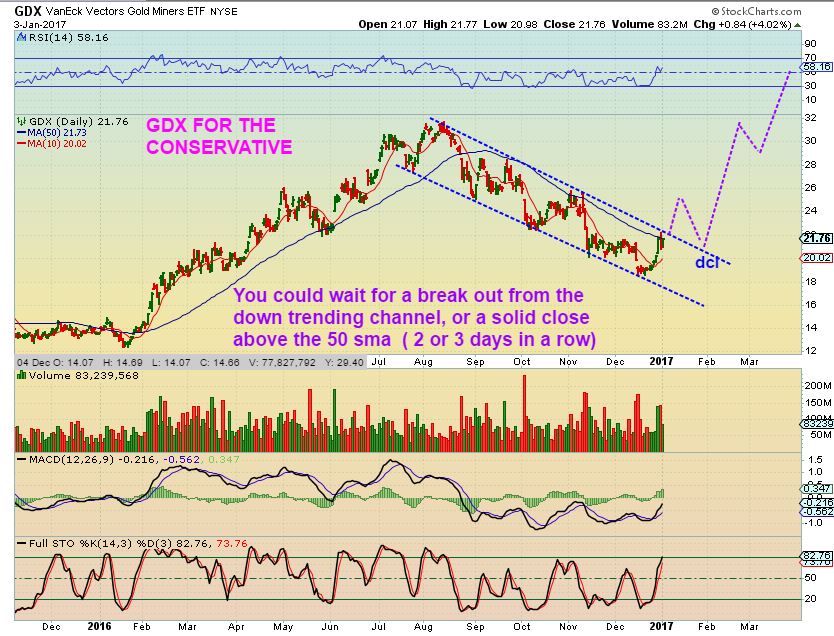
GDX WKLY – This is what we were hoping to see.
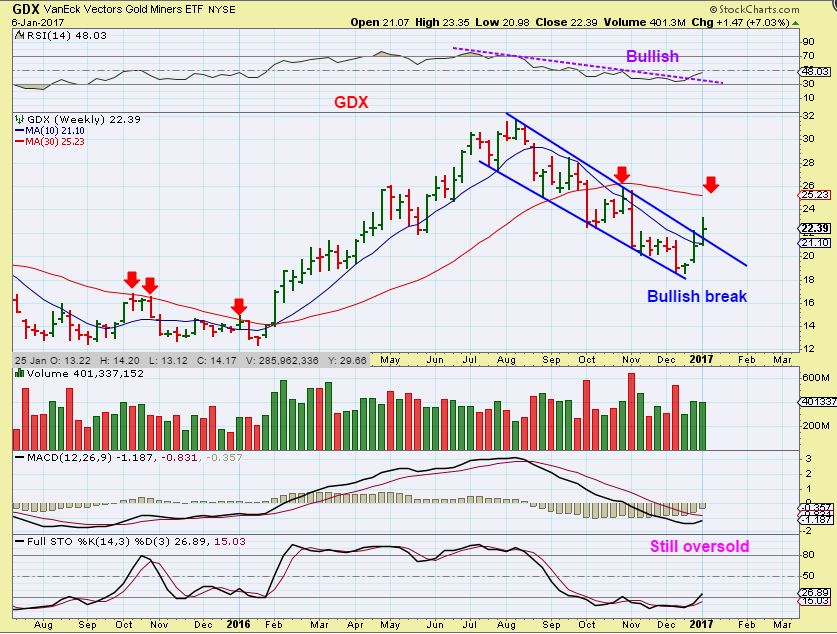
This was also a change of character , just one of many things confirming to me that Miners did indeed bottom in a stronger manner than the temporary bottoms in Oct and November. Many still doubt that Miners should have been bought, but many Miners are well off of the lows now.
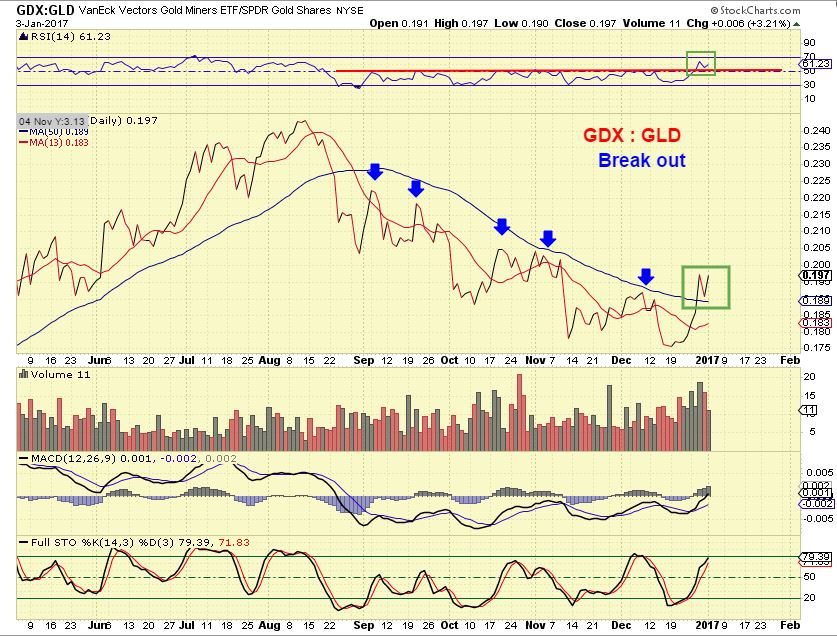
For our Stock traders, I had pointed out some Bullish set ups as they presented themselves, some were Miners and others were not as you will see here.
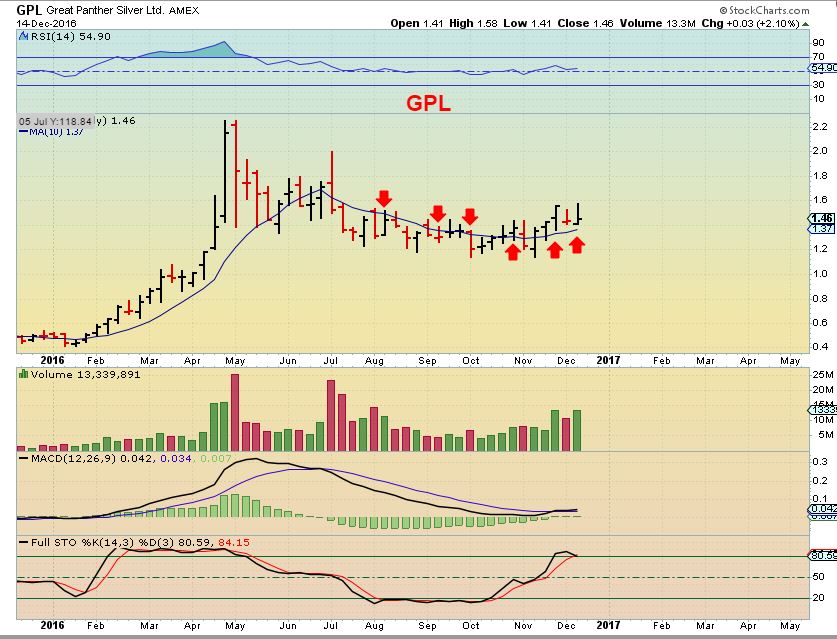
GPL – This is a bullish set up and GPL has actually been a leader. We bought near the lows, since I repeatedly pointed out this set up.
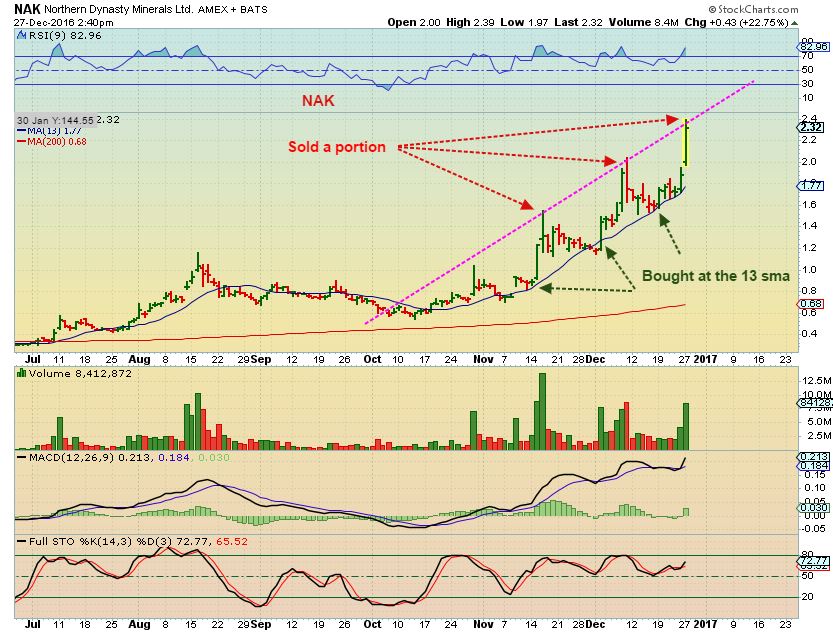
The NAK trade from 30 and 40 cents is endless. For some it was BUY & HOLD due to the potential shown on my long term charts ( Raise stops along the way). Also…
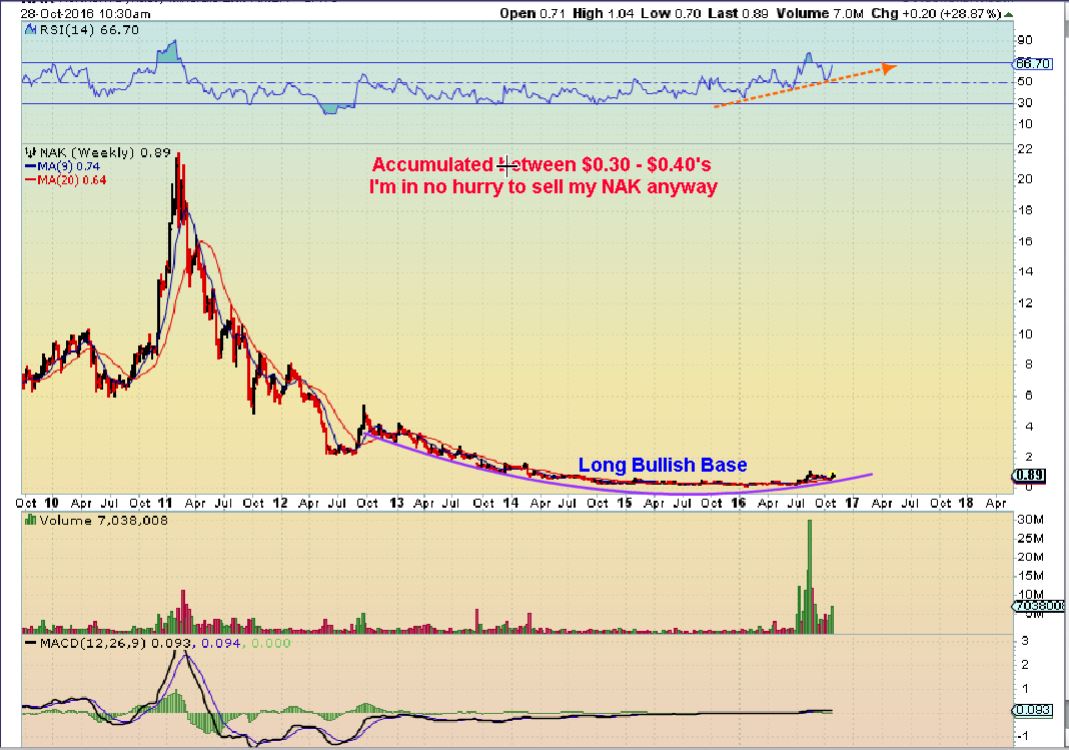
For traders or the nimble : We have also been selling ‘a portion’ at the tops / pops and re-entering at the lows.
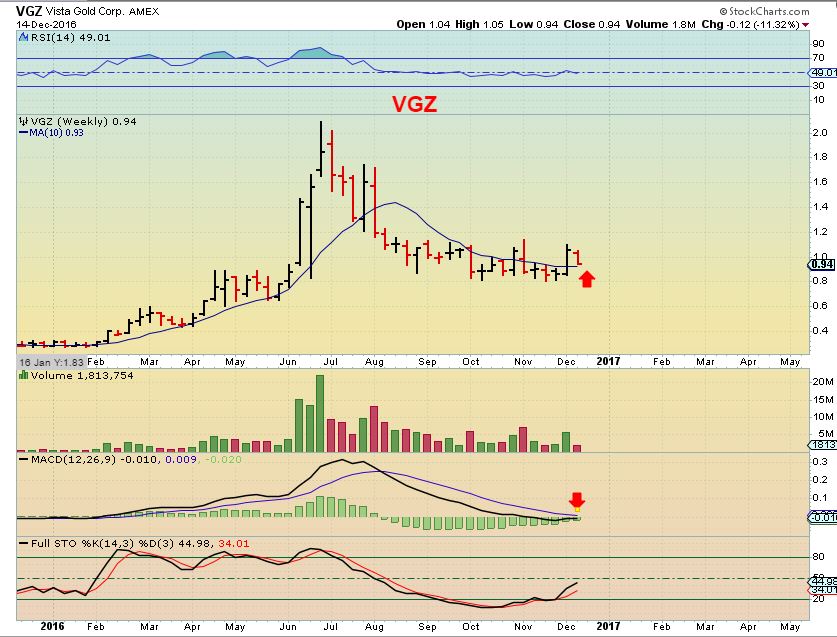
I liked this weekly set up for VGZ – And I still do.
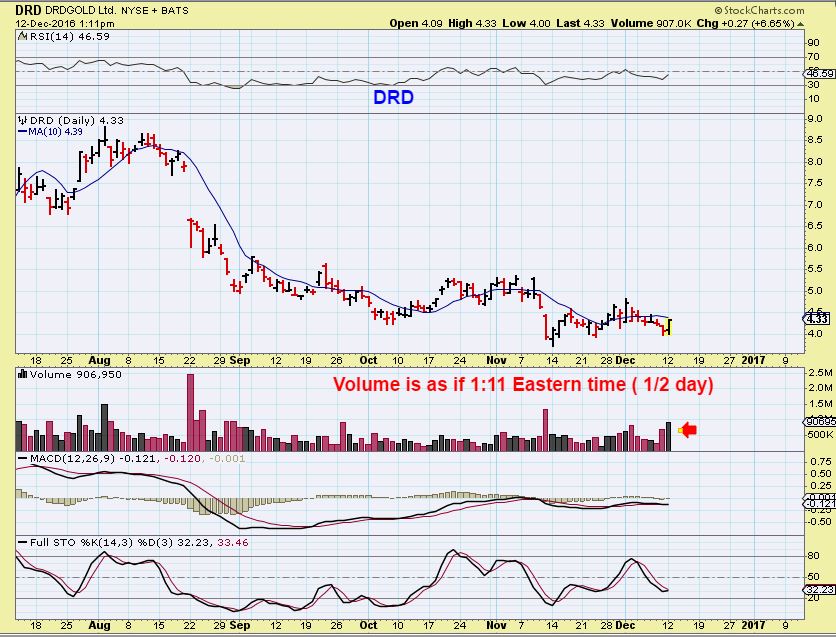
DRD– This was a Miner that was showing early signs of life, resisting the selling occurring in other Miners. Volume was strong as of 1:11 p.m., so I posted this in our chat section. Here it was $4.33 and looked to be bottoming.
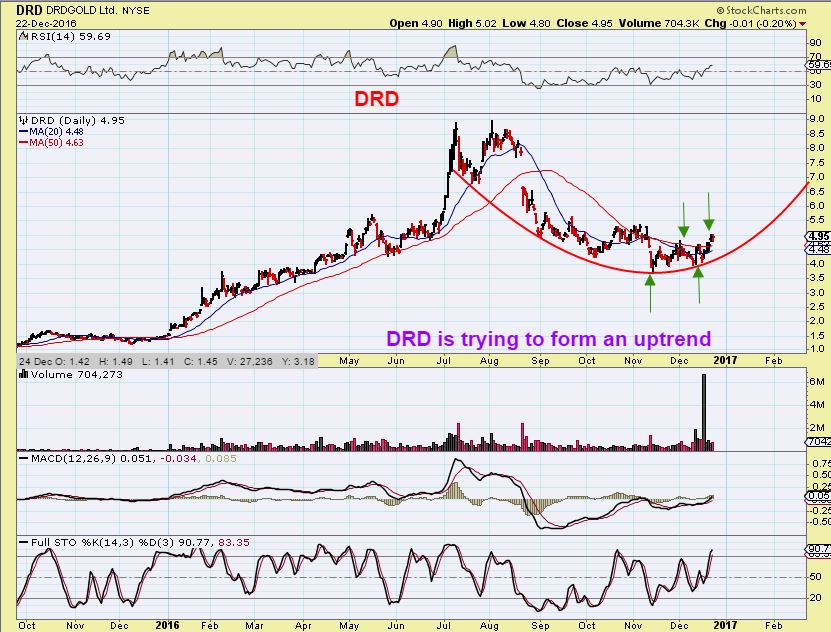
DRD- A follow up chart on Dec 23, now at $4.95, I still liked DRD. Today it is $5.69 and this cup is playing out slowly but surely.
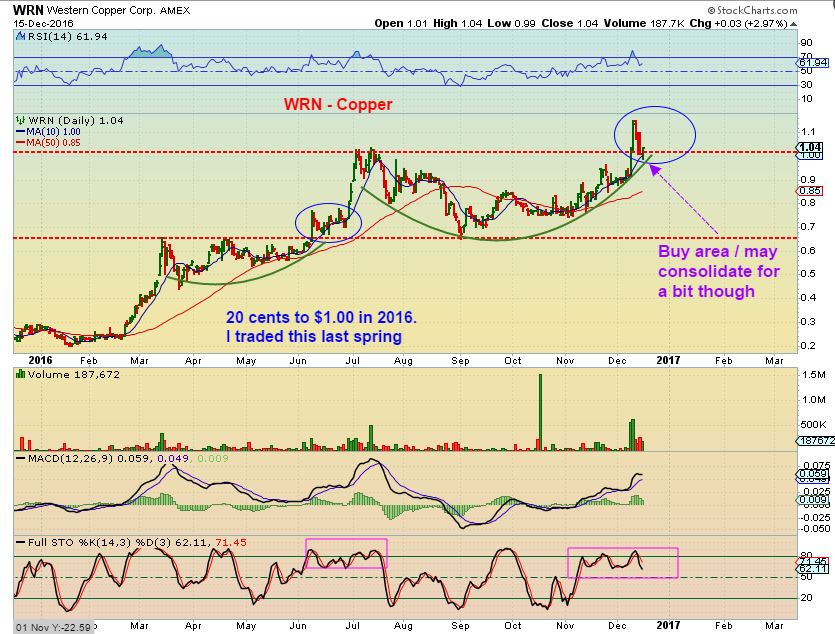
WRN – Dec 15th near $1.00, for traders this set up was a cup & a handle was forming. I still own this one.
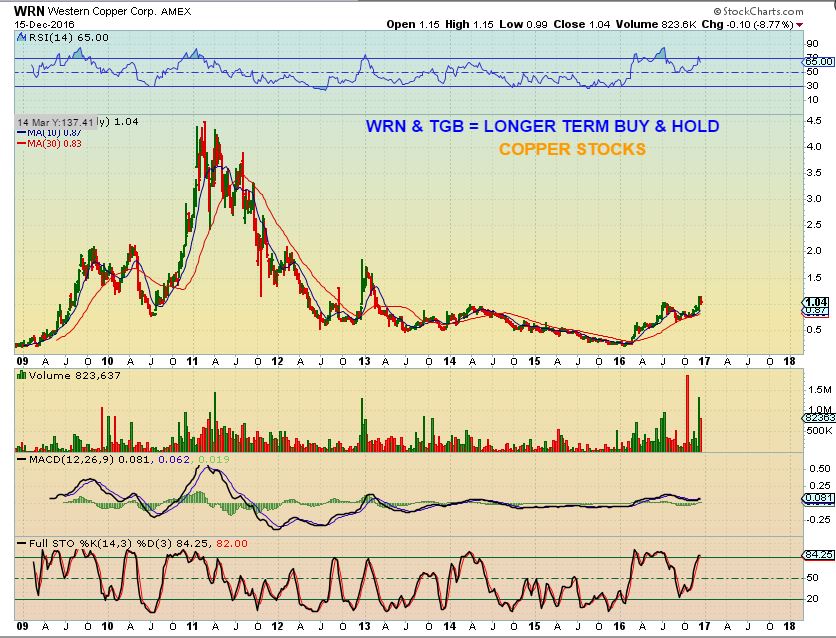
WRN – The long term potential was excellent, still at the $1.00 area.
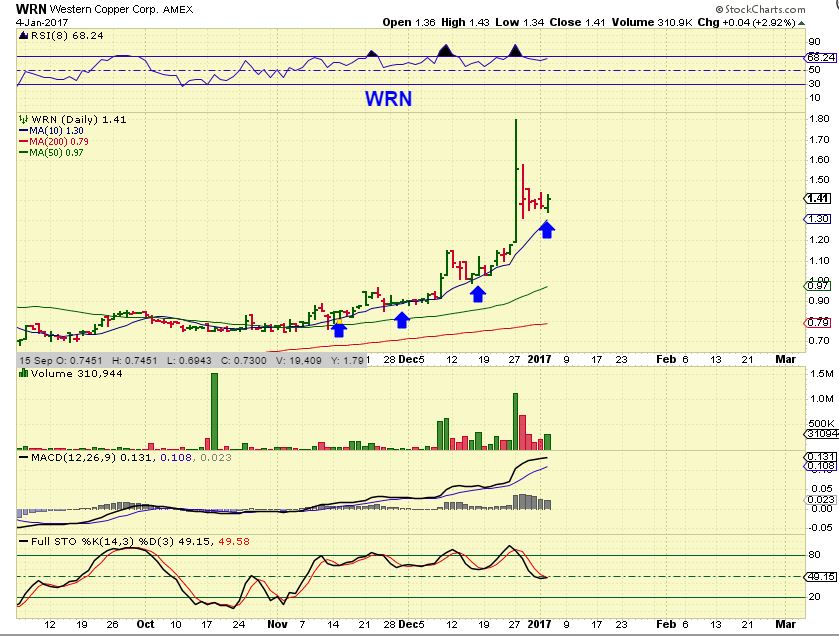
WRN – And then it erupted and is currently consolidating.
What time is it? It may be time to take position at the bottom of another bear market. Last year we caught the bottom of the MINERS and the ENERGY sector, along with metals stocks like CLF, X, AKS, VALE, CENX, AA, FCX, HBM, and so on. Catching the end of a bear market sell off can offer great gains!
Have you see the Uranium Sector lately? Especially since November we see a sector that was in a bear market sell off since 2011 possibly bottoming. I had an entire write up about this in todays report. Let’s take a peek.
URA – This may only be the start of Uraniums break out off of the lows.
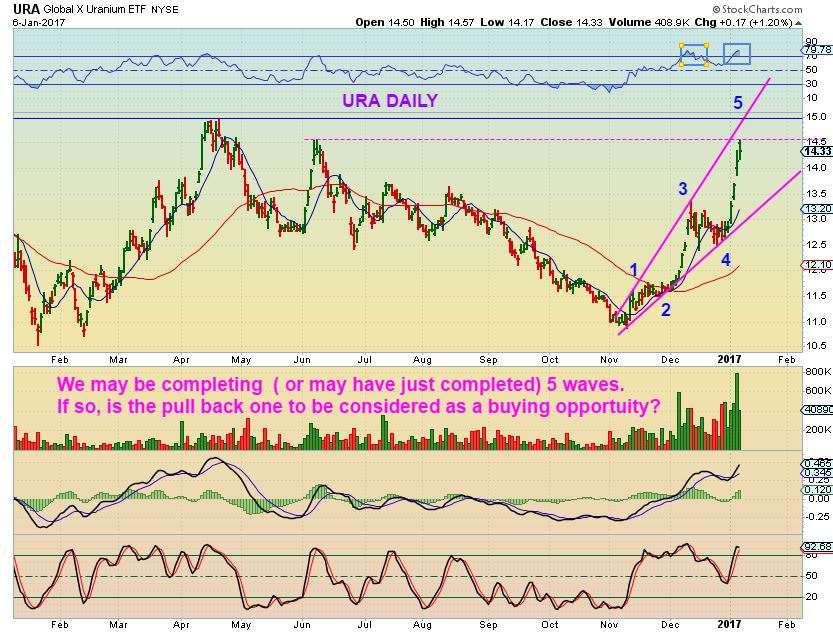
URA WEEKLY – The recent down trend has been broken and I see a double bottom with January 2016 lows and November 2016 lows in place.
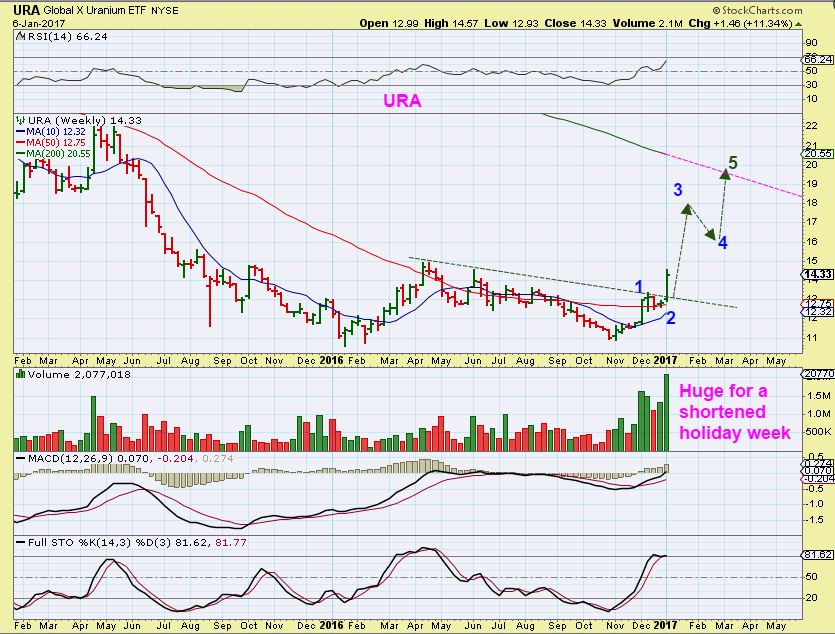
SO I pointed out several Uranium stocks to show that not just 1 or 2 are bullish, but the entire sector seems to be set up as a bottom being in place. Just like the Miners, Energy, Metals like Steel, Copper, and Aluminum, inflation or demand or some other force seems to be bottoming another bear market. Here are a couple in todays premium report.
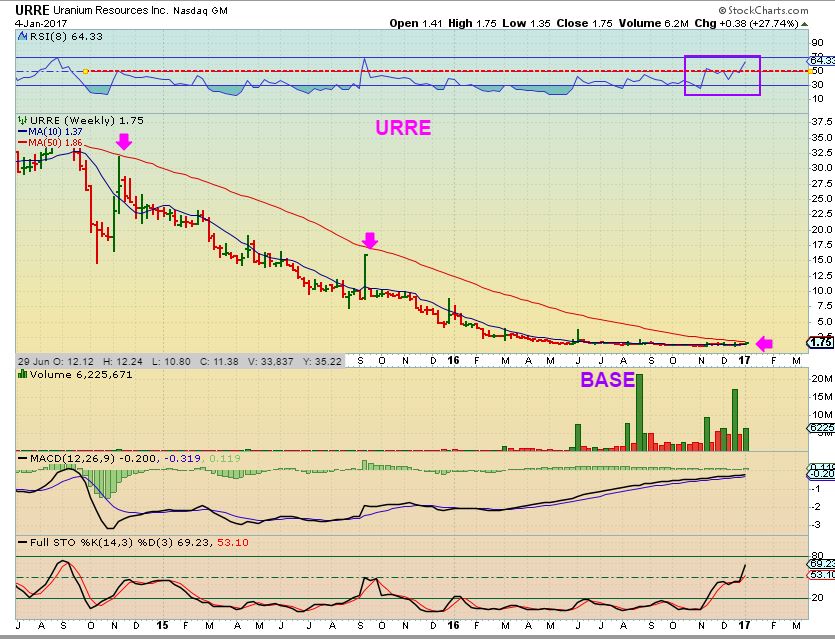
URRE – A long base. Jan 4th I pointed toward this break out as a low risk buy. Your stop could be slightly below the 200sma
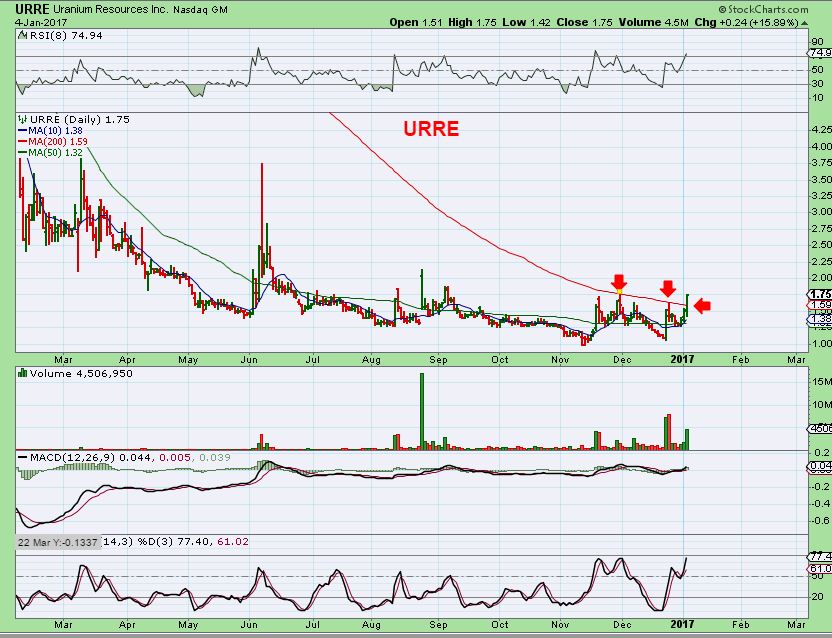
Due to a reverse split a while back, the chart is distorted a bit, but the potential is still big.
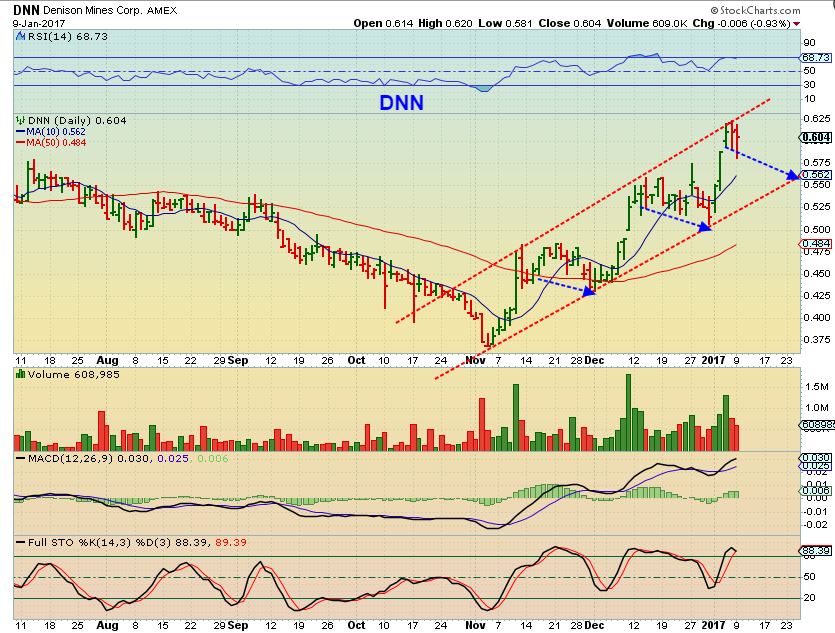
DNN – Yes it is a stock that is under $1.00, but it trades on the AMEX. It is not an OTCBB or PINK SHEET stock, but due diligence is recommended for those fundamentally interested in Denisons current standing. For traders like myself, Uranium double bottomed in November and DNN is up 70% from its November lows. Currently it looks set to pull back into another trading opportunity.
There is a lot more that we could discuss, but this is enough for now. I’ll have updates as we go forward. The point is that the trading in 2016 was a traders paradise, was it not? Many Miners went up 200-700%. Industrial Metal stocks went up in a similar manner, see charts of CLF, VALE,X, FCX, etc., all up hundreds of %. Energy stocks made huge gains as they moved up off of their lows.
So what time is it?
It looks to me that 2017 is starting out very similar to 2016, and that also could lead to being a traders paradise as well as a successful long term buy & hold year.We just saw a strong correction or pull back in Precious Metals, but they can lead to very nice gains once the correction ends and the new rally begins, if we remain in a Bull market. It is time to search for opportunities and bullish set ups in the various market sectors that will offer us the greatest potential gains. Here at Chartfreak, that is what I try to consistently do for my readers. I will provide public updates from time to time, but why not sign up for a month or so and read the premium reports on a regular basis. You just may find that my research is a compliment to your trading style too. Thanks for reading along at Chartfreak!
~ALEX
Chart Freak Premium
Chart Freak members receive up to 5 premium reports per week covering a wide array of markets, as this public post illustrates. Come and join the ChartFreak community as we trade the new Gold Bull Market and various trending sectors.

January 10th – Additional Thoughts 
 JANUARY 11 – COPY / PASTE
Scroll to top


Trackbacks & Pingbacks
[…] … Click here to visit the ChartFreak website… […]
Comments are closed.