Our Hands Are Tied
.
That’s what I heard from the Fed.
.
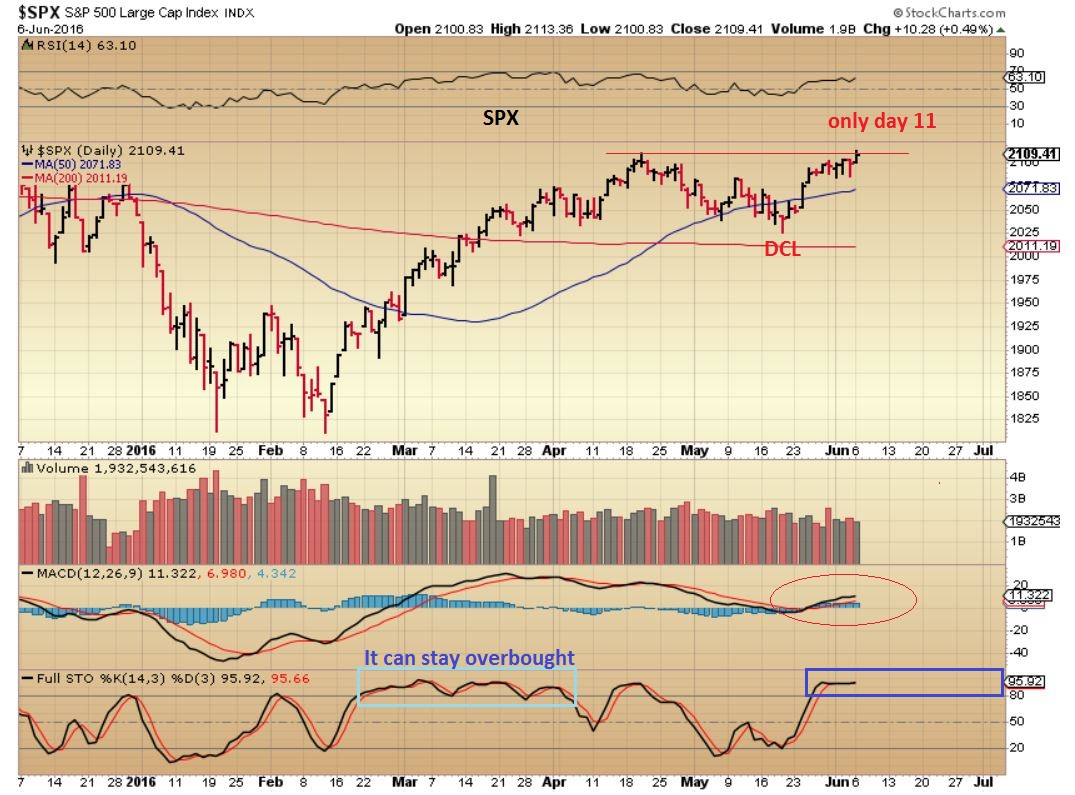
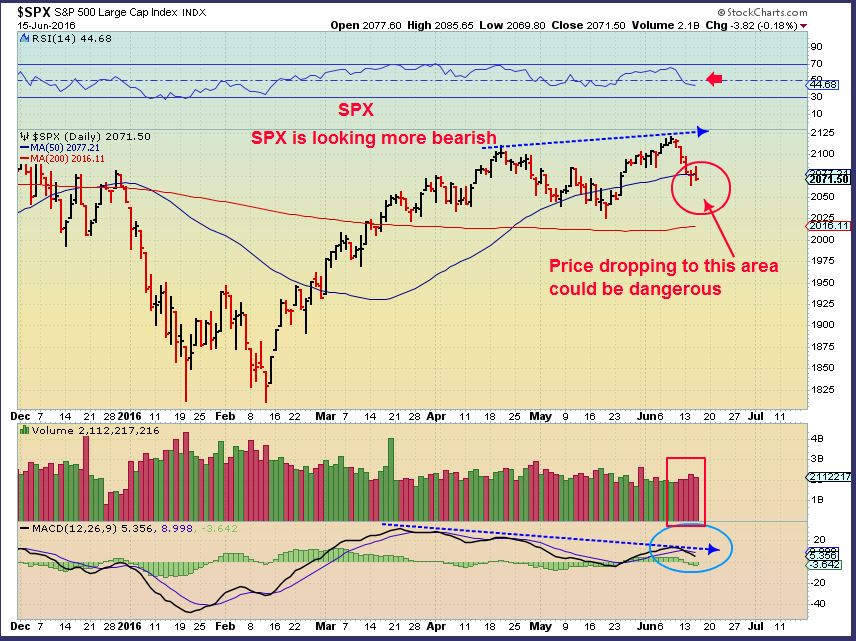
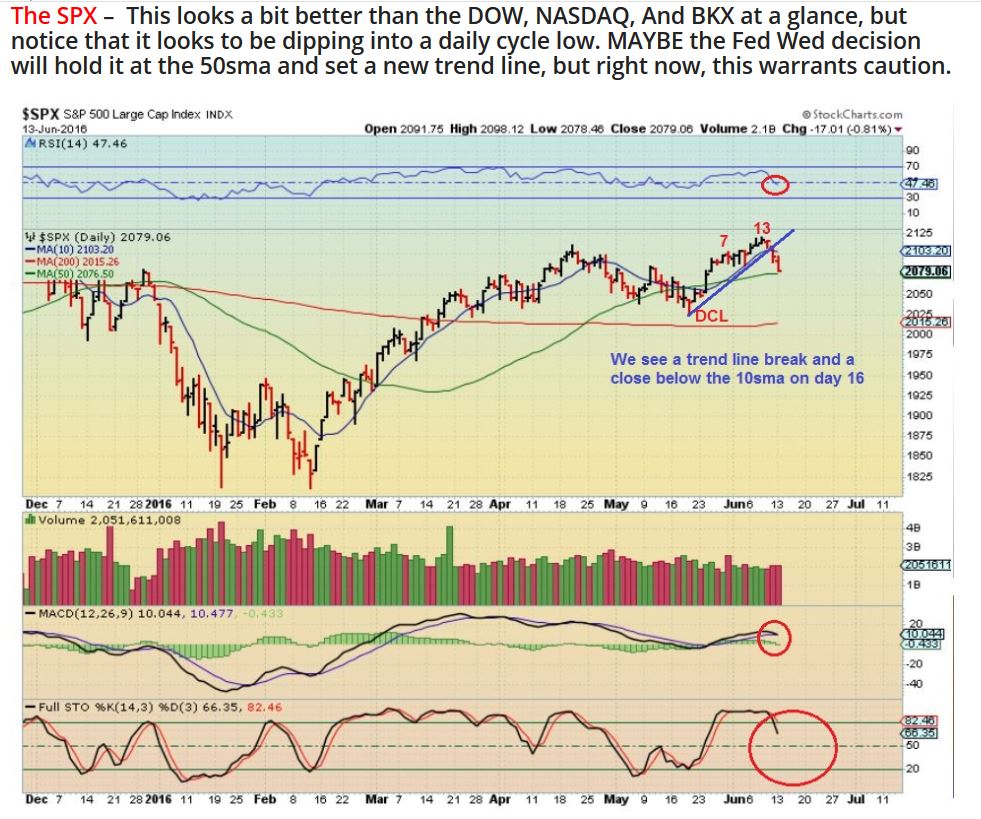
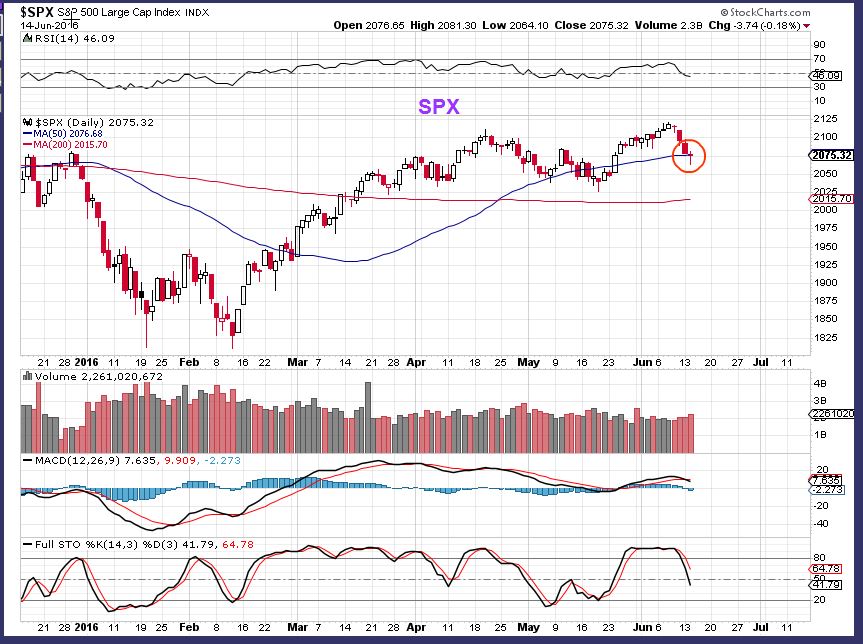
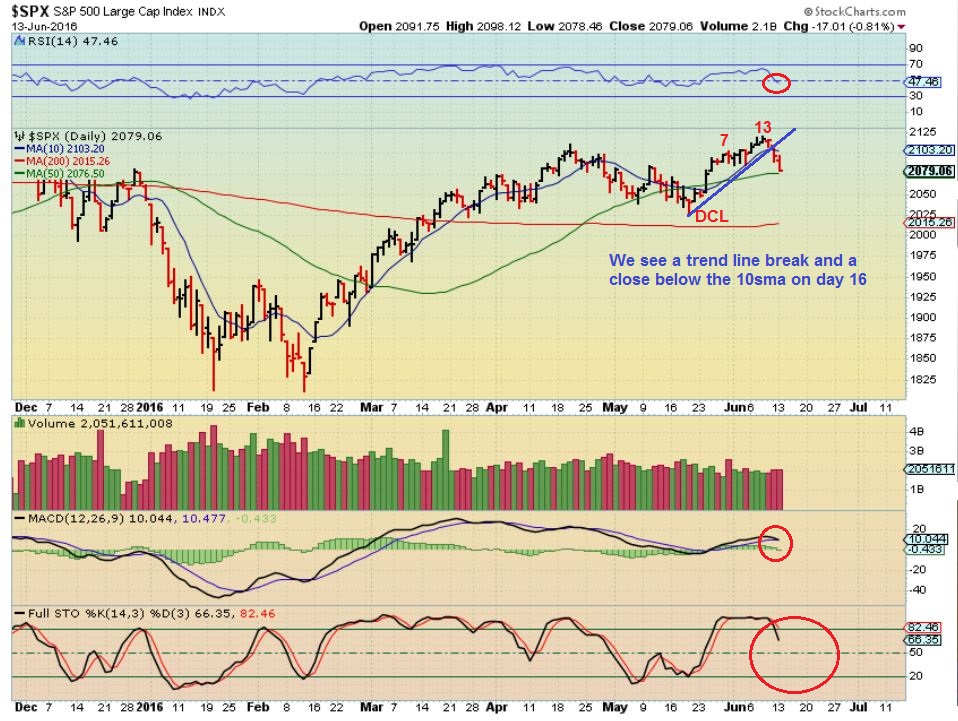
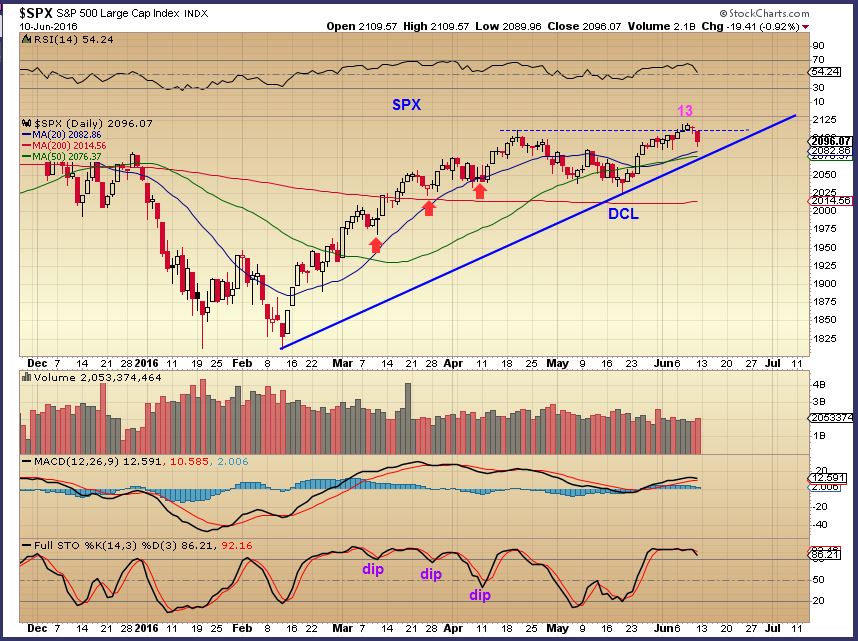
SPX – This needs to move higher soon. It is starting to show internal signs of weakness, even though it doesn’t look like much of a pullback. The VIX looks like a bull flag may be forming.


.


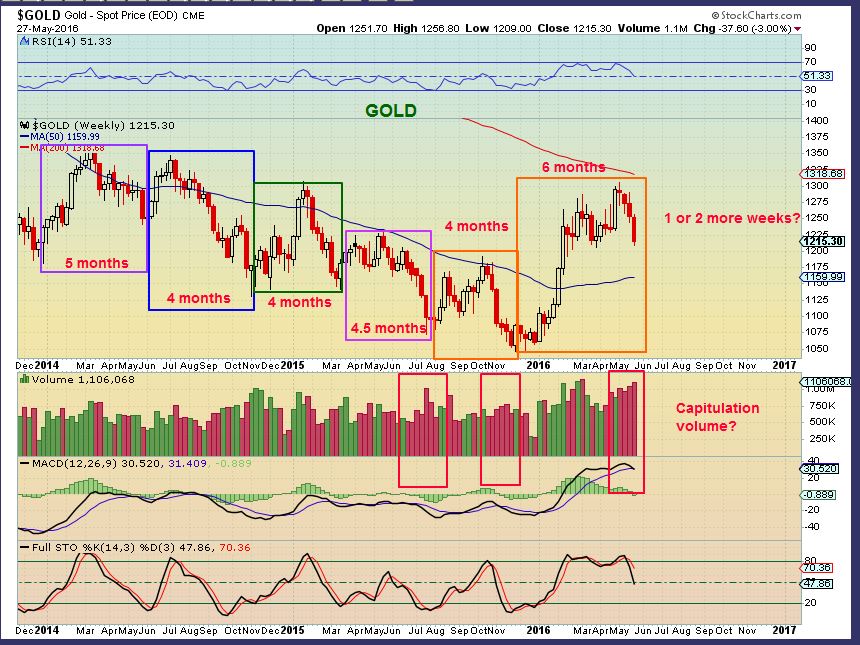
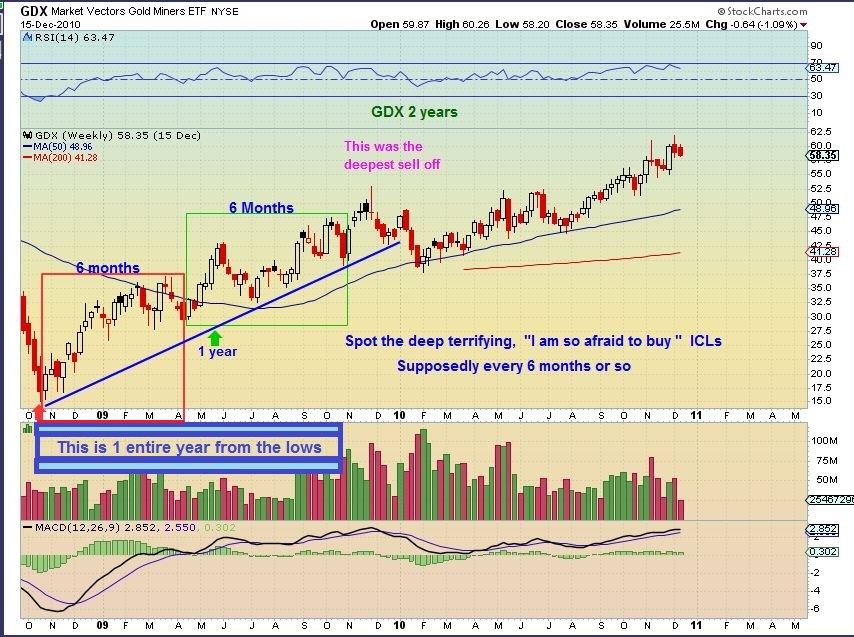
You may have heard that you should not buy precious metals miners until after a ‘blood bath phase’. I mentioned within my (premium May 18) report that I have received numerous emails telling me that warnings were out that the next Intermediate Term Cycle Low (ICL – A cycle low that occur every 5-6 months) will not come until we first see a huge sell off within precious metals. Many fear that the blood-bath is still directly ahead, and some think it will occur around the Brexit vote (June 23rd).
Today, I would like to share with you just a brief excerpt on what I’m looking at here within the precious metals sector. And within my coming weekend member report, I will be going into much more detail on what one should expect in the coming months.
Below is a chart that shows what happened coming out of the 2008 lows, when many were also looking for a an ICL and “blood bath” sell-off. As you can see, advances out of bear market lows do not follow the typical script. Simply put, there was no blood-bath to be found around six months after the Oct 2008 lows…it occurred almost one year later.
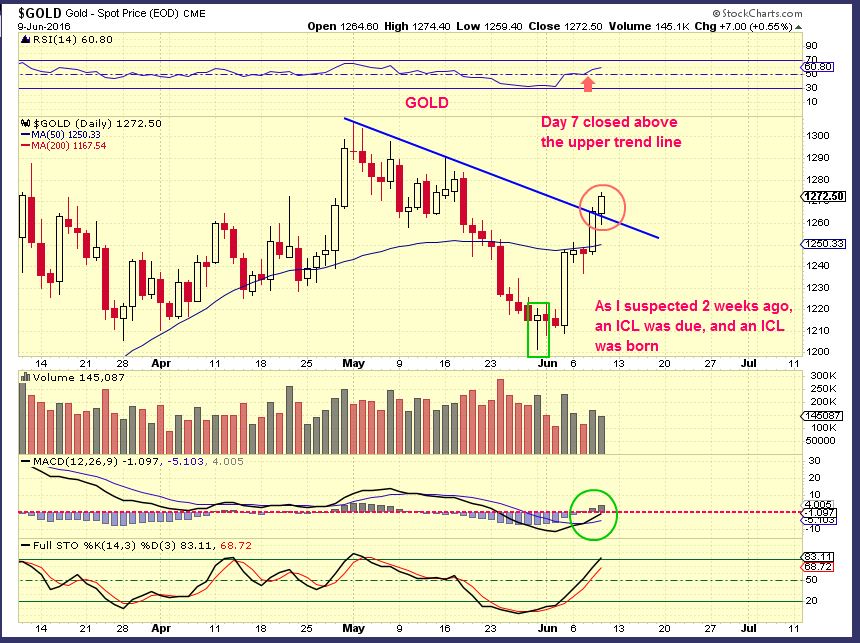
Actually, for the past two weeks, I have been saying that we could be at or past the next important low in the precious metals sector. Last weekend’s report discussed this idea further, and this weekend, I will include more research on that theme.
I also mentioned that a gold break above the overhead down trend line would give further evidence that we saw an ICL, without a blood-bath phase. This was gold on June 9th.
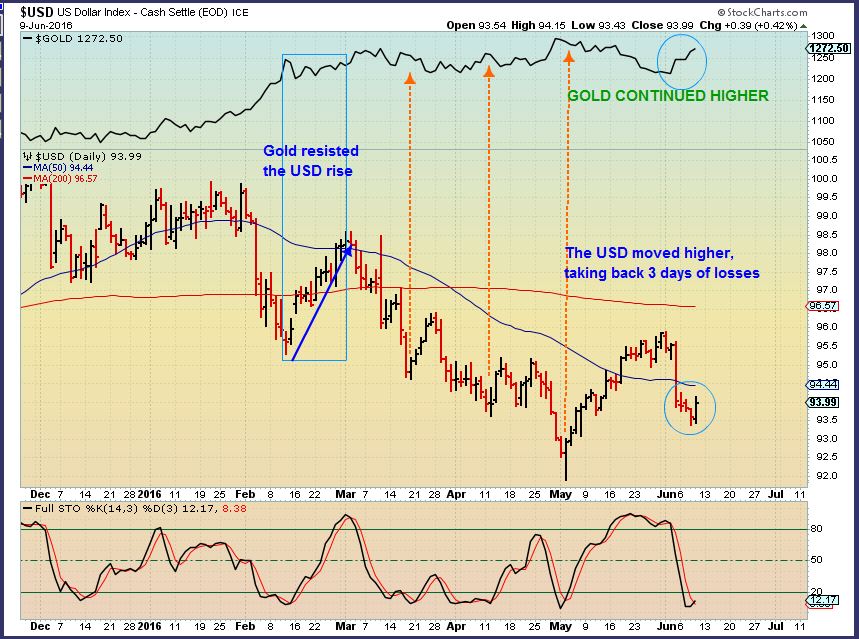
USD – The USD was in decline, but due for a Daily Cycle low (DCL) this week. On Thursday, the USD took back three days of losses, but Gold and Silver moved higher despite this strength. We have seen a change of character here, where the dollar can rise and gold manage to resist the expect drop in response. See also Feb 2016 on this chart.
It will never be a straight run higher with precious metals, it takes discipline and patience. However, gold bull markets are known to surprise and have the ability to leave so many people behind. With this weekend’s report, I will outline what I believe is occurring today and will cover what members could expect going forward.

##

.
.

.


.