
Public Report – Update For The Golden Pennant
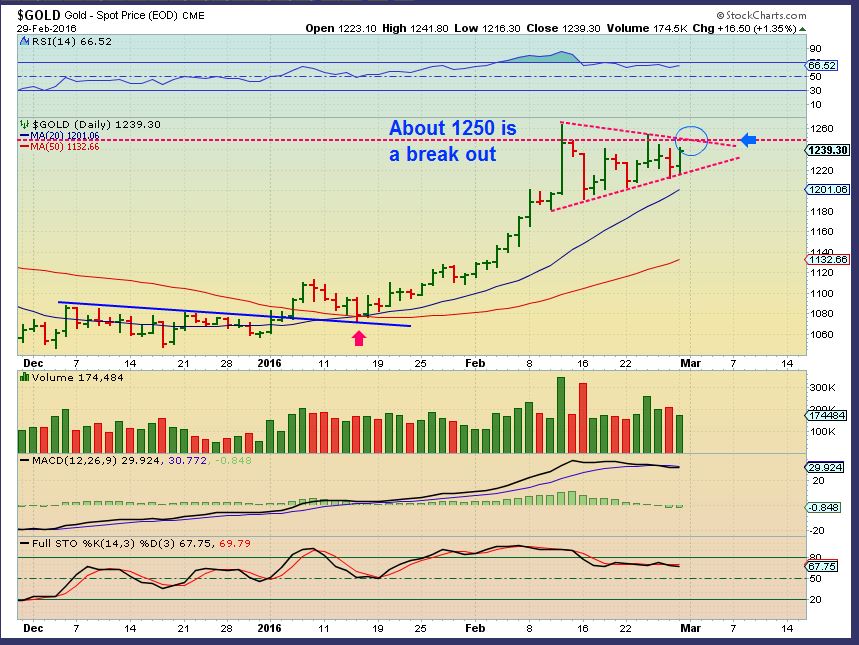
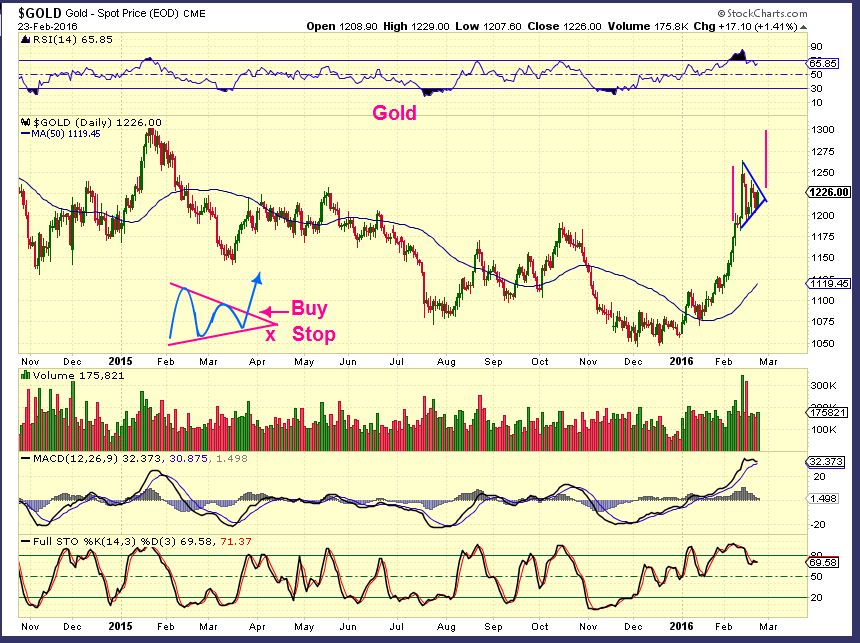
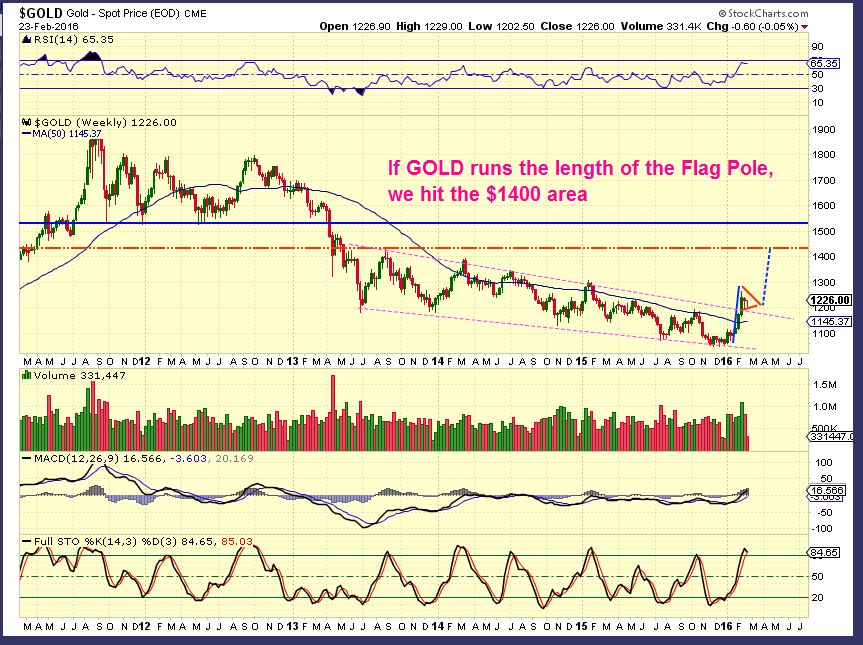
Many people are looking at this almost perfect Bullish Pennant forming in Gold. Many are also looking at the C.O.T. report that came out Friday and seeing bearish implications. Yes, Bull Flags can fail, but for now it remains a bullish trading pattern, so lets discuss Gold here using a few of todays charts from the premium report.
.
GOLD – Gold tagged the $1250 area overnight. That is the top of the flag. Gold could break out from here, but since we are not at the Apex, GOLD MAY ALSO POP & DROP TODAY (SHORT TERM) IF THIS FLAG HOLDS IT BACK. This flag has eased overbought conditions meaning that Gold could still break higher in time .
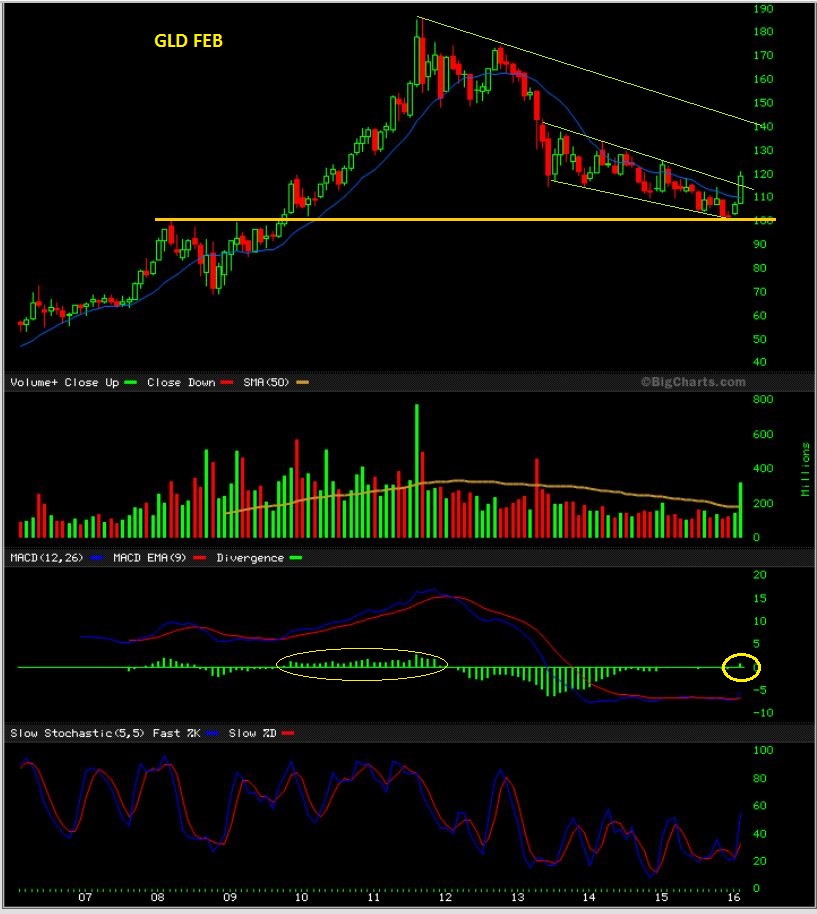
GLD Monthly ( Feb ended Monday). Thats a bullish chart .
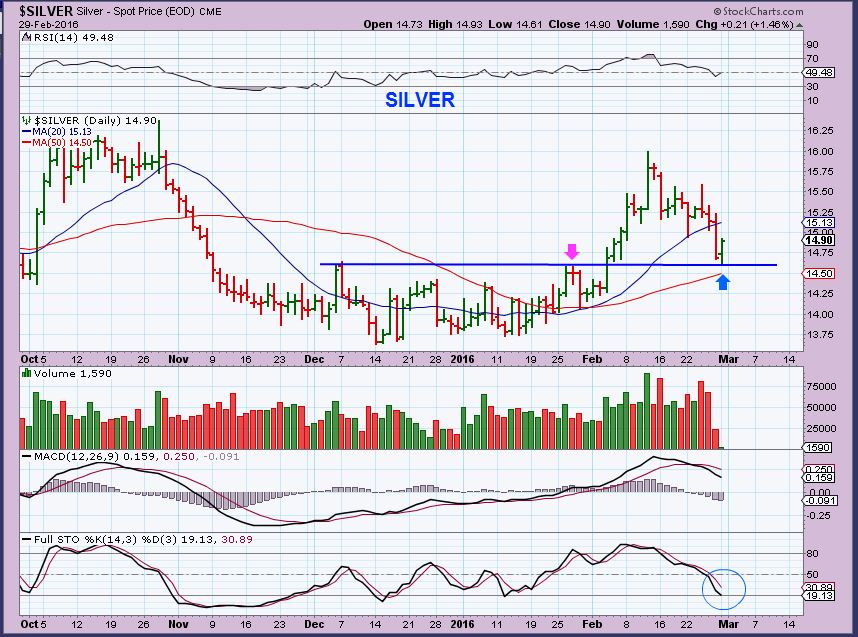
Silver- Silver actually dropped Monday and then bounced off of support. This can be viewed as a test of the break out and also may be relieving overbought conditions. ( I don’t know why volume didn’t appear correctly here).
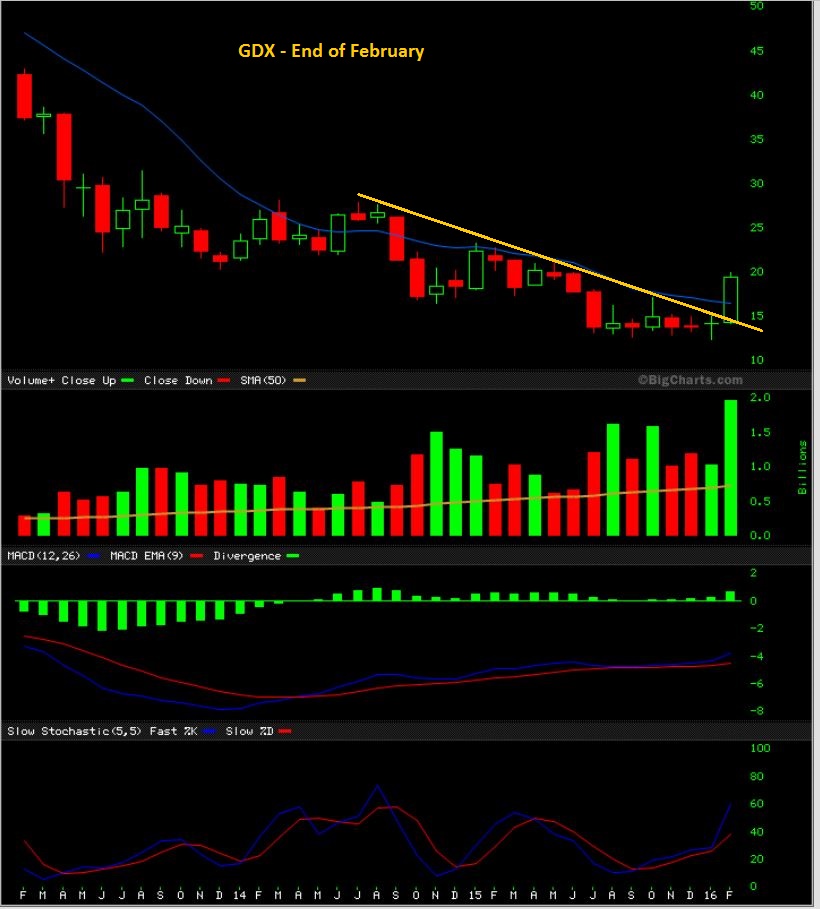
This is a Monthly view of GDX, since Feb ended Monday. This surge with that kind of volume is exactly what you want to see.
I had posted this chart last week with a triangle that I had drawn in at the lower left corner. I’m pointing out that when a Flag pattern breaks out upside, one usually buys the break out and puts a stop below the apex. If it fails, you will be stopped out.
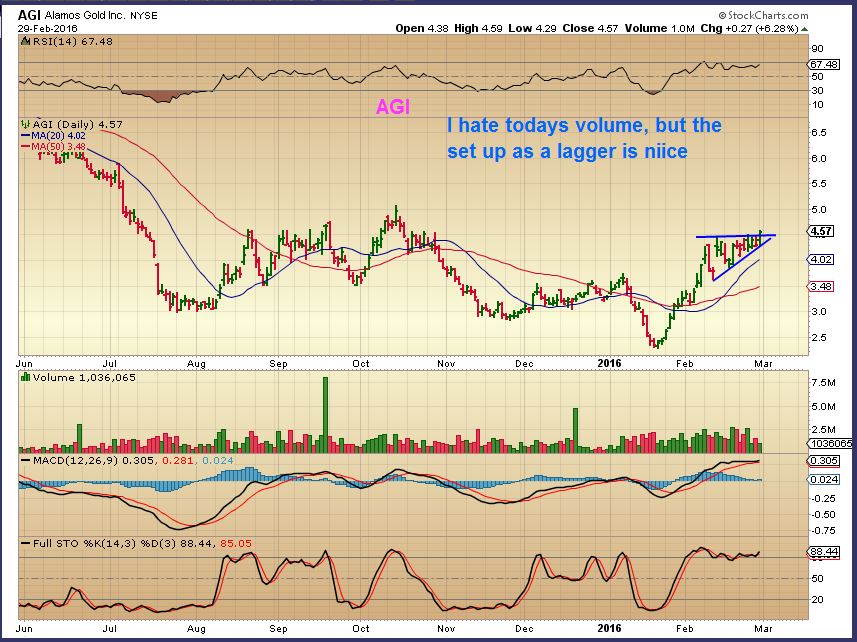
I also pointed out a couple of Miners that have ‘Lagged’ a bit and may be setting up to run even higher if Gold does Pop. ( AGI – Imagine thinking that $2.40 to $4.30 is lagging) 🙂
.
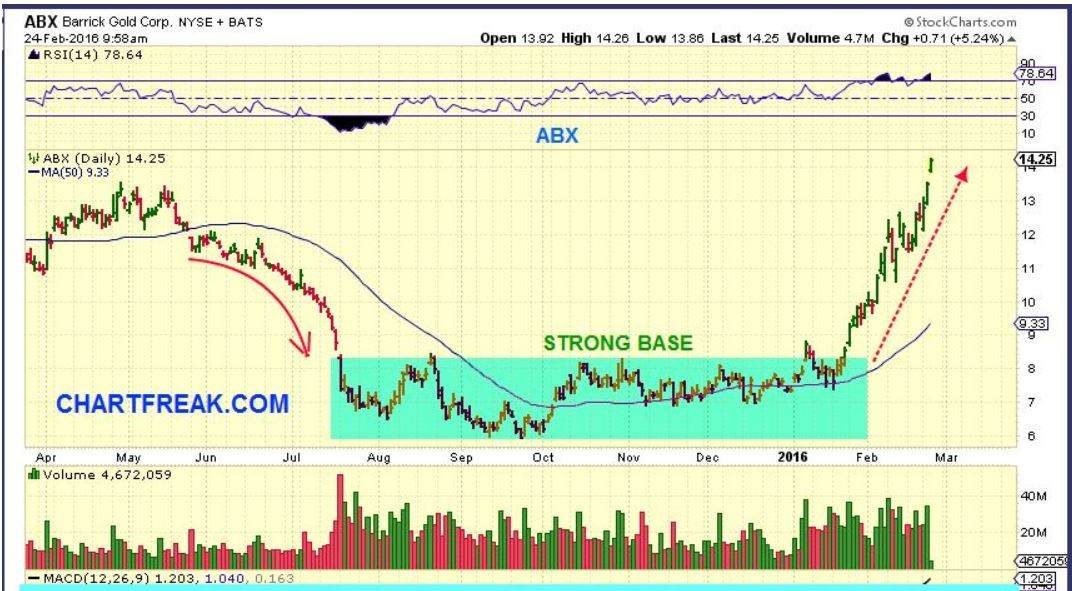
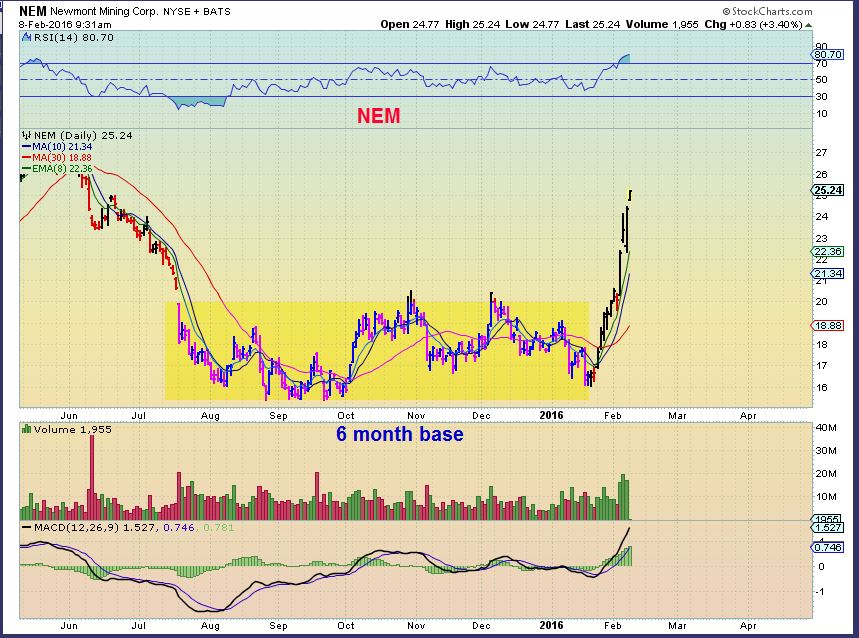
So why do I like the set up in AGI? Look at the similarities between these next 3 charts. Long bases can lead to excellent rallies.
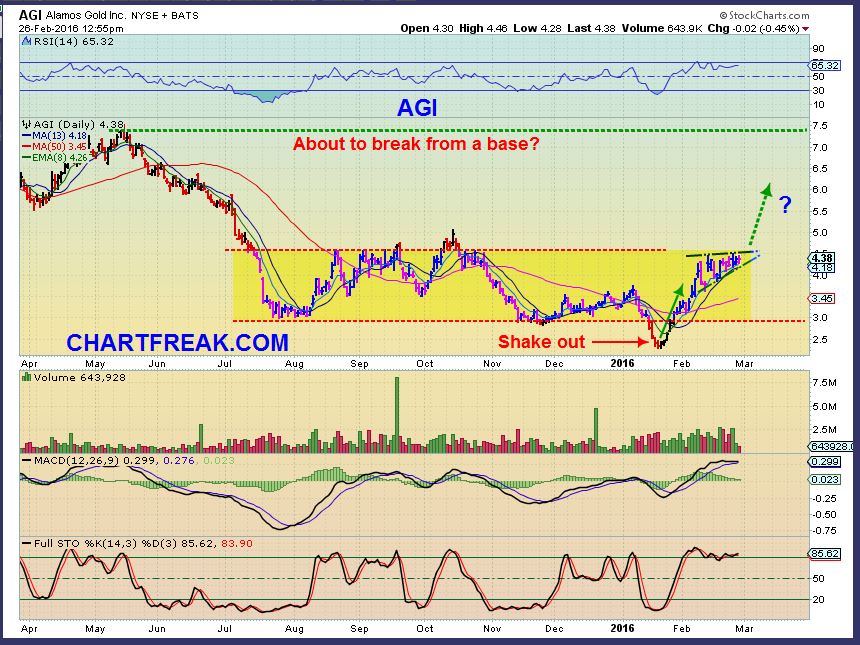
So AGI could break higher out of that base if Gold decides to break from that flag.
.
What if Golds flag was only a 1/2 way point, and the RSI & STOCHASTICS gets embedded? That would prove to be a huge move out of the lows.
.
Yes, The C.O.T. was showing that Commercial shorts are as high as they have been at previous tops. Will this flag fail? It might, but I’m not going to jump the gun and short this bullish move higher. I’ll just continue to tale it step by step, using and honoring stops along the way.
.
Best wishes and thanks for being here.


Good morning, Alex –
Do you remember starting the 2nd week of February by noting GDX closing above 16 would be important? That seems so quaint now! …even if so true
I’m not very good at navigating your site, so wasn’t able to find one of your charts on FCX – do you have one you could post?
The December, 2008 low of 7.85 seems to be strong resistance – that price is also where the trend line connecting the highs of 2014 & 2015 is currently located-ish. Would you wait for a breakout to buy (for us longer-term folks)?
Thanks for all your great work – lovin’ being here!
Hi Cal, let me take a look and draw up a chart. ( By the way, I have 2008 lows of $6.29 )
Ok Cal,
For ‘Longer Term’ buy & hold and hope the lows are in type investing, you may have to wait for a break out and it could put you in above $9 (refresh)
There is resistance from 2008 consolidation at the lows.
.
Short term chart, this could drop down and test the 50sma and not be a bad chart, so waiting is not a bad thing if you arent a trader. And you can remind me to keep an eye on it anytime you wish.
Thanks so much, Alex!
(and it’s so strange that ThinkOrSwim has a higher print for December, 2008 low…
http://tos.mx/WPgDID
Maybe they went on a closing bases, and not the lowest traded point?
Nope – showing closing price for December 2008 to be 12.22
Additionally, TOS shows Jan. 2011 high as 61.35 – while your chart shows 50.38
…strange
HMMM, My brokerage has $7.80 as the lows . Thats probably the true number
StockCharts “unadjusted” price shows $15.70 as ’08 low.
– we offer the perfect price to suit your every need:)
(refresh)
What would a good entry point for X be?
thx
At this point, I cant tell if it wants to drop to the 8 ema ( I think it did today) or does it want to go all the way to the 50sma, So I cant tell at this point. I dont like High volume off the top – so I’d be cautious until it plays out a bit more
I was watching CLF & VALE for my entries too. ( Maybe DRD, breaking from the flag, if I can get a gap fill with a tight stop)
CLF reversed and went higher ( X may do that too. it’s just too hard to tell when a stock is in the middle of a move.).
Good morning Alex,
If I am reading you correctly You are basing your 50% ReEntry into Gold stocks based on your Gold Triangle (wave 2) break correct ?
Hi Ken,
I’ll have to go back and re-reard what I wrote, but I am not doing a 50% ReEntry. I was 100% in off of the lows, and then I went to taking profit on about 1/2 and riding some & trading any set ups that I think might be lower risk ( Not chasing the higher flyers.
If the Gold flag breaks to the upside, I will need to see if we are starting a second leg higher. A bull flag price projection isnt the length of the pole ( though it may do that as an A-B = C-D move) , as much as it is bullish break and a continuation.
I dont know if you thought that I was saying that I sold 50% , I’m still riding 50% of the original order, and will go all in on a break of the flag. How heavy I go on a break of the flag will be determined later, but as a trader I will be actively trading the move ( Prob not NUGT on the next run).
We are on the same horse ( for Maria 🙂 )
I wanted to clarify that you are basing those decisions on the price of the Gold chart not the GDX chart, once/if broken your then be adjusting your Gold stock basket ……….
Yes, and the GDX chart looks a tad more ‘rough’ at this point
If you look at the GDX chart from a cycles point – we are LATE in the cycle count and the high was on day 25, so extremely bullish as far a right translated. A quick drop down & recovery to break the trend line would be a perfect signal.
Agree……caution may be warranted based on this chart.
CLF – nice recovery today,
AKS – sold off and recovered.
FCX – Dropped and recovered.
STLD – looks like a buy here
Vale – is a buy i.m.o.
Now I wonder if X will do the same?