It’s In The Charts
Well, the past several weeks have been excellent for trading Metals, Miners, and Energy, and whether you follow me in the Public area or the premium side, I hope you’ve had a chance to make some solid gains. I’ve already discussed in past public posts about chart set ups in Miners and Commodities like X, AKS, FCX, CLF, etc, so Lets take a look at the recent crazy but very lucrative trading set ups in Energy.
OIL & ENERGY – Why?
.
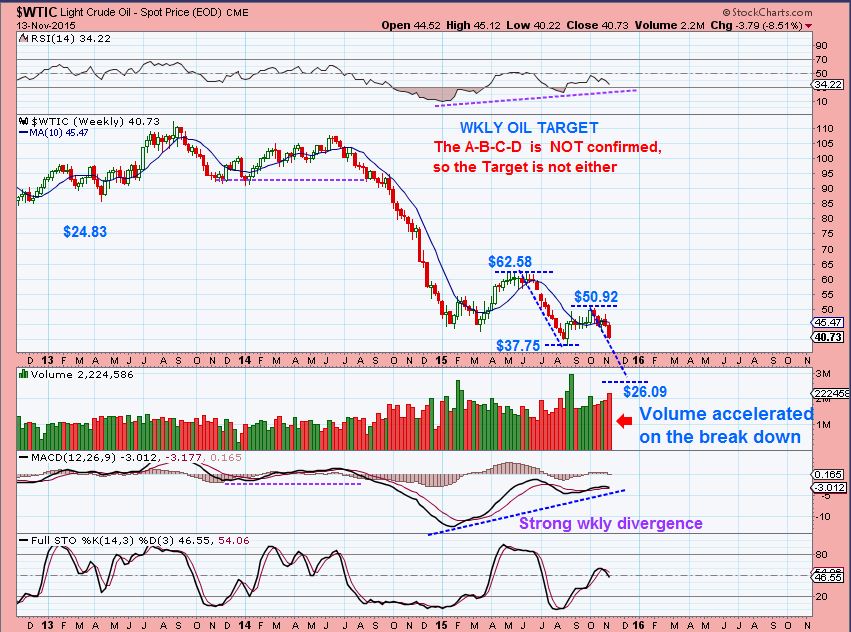
WTIC – As I pointed out in a public report weeks ago, I was looking for a possible bottom in Oil around $26.09 from this Nov Wkly chart.
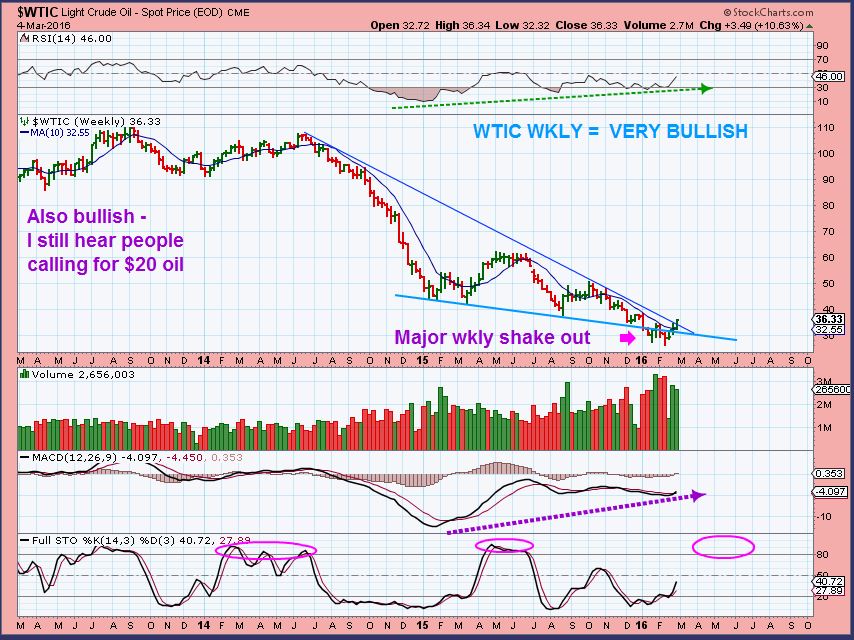
WTIC WKLY – I believe Oil bottomed in a shake out type manner. Is it just a bounce? This chart looks quite Bullish.
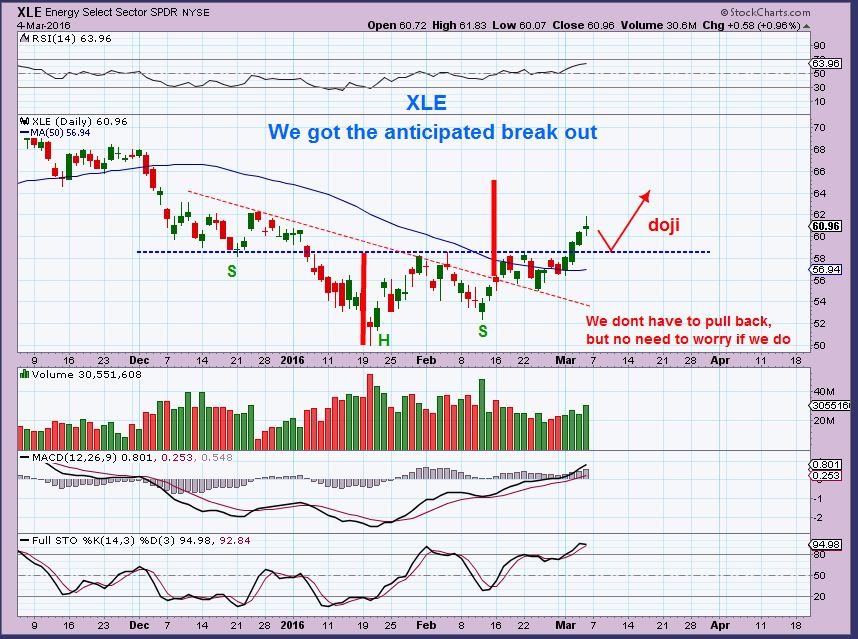
XLE – In my Feb 16 report, I showed this bullish divergence and mentioned that Oil just broke to new lows, but Oil Stocks were making higher lows (Bullish). I pointed to the oil stock WTI as an example of a bullish set up with Oil making new lows. So I kept my eyes on this sector.
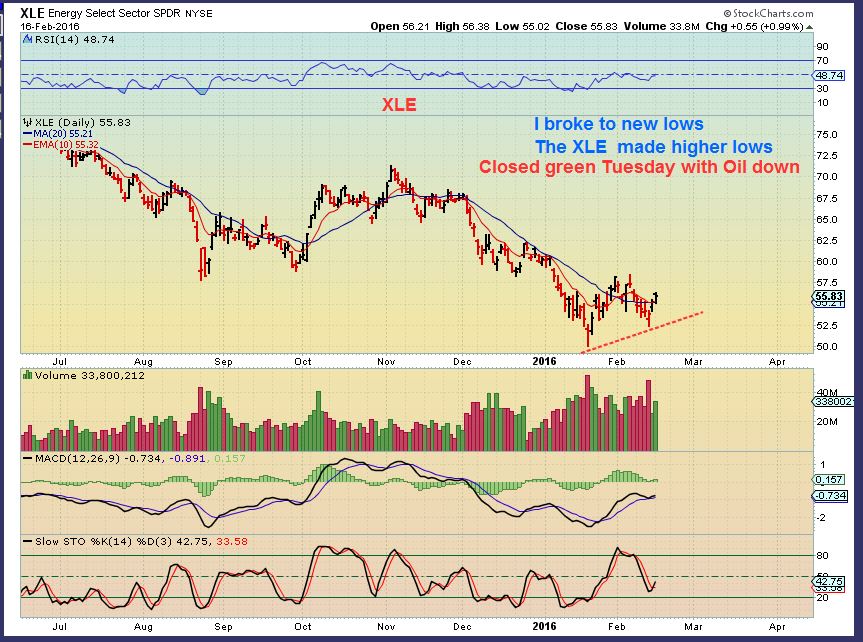
XLE – Now we have a possible inverse H&S with a measured move to roughly $65. My gut says that Energy stocks are not done moving higher after that target is reached.
.
Lets look at some Charts that indicated these tiny rockets in Energy would be explosive.
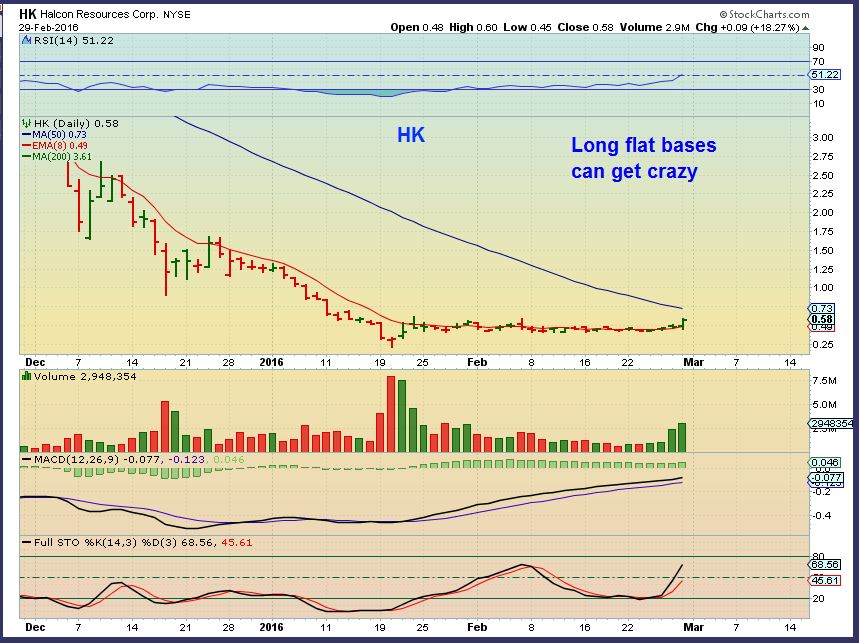
Feb 29- I loved the flat base of HK. This jumped from $0.40 to $0.58- UP 20%. I was saying that just because it is up 20%, DOESNT MEAN you’d be chasing, because this is an explosive set up. This was a buy , even though it was up 20%.
HK – up another 60% Friday ! Today (Monday) it is up another 40%. Explosive.
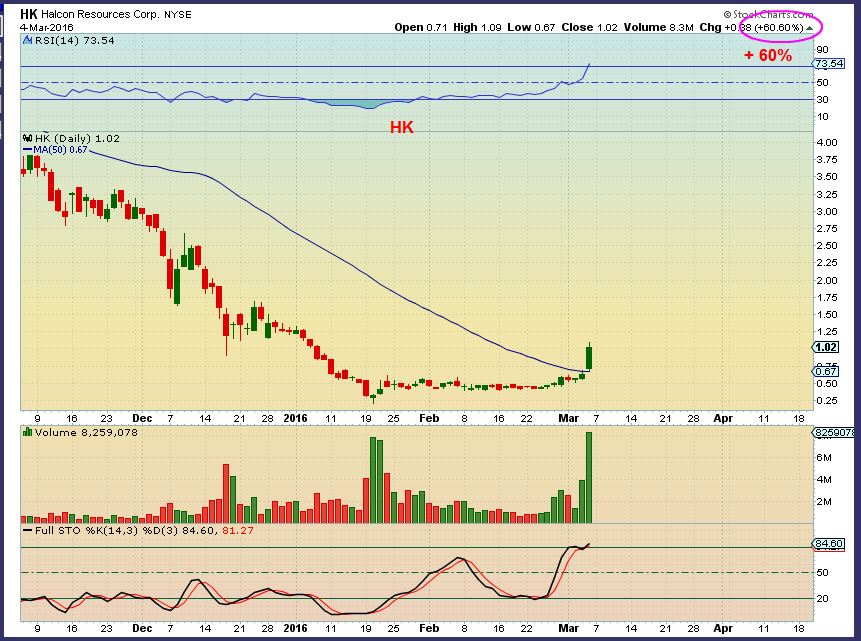
I want to point something out here. Usually a stock pops 20% and you bail out and take the gains. Many of these charts say something a little different, like ride your winners. (We did that with X, VALE, etc, so I wrote this to my readers).
.
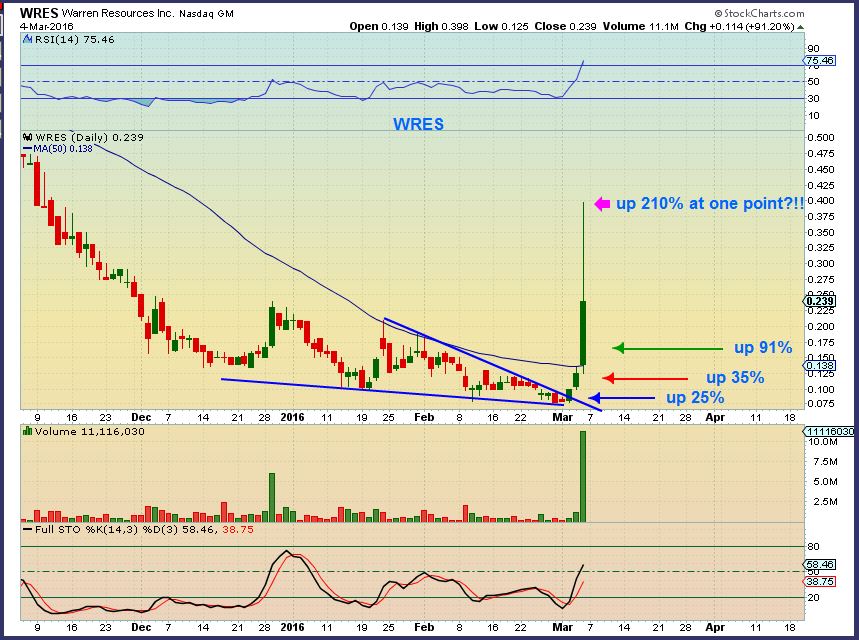
WRES– I didnt buy it, this was a sample of how these can get crazy.
Notice that it was up 25% Wed, then another 35% Thurs. Friday it jumped an additional 200% and dropped to “only” up 91% Friday alone.  Crazy tight wedge pattern after a steep sell off.
.
So these are just a couple of the ones that I pointed out as proper set ups
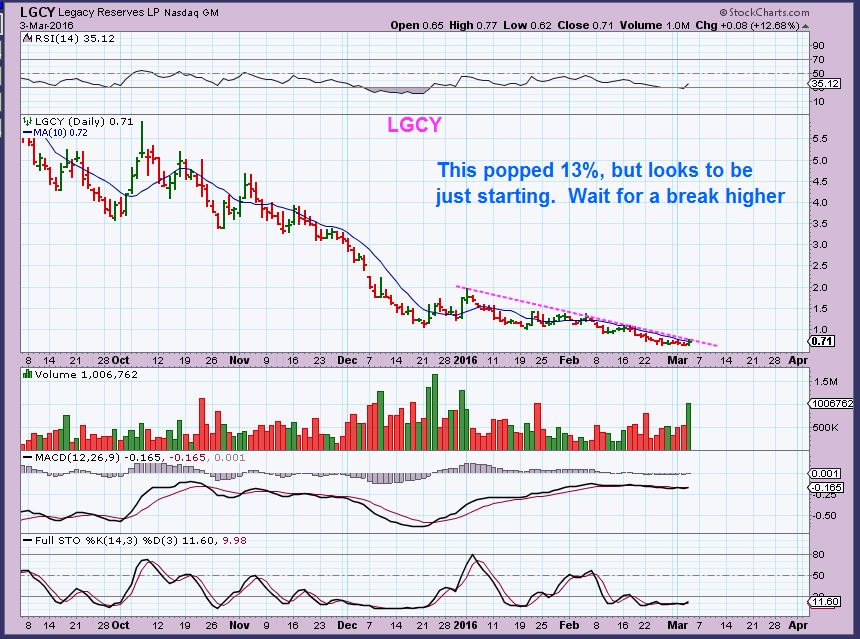
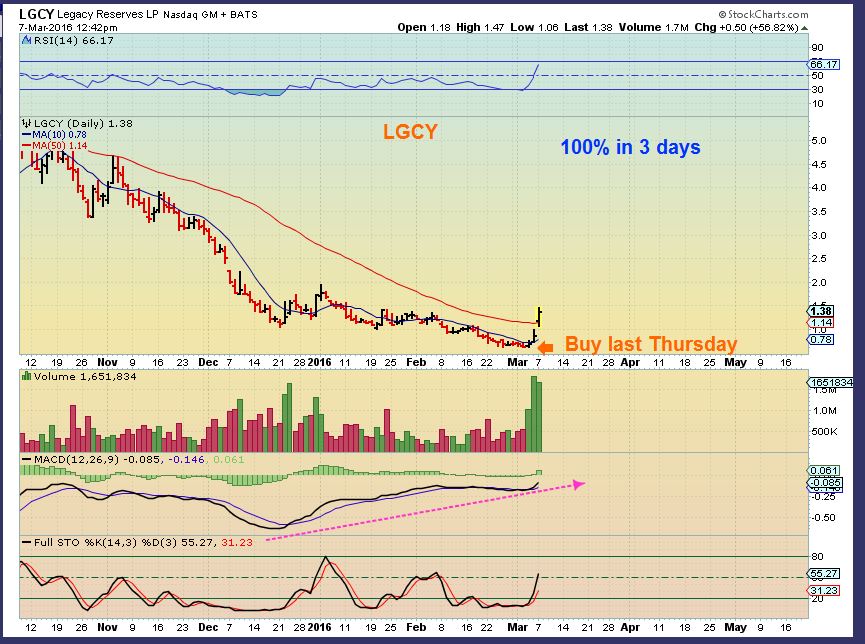
On the March 3 chart – I pointed out this tight pattern in LGCY . You want to catch it before it explodes. It broke out Friday at 75 cents and I bought it. It closed at $0.88 Friday.
.
LGCY today up 58% so far. ( Monday)
.
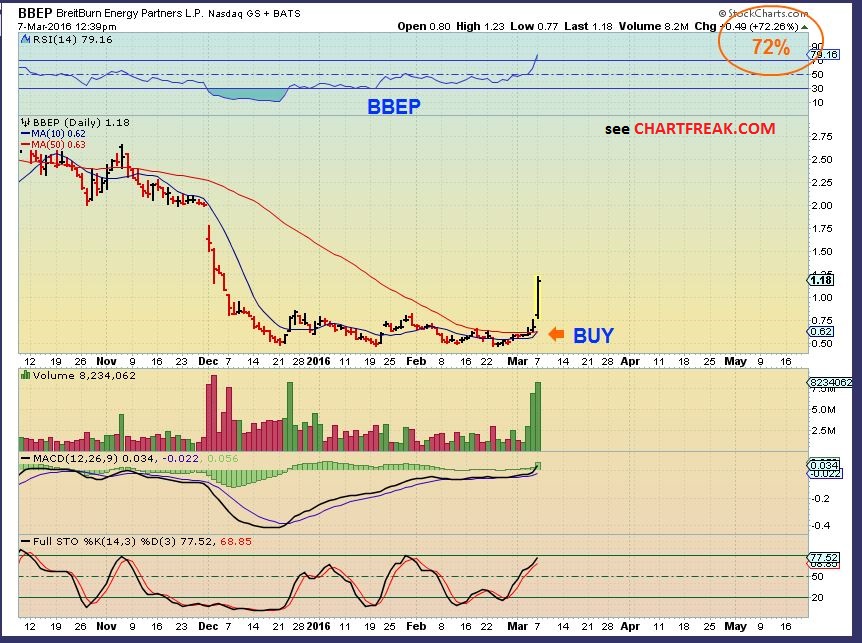
BBEP – This was lagging and pointed out last week as a buy in the chat area, the chart set up was right. This is it today, actually now up 80%!
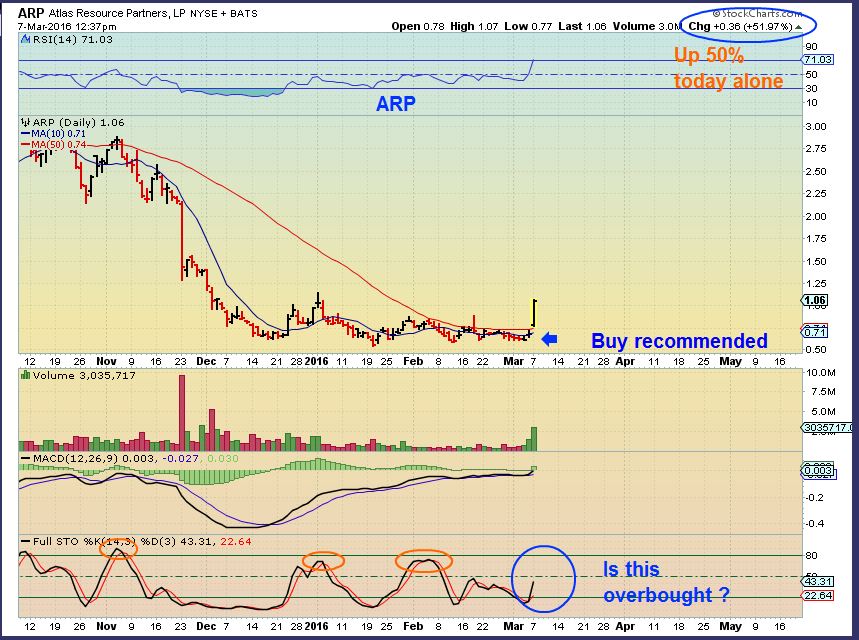
ARP – I liked this one last week too. It had great divergence in that MACD and volume this morning was coming in strong, so this is after the open this morning (Monday) .
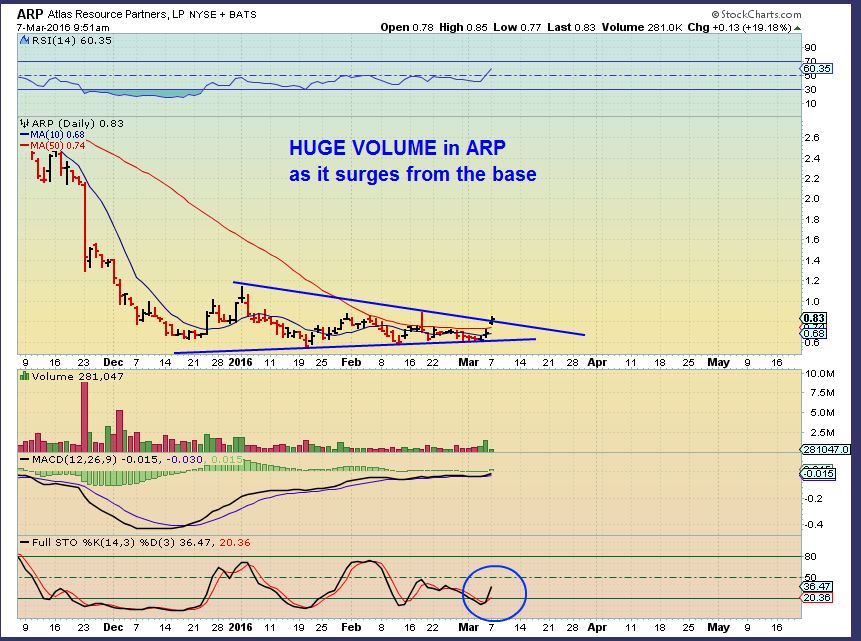
This is ARP at 12:37. It just hit $1.16 up well over 66% today alone!
Now lets look at the bigger picture like we did when we look at the potential for AKS, X, CENX, etc.
.
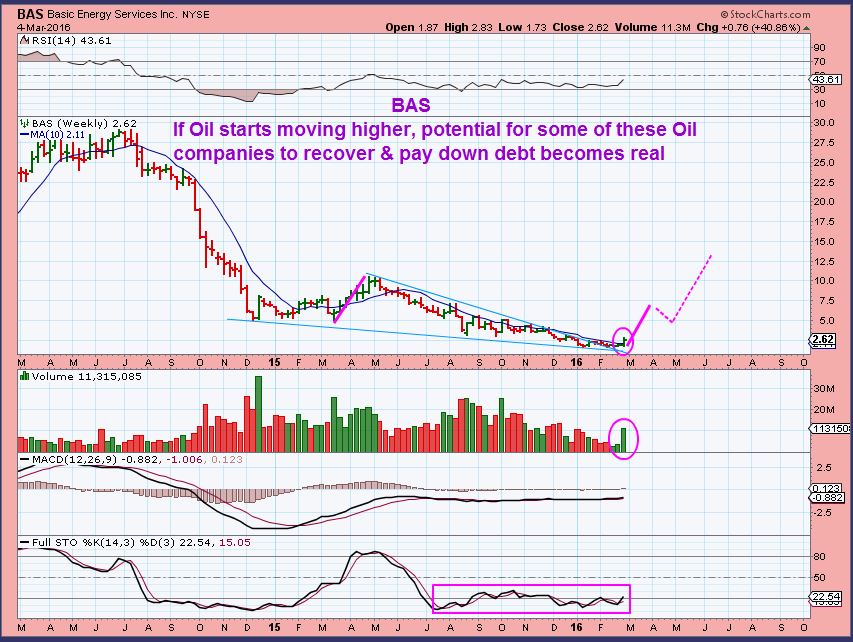
BAS – This is one that I mentioned I bought earlier last week. It is also up another 33% today. It was a tight weekly pattern in this triangle. Now on a weekly chart, it looks like it is just getting going, doesn’t it? Thats a 1 week candle. Look at the run in March of 2015. It ran for 6 weeks. We now have bases when OIL was $27+. Higher Oil prices may lift these back up.
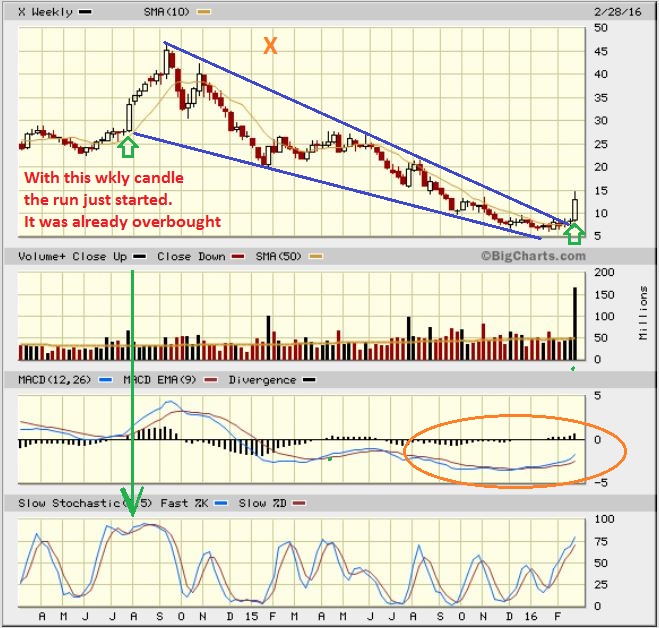
X–
The weekly charts show the potential. In the summer of 2014 X popped like this and moved higher for several weeks too. That was when it was already overbought. We may see a pull back soon on a daily, but longer term these can run a lot higher.
.
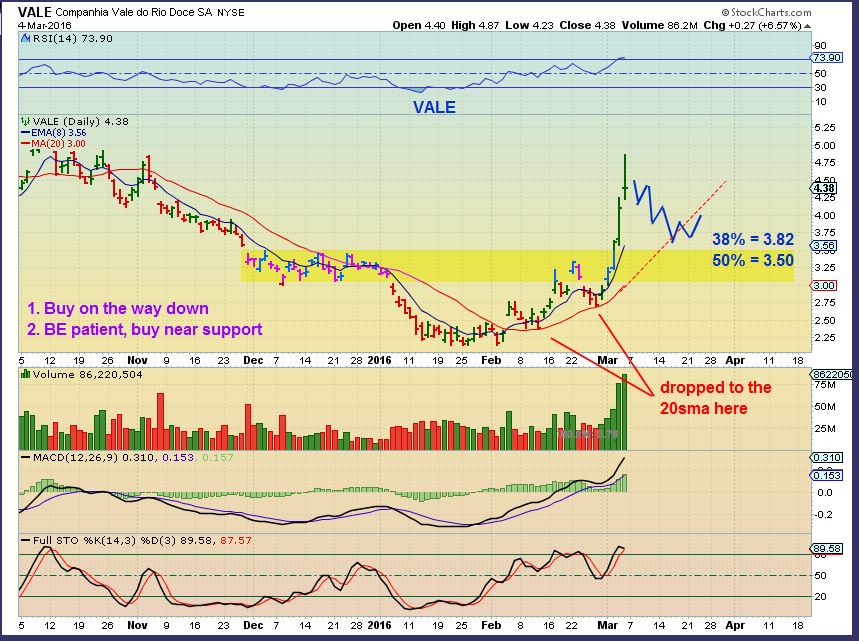
So I do expect that we’d have to see some kind of pullback in many of these commodity stocks that have gone ballistic. Let me show you how this could take place in VALE for example.
.
VALE – I gave 3 possible ways that this could pullback. I’ll just post 1 here. When it does drop, it could become a great buying opportunity down there for the patient trader. However…
.
.
ENERGY STOCKS:
What about OIL For the investor that doesn’t like stocks under $10 and they have more of a BUY & HOLD approach. Yes, there is always XOM and CVX, but there are others that may have better %-Gains based on their charts.
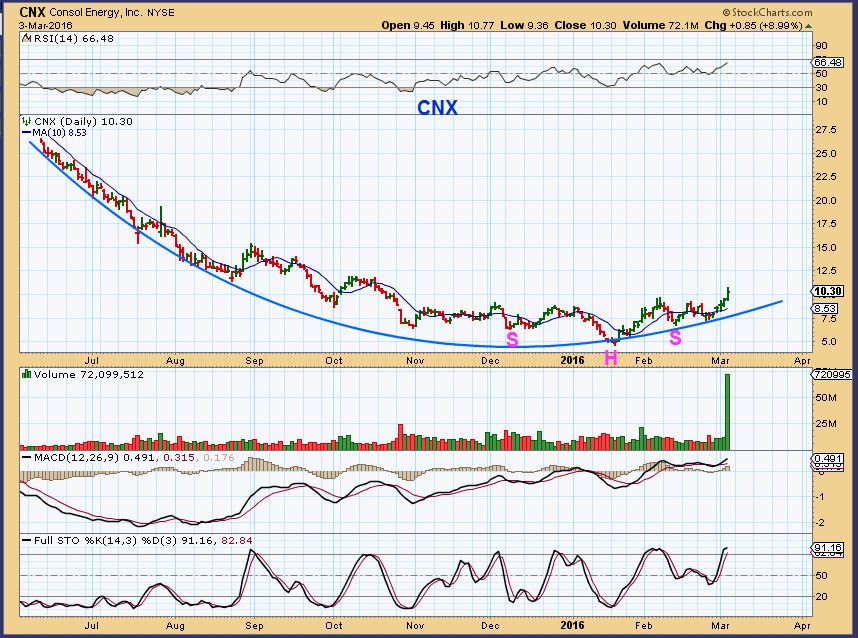
Set ups like CNX that I pointed out in Fridays report may be longer term buy & hold, due to the steady base.
.
Someone with only $1000 to trade could have bought one of these stocks today and it would have paid for 3 yrly subscriptions  . I’m kidding – Obviously I wouldn’t advise putting all your money on 1 risky trade, but you see what I mean. The monthly subscription is only $37.99.
These Mining, Metals, and Energy stocks are screaming out of constructive bases. There is no way of telling exactly how long these runs will continue, some of these runs may even be ending now. Pull backs could be quick , or could last for weeks. Even when the crazy upside short covering & buying eventually dies down, I think that the pull back in Precious Metals , Commodities , and Energy could offer the next best set ups and %-Gains. I will be watching how they retrace and looking for the next best set ups at that time too, in Energy and other sectors breaking out. Stay tuned!
.


Alex.. do you know if Swift SFYWQ & Magnum MHRCQ are up the creek, sans paddle?
I think Ugaz might be a big time watch. Nat gas hit 20 year low ($1.61) last week. Bottom was in. Tomorrow will decide for me where we going. Alex your input?
i’m no Alex 🙂 …. but it (UNG) looks to be forming a perfect R shoulder of an inverse H&S
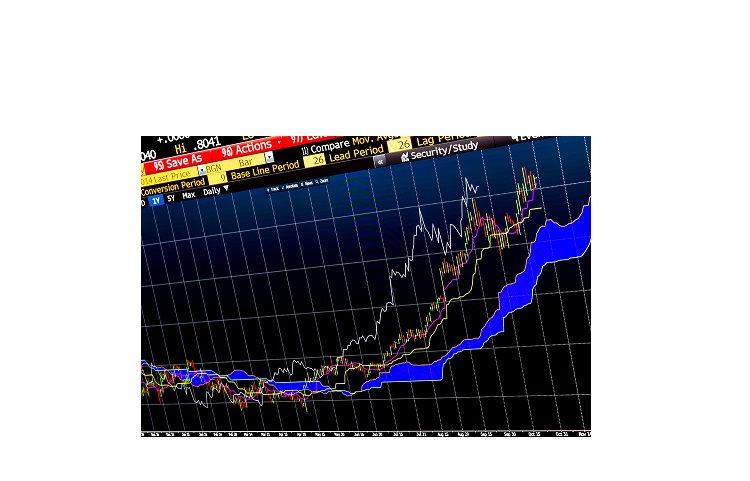
you jumping in on ung or ugaz? Im loving BAS chart that Alex posted only worried it might be overbought, but so was gold so was X and look they all are still making gains https://uploads.disquscdn.com/images/bf5c4bb1acbda63627e1b97dc3da4e1c942edd7b44c2e5d181d791bdd7912356.png
i already jumped the gun and bought UNG on the way down, (near these prices now).
may top up with some UGAZ for short term when MAs cross over
Anyone here have GDP? I bought this morning ….it’s going ballistic, yet is not one of Alex’s stocks. Selling half and letting the half run….crystal
Its only up $0.03! 😉
It’s now GDPM Goodrich Petroleum. I bought it at .09 and it’s now .16 – pink sheets – which I normally don’t do – but it’s a Denver based company that I am familiar with and I think can bounce hard in this recovery
i tried to buy that,, but TD wouldn’t let me
I should note it’s now GDPM
Thank you!
ASPN?