$NATGAS – Public Report
I’ve been hearing a lot of talk about the NATGAS plunge. It has dropped roughly from $3.00 to $2.00 since May! It’s bouncing today , so I wanted to take a look at a couple of charts and point out to members in the premium report this morning what we have before us technically. I will share 3 of those charts here.
.
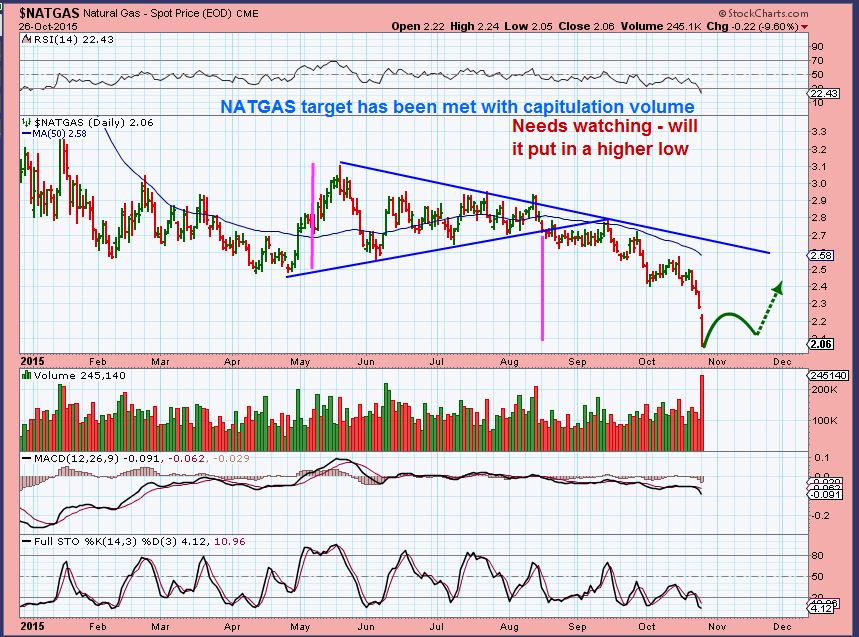
Starting with a close up. ( Note: This volume was erroneous and later adjusted at stockcharts).
NATGAS has basically finished a measured move. It also broke well below the Bollinger Band, so a bounce was to be expected. A buy for a trade maybe, but will the bounce put in a higher low or could it roll over like prior bounces? It would be good to know.
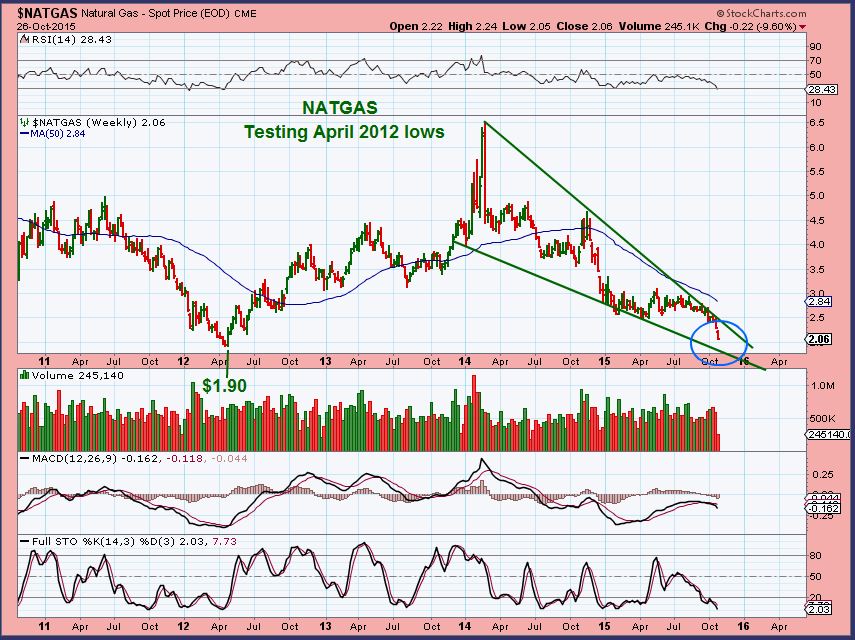
So stepping back, I see that a bounce to the wedge and another drop wouldn’t be out of the question. If I was trading this bounce, I would keep this chart in mind. Prior lows in 2012 were at $1.90. and the lower wedge trend line is around that area. Lets zoom back one more time.
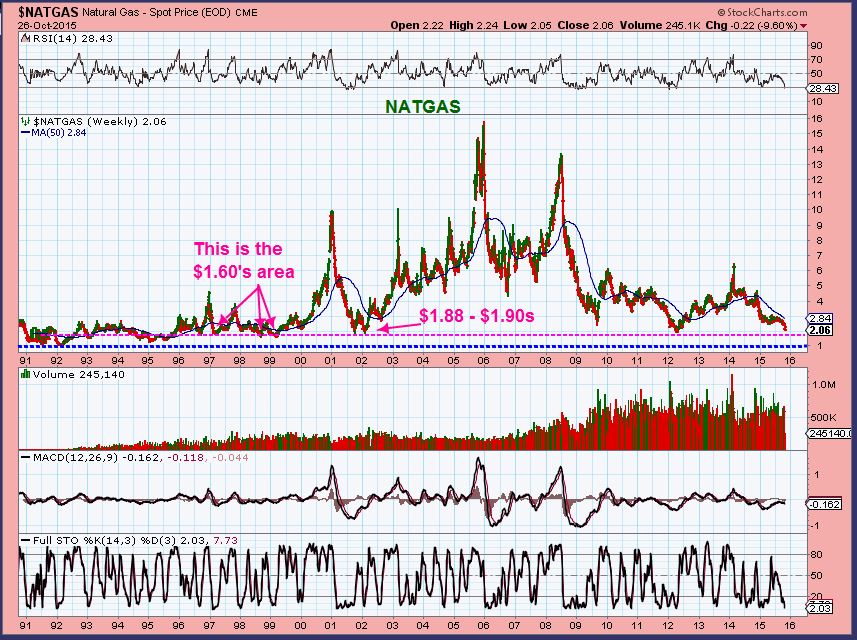
This chart shows that a prior Double Bottom Low in 2002 in the $1.88 area. That 2nd low on that double bottom was an undercut of $1.85, so we may see support in the $1.80’s and lower $1.90’s. $1.90’s since the 2012 lows were $1.90 shown in the chart above.


bought some UGAZ @3.61