Archive for month: July, 2015
I wanted to write this late day report for 2 important reasons-
1. You've been filling up the comments section on the last report, so I thought you needed a fresh space to write in 🙂
2. Even thought things are still playing out pretty much as expected in certain areas, this is just a reminder about being able to sleep over the weekend.
Lets do a quick review...
Read More Wednesdays Fed Meeting went off without a hitch. Sometimes the following day can get a little volatile, so Lets look at some clues within the market moves and see if things look normal or sketchy
'
SPX- bounced off of the 200sma and now has good follow through above the 50sma. I would expect a possible break above the recent highs
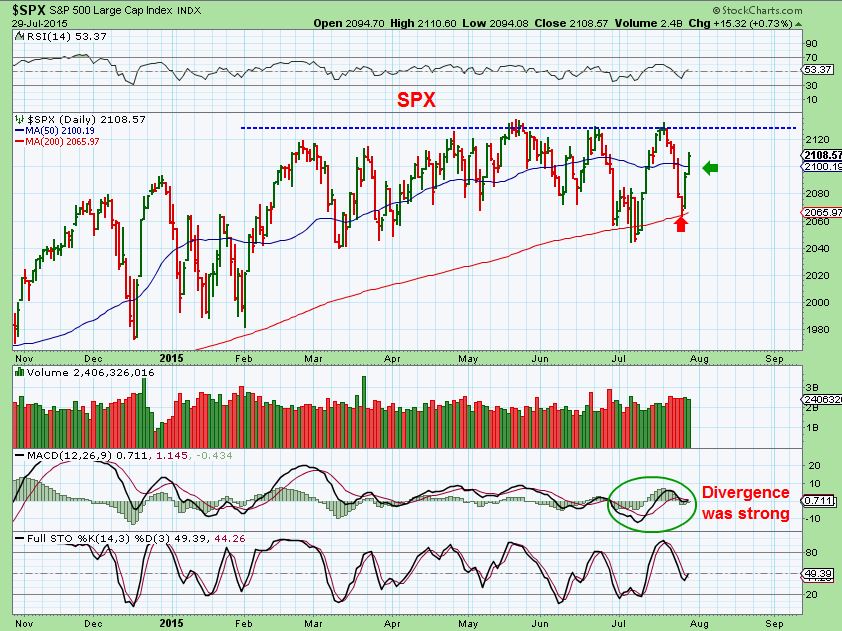
You cant help but notice that the markets have been basically going sideways all year. Will they break out here and just start a nice rally? Here is an interesting clue...
Read MoreKeeping in mind that anything can happen on Fed Wednesday, Lets look at some Pre-Fed Charts and a few possibilities.
.
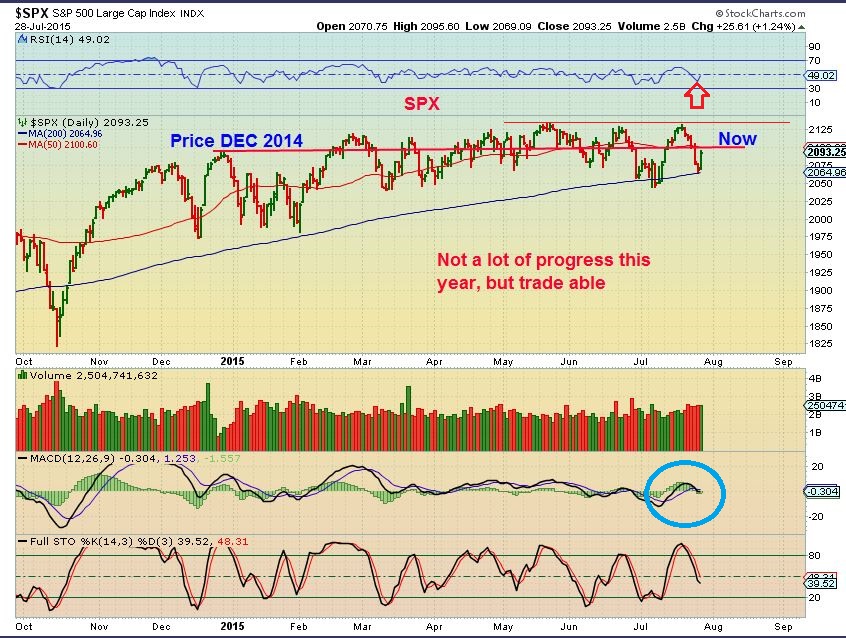
SPX - Nice reversal at the 200sma. It look like it wants to go higher, but can it finally break to new highs?
 Read More
Have you ever heard the expression , "You have to play the hand you're dealt." ? Well, that term is usually used when you are dealt a bad set of circumstances in life. You need to do the best you can with what you have in front of you. In the markets you can choose to sit this one out, use whats in front of you, and so on. The choice is yours. Right now we have been dealt a pretty good hand, but tomorrow we'll be playing against the Fed. 🙁 Thats not always a bad thing, but we should also try to think in terms of what could beat our hand and prepare accordingly. We will discuss that further in this report. Lets discuss the charts right now.
We are seeing a variety of things in the markets.
First we see that the SPX landed on the 200sma. Futures as I write look ready to give the markets a good bounce.
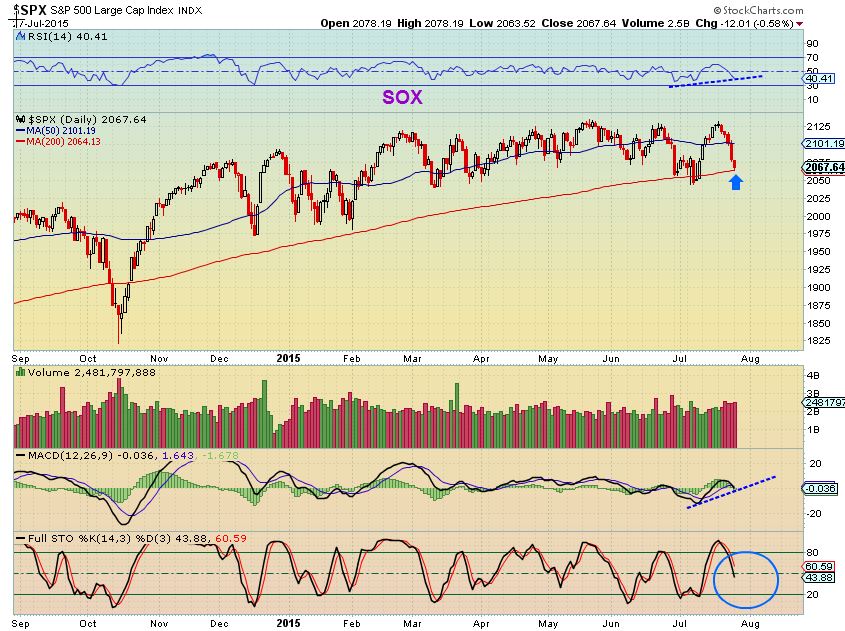
Remember my bigger picture view posted in the weekend report looked like this...
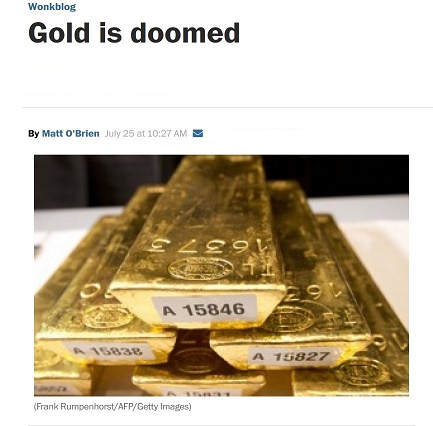
Read MoreFor the past few weeks I have daily been pointing out various 'clues' in the Precious Metals Markets indicating that a drop could lead to a nice summer rally in Gold & Miners. Is there any 'evidence' saying that such a rally is still ahead? Some have sent me articles ( like the one shown below) saying that Gold is just a pet rock, Gold is Doomed, Gold has no value, and will continue to drop until it gets to $600-$800. Well of course anything can happen, but in the weekend report we will look at all of the 'evidence' and draw our conclusions from the charts
First, a review of the various markets...
Read MoreQuick update on todays action. Things are very much playing out as was outlined in the weekend report and all this week...
Read MoreWe all have many choices to make when trading the markets day after day. They say that it is Greed and Fear that often rule the markets at critical turning points. Thats why it is important to know who you are as a trader, and what your threshold of Risk is. With that in mind, I am going to make a recommendation, but the choice is yours to make, with the information supplied.
Read More"The Train has left the station". In trading, no one likes to hear those words. We want to be ready to get on board before the train leaves the station. Today we will discuss the schedule of the GOLD TRAIN, and see when it is due to leave the station. First lets look at the markets...
In the weekend report, I mentioned a pullback was near based on Fridays charts of the SPX, NASDAQ and the Vix. SPX was at prior highs again. Nasdaq was gapping up outside of the B.Bands.
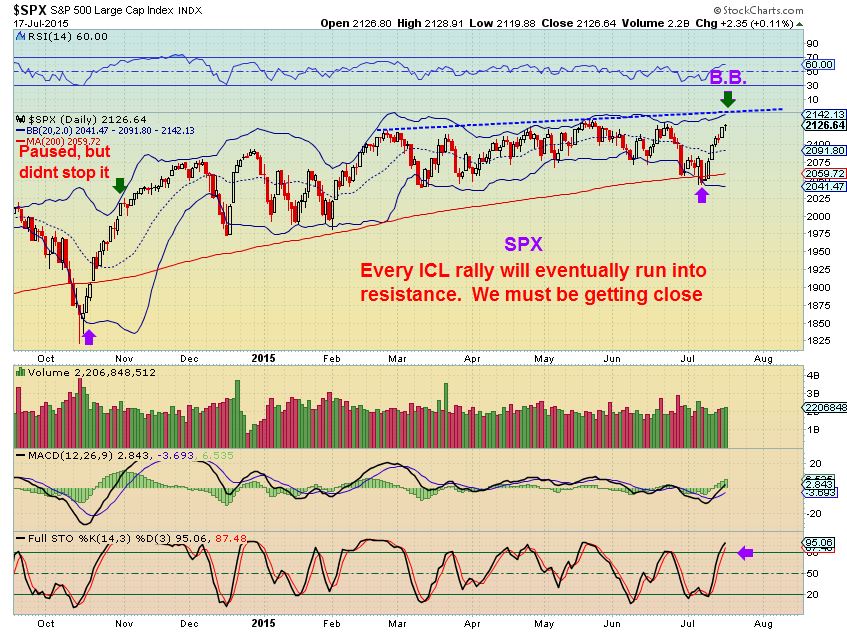
Tuesday the SPX looked like this as it dropped Tuesday & Wednesday...
Read MoreThere are times that the markets ebb and flow and then there are times when they go to extremes. By studying the charts, we can often be prepared for good trading opportunities that can come from many of these situations. Lets discuss what the charts are currently saying, especially in Precious Metals...
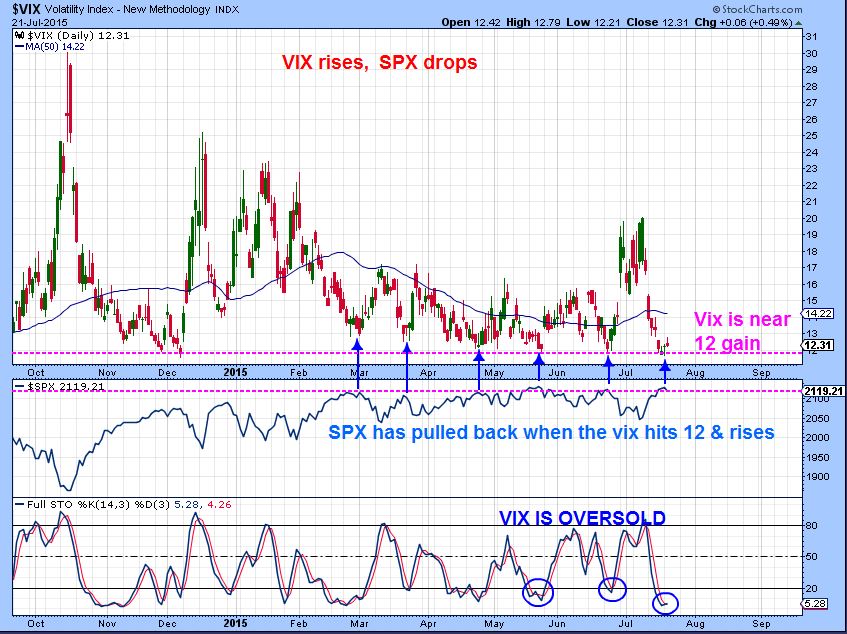
First : In the past I have pointed out what the Vix at 12 can often lead to. Notice that when the VIX hits 12 & rises (top box) , the markets pull back (middle box).
In my weekend report, I mentioned with this July 17 chart that I expected the markets to drop. If the QQQ Gapped open, I said to sell it.
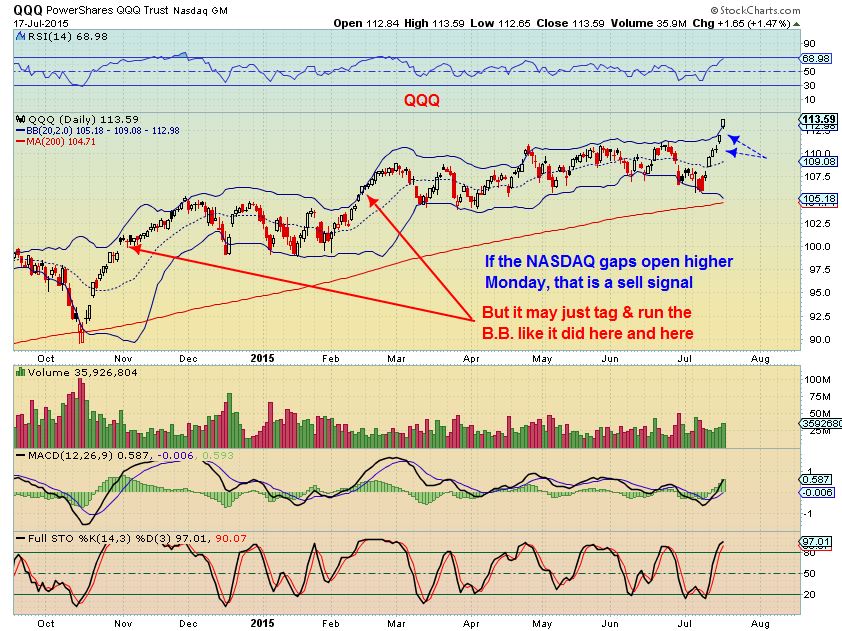
Now we see this...
Read More
Scroll to top