
Deviate From The Norm
Dec 1,2014
An Anomaly is something that deviates from the norm or the standard. When you see one, its rather hard to know what to make of it. Even though we have to “Expect the unexpected” in the markets, I must admit that Fridays HIGH VOLUME in Gold / Silver / Miners (And OIL / Energy stocks for that matter) took me very much by surprise. Let me say that I was Shocked when I saw that volume, let alone that it came in the form of a GOLD SMACK DOWN on a holiday. Friday was an anomaly for me. By normal standards it is usually part of a 4 day vacation type weekend when many ‘pack it in’ to travel & be with family. That Friday after Thanksgiving is usually a shortened light volume 1/2 day of trading . A NON-EVENT. When someone asks me “Are you still learning from the markets?” I give it a resounding “OH YES!” for just such occasions. lesson here, stay alert – stay frosty at all times, and if the markets are open….expect the unexpected!
The Big question is , “What happens now with Gold? Are the recent lows doomed? Did the Swiss Vote ruin everything?” Lets review a few points and discuss
FOUNDING MEMBER SALE – ON NOW!
CLICK HERE
![]()
GOLD CURRENTLY 6:30 a.m. (Click chart)

You can see that Before the Swiss vote GOLD got slammed, after the Vote, Gold continued down and then reversed higher. We broke below the shake out lows of Nov 14 (And recovered). We broke our up channel & did not recover . That means that GOLD lows arent violated (Yet) , but other things have happened to weaken the Bullish case. We need to look closer.
Its definitely a time for Caution, because one important bullish factor in GOLD has come off the table…the $1179 mark. Before that 1179 was recaptured, I posted this chart showing how bullish that would be as a “Shake out” .
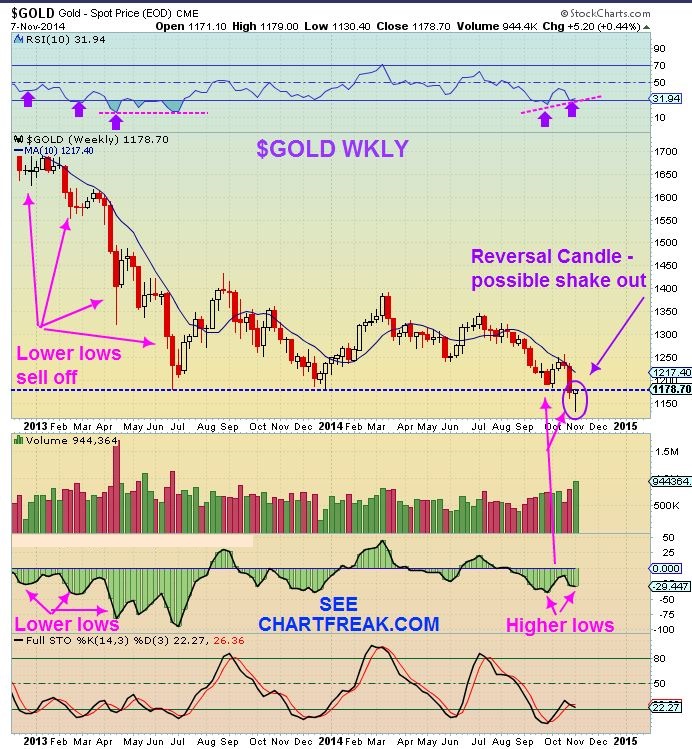
There were certain markers that I kept pointing out along the way (A check list of sorts) and now I had to cross regaining $1179 off of our bullish list.
This is as of Fridays weekly close. THIS SHOULD NOT HAVE HAPPENED. HOWEVER- I dont want to be the Bllish Biased guy here, but since Lows werent violated, There is a BULLISH CASE on the monthly, & I will mention it at the end of this report.

GDX/GDXJ representing the MINERS never recovered their recent break down ,as shown here on a wkly chart. GDX needs to re-gain $20.18

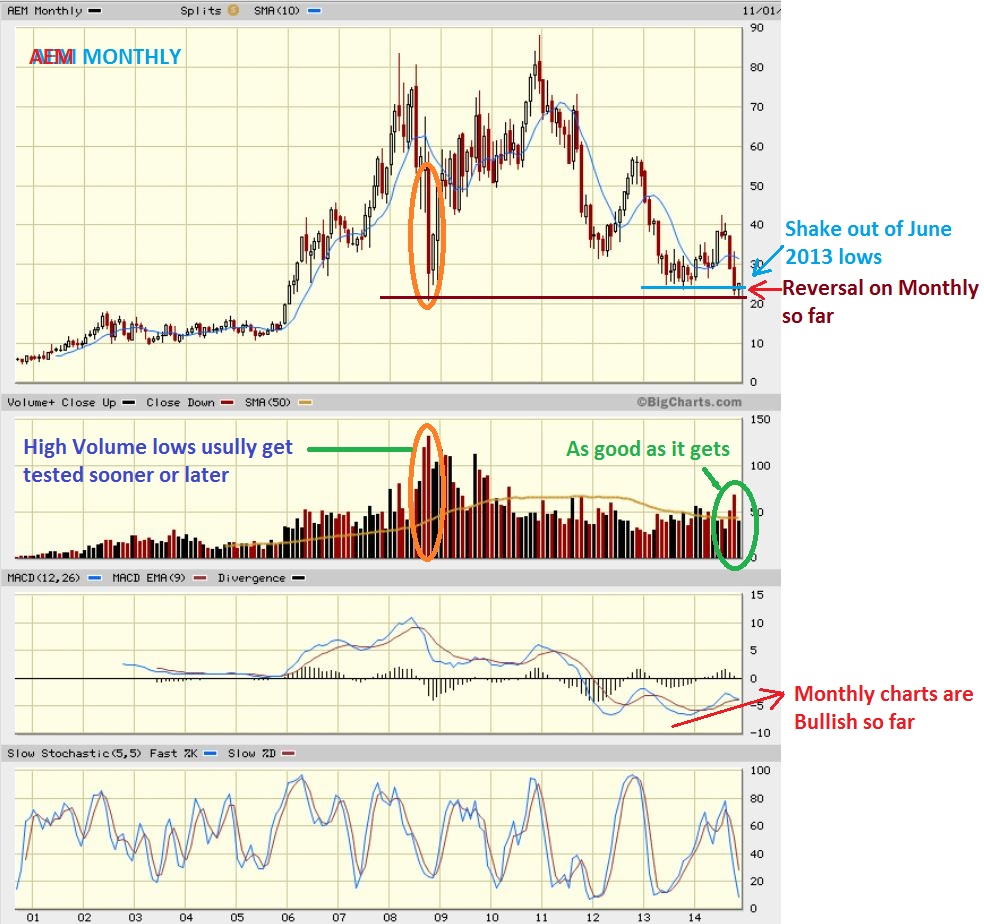
The Miners still had bullish implications. A quick review of what I saw in Nov. I pointed out that $XAU & $HUI dropped to 2008 lows and did so on 1/2 the volume . Thats bullish. I showed how some Miners like GG arent even at thier 2008 lows , and other Miners also approached with 1/2 the volume. That is bullish, these remain valid
This is AEM for ex: It remains (So Far) above that point.
I will show one more chart that I posted last week of a possible sell off, but a point to look at for support…then we need to discuss overall how I feel about what happened last week.
This chart I posted last week… steepish downside

Also remember that I am NOT expecting the dollar to rip higher like most, I have reason to believe it will dip. Friday could have been a STOP RUN on longs, breaking to new highs, only to fail. I pointed this among other charts (The one with my $USD formula calling for a break downward )

But you have to consider ALL THINGS .
This is what GDX looks like now, its not as bullish as a dip shown above would be because it happened so fast on a 1/2 day . Writing on the chart explains.

AT THIS POINT- my overall thinking has to at least shift towards the data – a tad less bullish until further confirmation. GOLD went from attempting a BULLISH push above the 50sma, to a possible reversal that has unknown targets. LOWS have NOT been broken, that is good, but Friday felt crazy Bearish on a 1/2 day holiday with Volume panic like that. Could it be the start of a deeper sell off? Yes. Could it be another Friday Shake out? Sure, (So far Gold is recovering AFTER the Swiss ‘No’ Vote). So it leads to this …
This means extra caution at this point, and That can mean several things to traders.
1. Maybe you exited any positions you had on Fridays gap down (Or got stopped out). Stay out until the picture clears up. There is time.
2. Wait for this sector to prove itself (Upside or Downside). WHIP SAW is no fun. Going short at Fridays close already looks painful.
3. 8:30 Eastern seems that GOLD move with an extra push. Watch for that and then let the dust settle.
So LOWS have not been broken, that means that I have to show you one more thing (Again with caution, but there is a time to go short and a time to be patient. I wouldnt go short as of last Friday , Since I have been mentioning that we are STILL in the “Timing” for that ICL and lows arent broken, it may not be time to short here either. Here is why).
Prior lows always tried very hard to shake out longs. Lets look at 2008 BOTTOM and the 2013 BOTTOM.
They started meaningful rallies, where they straight up?
GDX 2008 lows- almost tagged the lows 2 times. Going short there was wrong.

GDX 2013 lows. Notice that the DAY 3 surge , high volume candle , was tested weeks later.

GDX NOW ( That high volume surge candle tested too) Does anyone remember when I posted this chart, saying on NOV 20 that that candle would likely get tested Friday ?
Did it come a week later?

This is now

So in conclusion : (I want to release this well before the open)
I dont want to be BIASED and remain Uber Bullish here, but that “Might” have been a HUGE shake out. MANY went short Friday-
1. THE GOLD / MINER LOWS were not broken, HOWEVER, I admit that Some things that took place that were not expected by me.
2. High Volume panic on a 1/2 day holiday was unexpected- we must stay Frosty and hopefully unemotional.
3. We didnt SURGE over the 50sma , to be able to check one more bullish thing off of our list of expectations, short term bearish & needs more time.
4. A long daily cycle of 30 days could have plenty of downside. staying cautious. A break of lows is bad.
5. GOLD gave up the $1179 area…the SHAKE OUT for THOSE key lows became invalid for the month of November ( See next line)
6. Recovering $1179 in Dec (AND HOLDING THERE) makes last Friday a final shake out on a monthly basis. Out in Nov, Recover in Dec. ( WOW!)
Is THAT in itself another Friday shake out? Possibly , As I write GOLD just recovered the 1179 area. UN REAL!! IT is gaining back alot of what it gave up last Friday. Will it hold today or is it an oversold bounce ?? We really need time to let this play out a bit more to know for sure. The SWISS VOTE knee jerk reaction is behind us…whew! (Above the 50sma is a nice longer term clue) . Stops should be honored in case things are breaking down here. One could even sell this bounce to regain composure and get back in (Long or short) when true direction is identified. These are exciting times…like a heart attack : )
THIS SITE has a count down to midnight when we launch the new website. It has been priced with the hopes that all followers who have enjoyed another perspective will be able to continue here at chartfreak. We believe that the yearly price (Especially when divided by 12 months ) is reasonable and affordable. As a side note: The site is currently being worked on behind the scenes so I may / may not be able to post updates intraday just for today . Follow me on TWITTER and I will try to post if I see anything special. Fasten your seat belts and enjoy the ride?? Best wishes
~ALEX


Good morning Alex and many Thanks for you report.
You say follow me on TWITTER, I don’t; have it, who or where can I follow you?
Have a good trading day.
Twitter and stock twits I often post.
This I don’t understand, what’s on Twitter is that also on your web Alex?
Is it difficult for you what’s on Twitter put is also to my email box?
Sorry to ask you again.
There is nothing to report to you in your email. Its too difficult for me to email each follower individually . I use twitter and mentioned that IN CASE my website is unavailable and I see something.
We look bullish, shake out . See comments and chart above. Thx
OK…. I will you follow on your website.
Just sign-up to a Twitter account.
It is easy to do … will take a few minutes.
If you sign up for Twitter, you can also sign up for Tweetymail from http://www.tweetymail.com. Tweetymail will send tweets from people you indicate to your email address. In other words, you can get Alex’s tweets sent to your email address. It’s a little convoluted, but it works.
Me neither, thinking you’ll post here simultaneously? What is twitter anyway?
Looks to me like miners, didn’t follow POG all the way down on friday, and, ‘surprise’ they’re not ‘comfy’ following POG up.
Thinking big boys are buying both events, If you’d rather not own physical, own the production. Costs/oz. are crashing with these oil prices.
lastly alex, haven’t found button to sign up for new site. May not be the only participant here…
Got ur email tx.
I’ll address that last part
Thanks for the post…I’d count my chickens based on today’s action…but somebody took them all on Friday! What are you looking for as a close to take us back to a bullish as opposed to dead cat bounce? Just $1179. $1200?
I just tweeted this chart ..it does look like a massive shake out & Recovery . It does look very bullish. That would be bullish with the Swiss Vote Done… I know MANY went short into the close Friday and EVERY GOLD REPORT I read this weekend was Bearish & again calling for $600 to $1000). Short cover rally could pick up. And CRAZILY – it would be a monthly shake out in Nov, recovered in DEC …but you have to wait for end of DEC to know for sure.
Short term – To be “SAFE” one could wait and see if Miners or Metals can Gain 50sma. I do tend to think this is still playing out as mentioned thru Nov, with scary shake outs along the way.
Hi Alex,
You rightly emphasise to be cautious after big reversals on high volume, especially as Friday was a short
(holi) day. Having positions in GDX and GDXJ I was watching during the day for
volume to support the big price falls and comforted myself that the volume was
not there and the price would reverse today. I took snapshots from Stockcharts
– on GDX at 1146, vol was 26.7m at $18.69, on GDXJ at 1213 vol was
7.3m at $25.66.
I was amazed when, after the Close Stockcharts gave volume as 110m for GDX and 27.3m for GDXJ with price
little changed. I live in UK and maybe trade reporting rules are different in
the US but I cannot understand how there could be so much volume into the close
and with so little effect on price. Can you please comment?
If you look at intraday charts (Say 5 minute or 10 minute) you will see that they always add a huge chunk of volume at the end of the day now (For the past year or so). Sometimes stockcharts shows GDX 30 million at 3:50 p.m. eastern, and at the close its more like 45 million!
Some have guessed that it represents “Dark pool” trading and the total volume just appears all at once at end of day. Other think it is end of the day orders all piled in at once.
I will show you the chart I watched as of FRIDAYS close. Volume was increasing minute by minute in the sell off, then 10 million in 5 minutes showed up as a reversal at the close.
So I dont use stockcharts alone, I watch 5 minute charts real time too (Use your brokers charts, they should be real time)
Does Gold looks like it might have had a 78% wave2 pullback to the 1130 lows (& now starting a wave3)?
It is possible. , a wave 1 up, wave 2 down and wave 3 possibly now and it would be a shake out too, as shown in my GOLD chart below to DESHY.
…and it looks such a strong impulse too
When I look at other DEEP meaningful lows, there is often some bouncing around at the lows during the first month or so (1st Daily Cycle). Its so difficult to ride emotionally, but technically nothing breaks down. SO I still wonder if my GDX chart will see a tag of the trend line that we broke above? it doesnt have to , but still…It hasnt been tagged yet. Chart below. The 2nd Daily Cycle takes off fast & leaves many behind.
Second chart is bottom for 2008. Lingers at lows for a month, then upside run.
Alex- are you not concerned with the lag in miners.. Abx is flat for one.. It def ha me very concerned. Thoughts? Ty
They gapped open….likely gap fill
Alex, is there a simple explanation why gaps usually close?
Good Morning! Thanks Alex!
Hi Liza – Crazy stuff last week, huh?. Once a bottom is established and a trend higher is underway, it gets easier . Or a breakdown , but its looking rather bullish again. (And your welcome)
SIGN UP is after the clock runs out. There will be a 3 day special for a yrly sign up – that starts after mid night
ALEX…. would you look at the chart of CRK? (Crocodile Gold)
ALEX…. did you send this morning a new report?
Thanks for let me know,