You are here: Home1 / Exclusive Strategies
From the time of the Fed Meeting to the Jobs report Friday, we have had a lot of action in the markets. Action in the markets is what draws our charts, and we have an interesting mixture of charts to examine this weekend, so lets get to the 36 charts that I have prepared 🙂
Lets start with the $USD WKLY. Nov 4 this looked too legit to quit, but we had to wait for Friday to see if out Dollar break out was real.
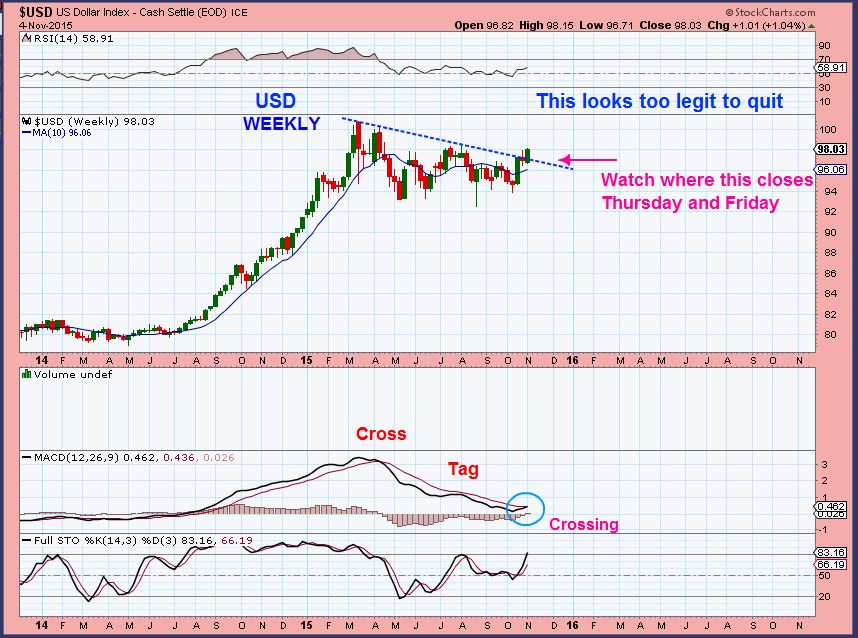
$USD - legitimate break out. This could have major implications.
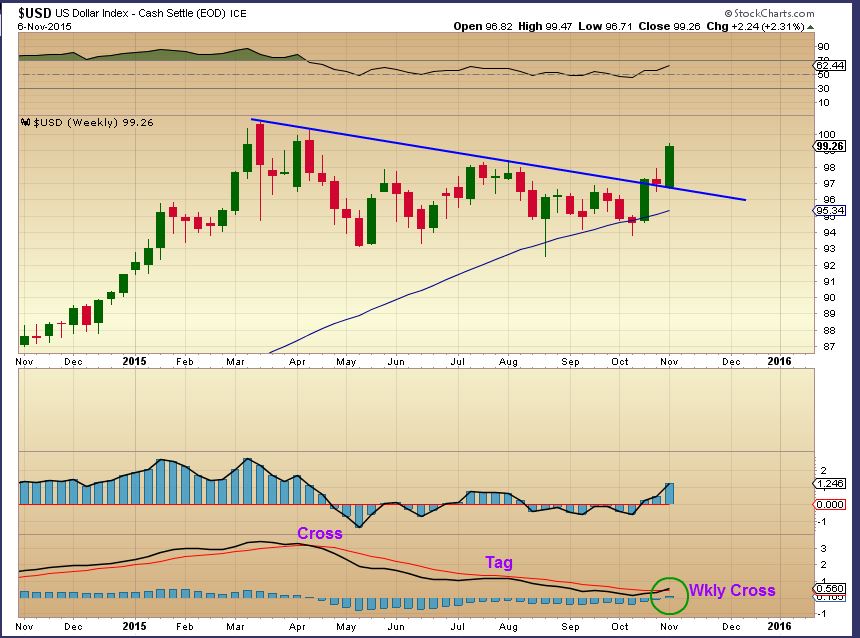
Lets look at the Dollar on a daily basis...
Read MoreJobs Report, Flying Dollar, Diving Gold. Please dont forget Energy 🙂
Read MoreCount the Green days vs the Red days in Gold for the past 2 weeks, and you could say that it has been in free fall for a bit. We'll discuss that after a market review.
The SPX has been moving rapidly higher and recovering from the August - September sell off quickly. Since the former highs could offer resistance, we may see a drop with the jobs report .
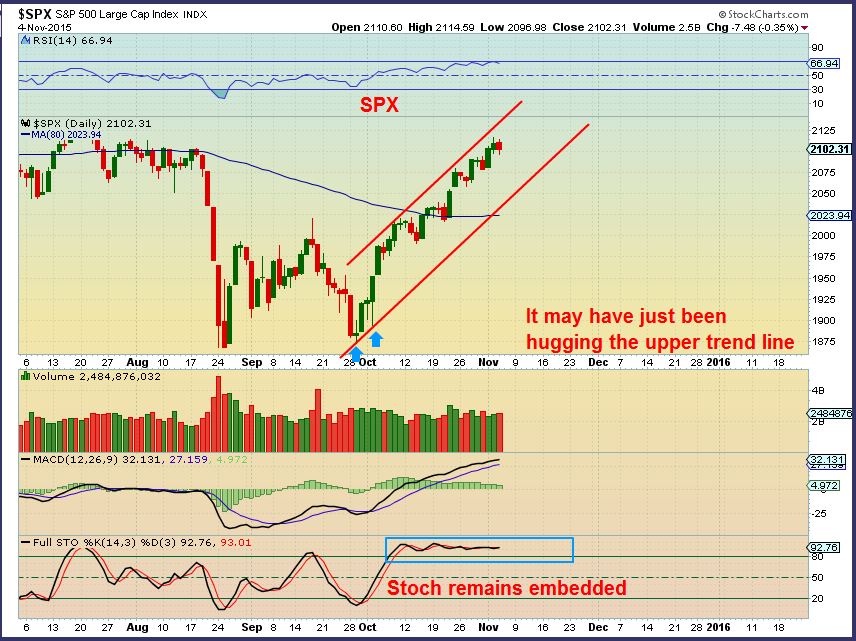
Now I want to show you a chart of the SPX that really looks like a drop could come soon.
Read More
Scroll to top