You are here: Home1 / Exclusive Strategies
As I begin writing this report, it looks like OIL may be ready to bounce here. I wanted to take this time to examine the evidence and discuss my recent expectations in the Oil markets.
WTIC - Nov 11 this was our picture of OIL. Please note the $42.58 . Oil was not acting the way that it should early in a 2nd daily cycle and the high volume selling was noteworthy.
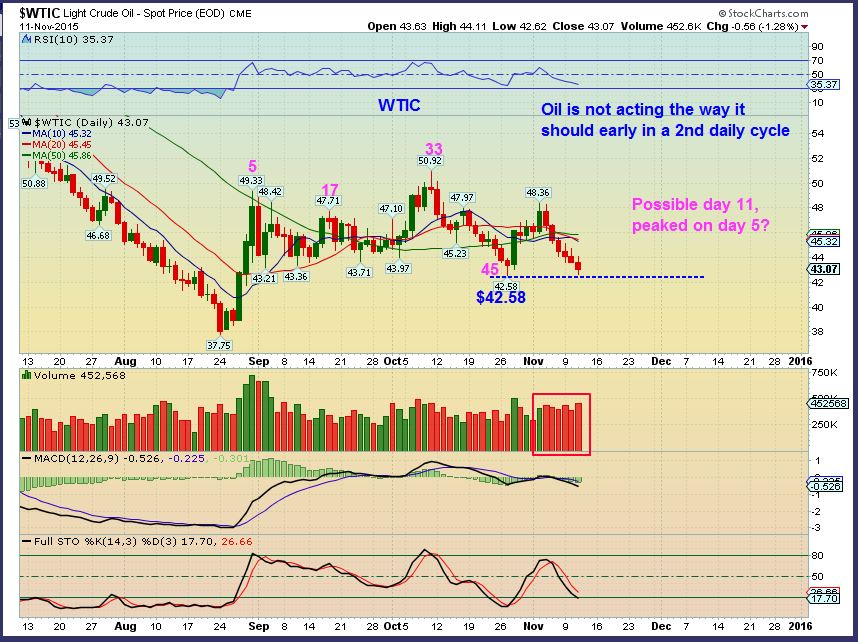
Now lets take a closer look on Nov 12 and discuss the implications.
Read MoreI wanted to discuss OIL a little later in this report this morning, since it is acting a little weaker than expected. We'll start with our market review.
We expected a small pull back in the markets, and this chart showed where the Fib #'s would be. There was also a channel included.
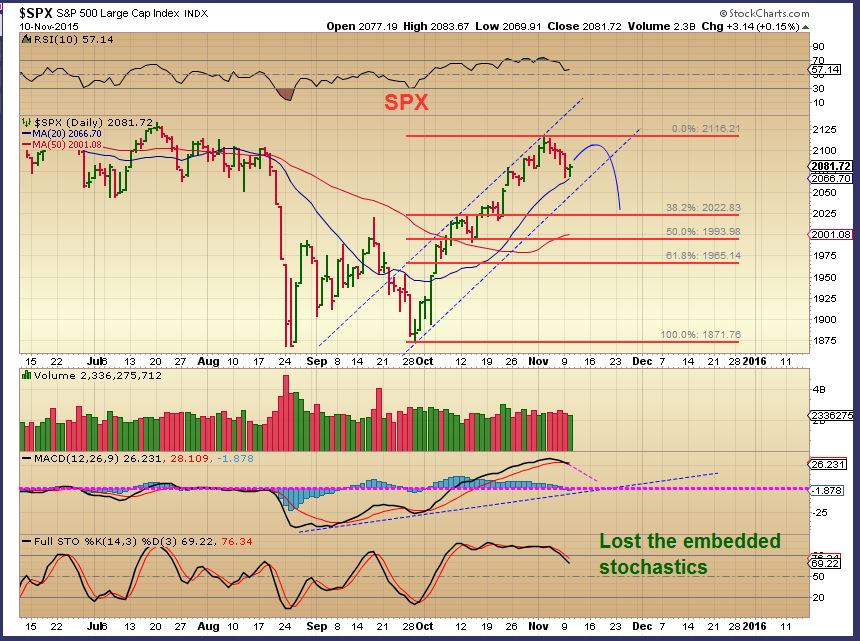
We have reached that lower channel line and the 20sma. That could act as support, but the above chart also has the 38% Fib # at 2022 and we also see the 50sma and the purple break out in that area. That means the selling may not be over yet.
 Read More
There was no significant change in most of what was covered in yesterdays report. Draghi is scheduled to speak in London this morning, could his speech change things? It has in the past. For now, lets just do a review of what we've been looking for.
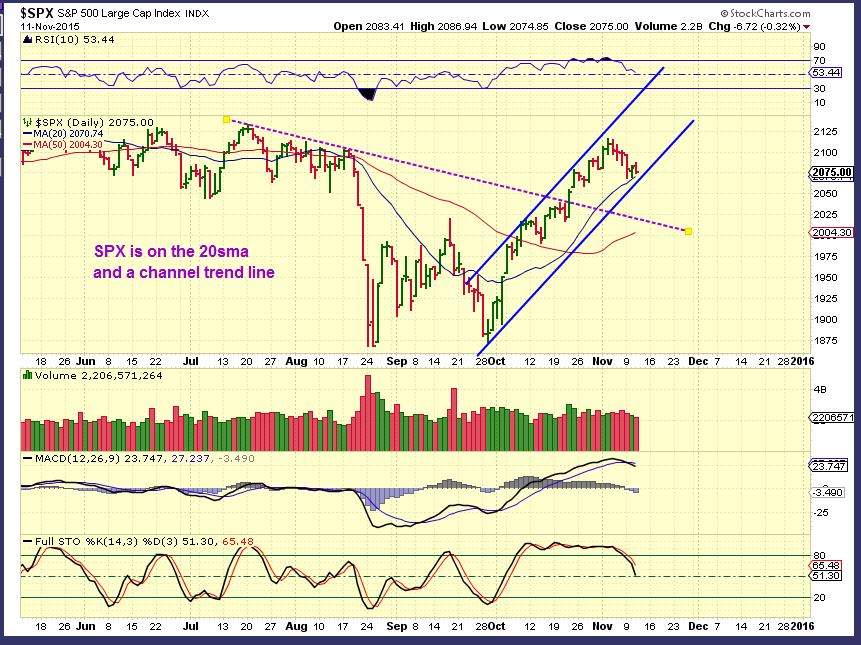
With a pullback due in the SPX, I drew this possibility yesterday. We could Tag the 50sma and lower trend line.
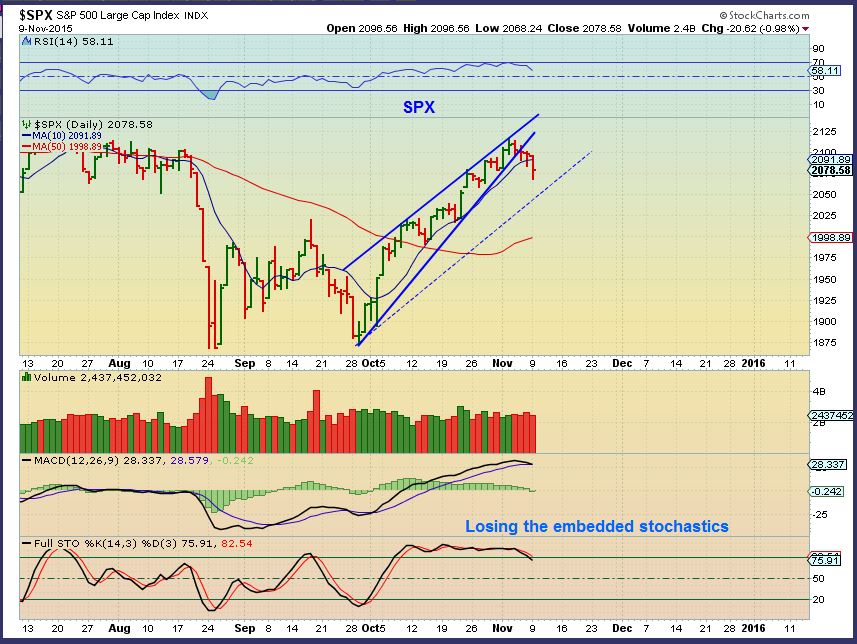
A reversal yesterday doesn't change the idea that we will still pull back, so I've added the fib #'s. We could bounce & still drop to the 50sma
Read More
Scroll to top