You are here: Home1 / Premium
Lets get right to the weekend review.
.
SPX 1 week ago – It was struggling to move higher. Not a ‘long’ or ‘short’ play going forward, just sideways chop again.
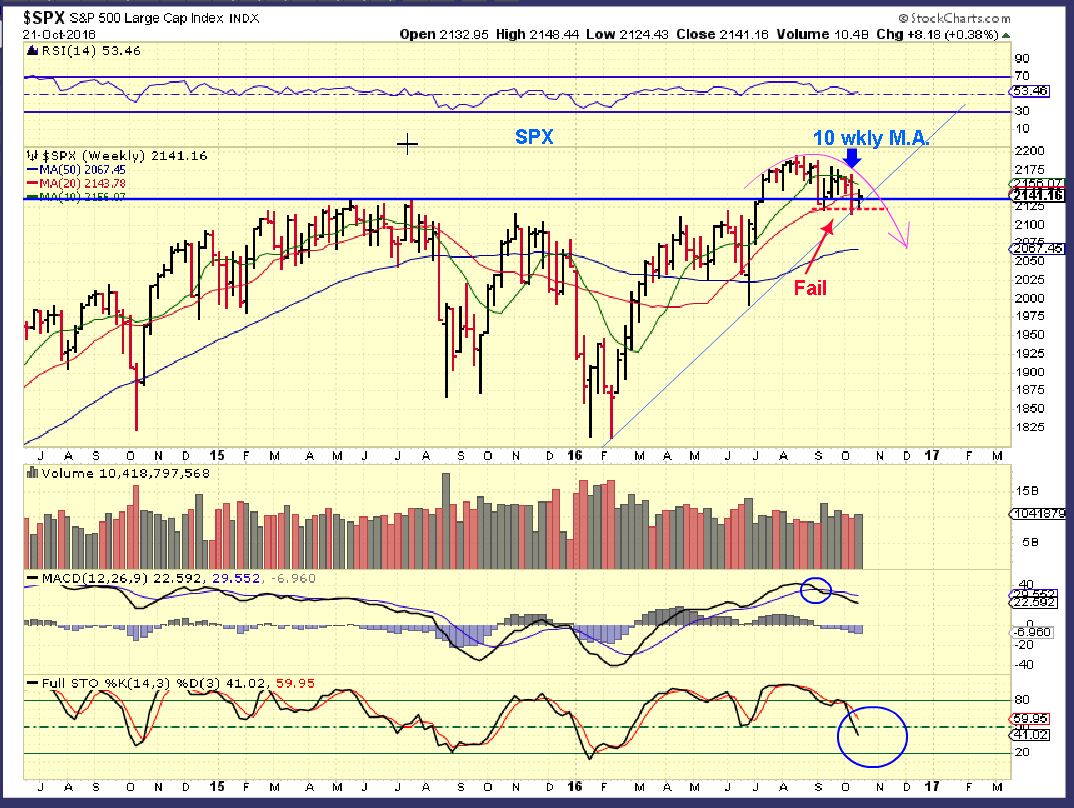
SPX WKLY – No change, still looks weak.
Read more
There was a time when I only released reports Tuesday , Wednesday, Thursday and the huge weekend report would cover Monday. I felt that the Thursday report would cover both Thursday and Friday and that the weekend report caught us up for the Monday trading. With the Bull markets of Precious Metals, Oil, and Commodities coming alive this year, I have released at least a small Friday report almost every Friday in 2016. Why stop now? 
.
So this is just another short ( short? 13 charts ) report to point out that Thursdays dip or slam down in Gold , Silver, and Miners actually may hint at some underlying strength, and that may be enough to encourage anyone that is a little too light to buy these dips. Lets take a look…
Read more
Things have been falling into place step by step this week. In this report, I just want to point out a few things that I am watching when it comes to our positions in Miners after a brief review of the Dollar and Oil.
.
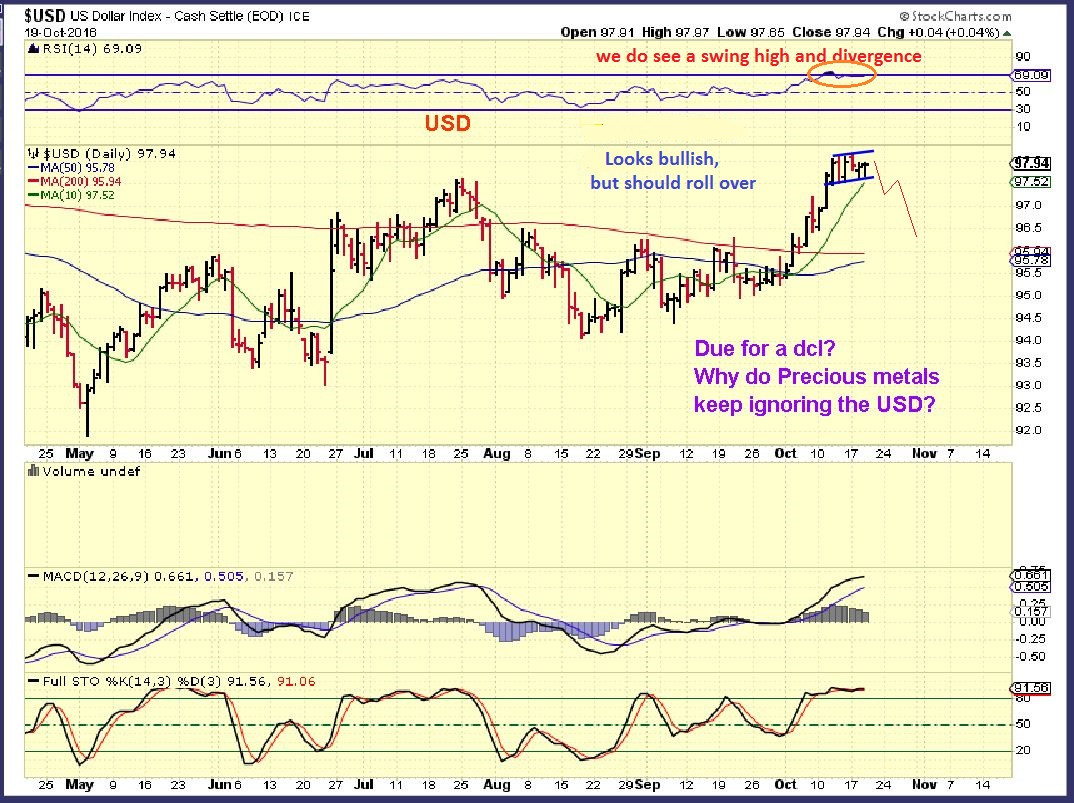
USD – This looks bullish really, but it is very stretched according to cycle timing. It should roll over into a dcl soon. The Precious Metals are ignoring the USD when it rises now, possibly a sign that the Dollar is ready to dip down.
Read more
I wanted to title this report “We got it!”, that was by request actually, but you will see as we go through the charts that I cannot say that quite yet. Dont get me wrong, I believe that you will like the ingredients of this report, so let’s get right to it…
.
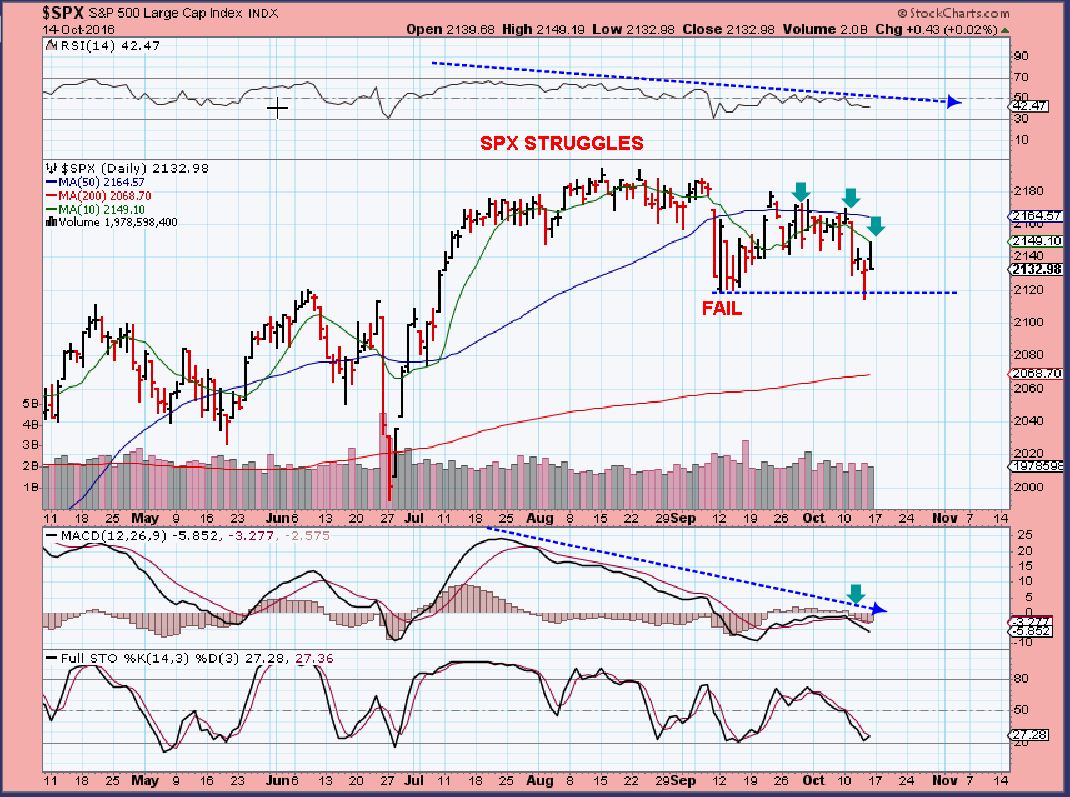
SPX – The SPX failed when it dropped below the Sept 12th lows, and has struggled under the 50sma and even the 10sma. It needs to prove itself, but it is struggling. The NASDAQ stocks GOOG, NFLX, AAPL, and others do look bullish, so I am just watching how this plays out over time. I am much more focused on the Gains that can be made in Miners.
Read more
When I am preparing food on the grill, I’m checking the temperature, watching for grill marks, looking for a change in color, and several other signs to know when the food is ready. In a similar manner, we have been watching various aspects of the precious metals markets and also looking for a variety of signs indicating when they may be ready for consumption. 🙂
.
How do things look? Lets take a look…
.
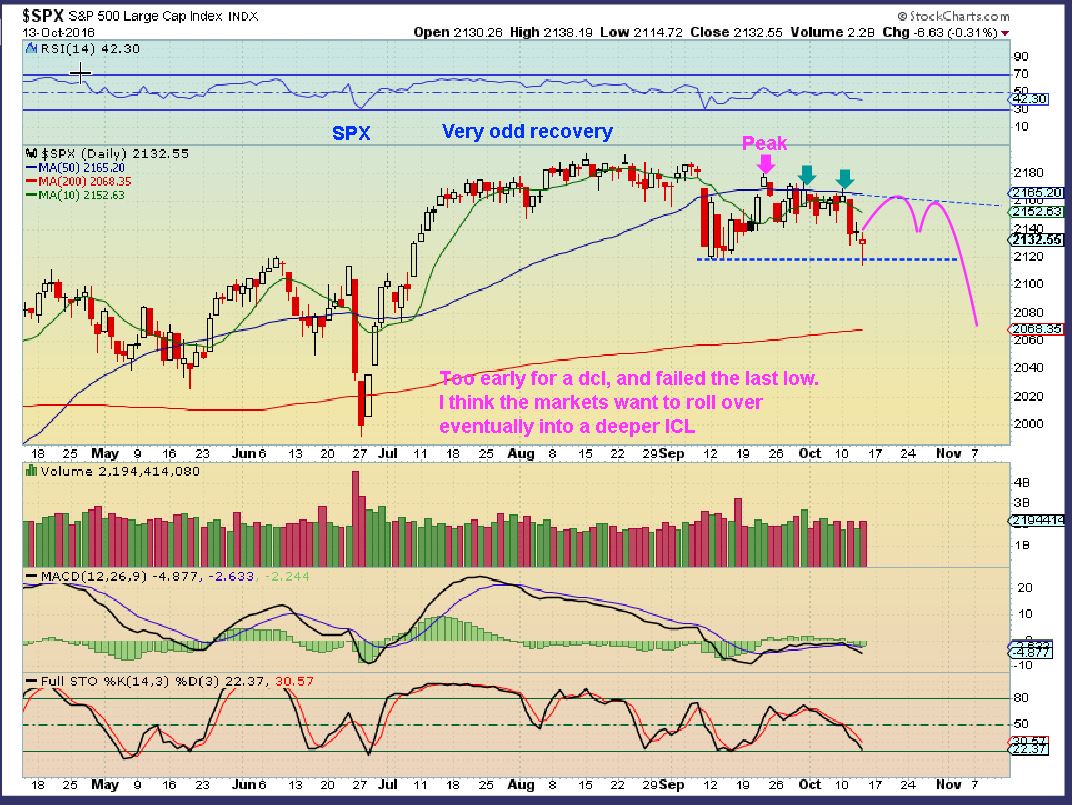
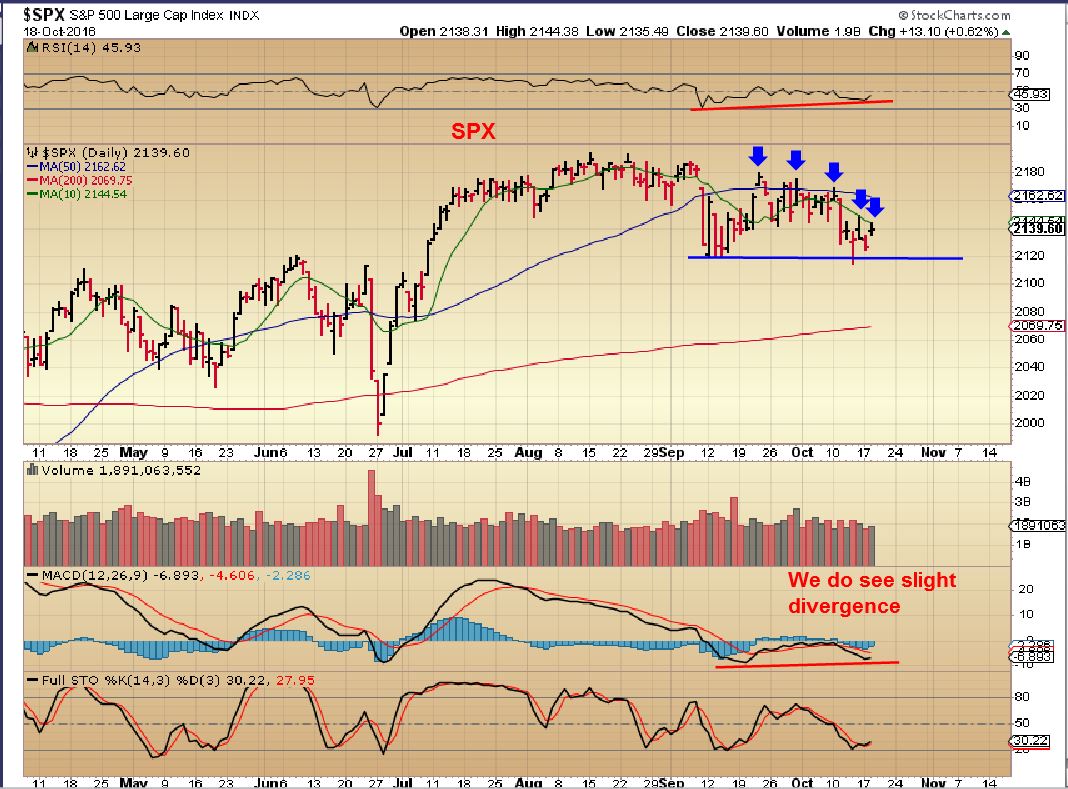
SPX -I believe that the general markets are going to roll over soon.
Read more
The SPX ( Left Translated) dropped to break the prior lows and then put in a shake out reversal. It has struggled at the 50sma, and now that it faled, I expect it to roll over, possibly after tagging that 50sma again.
Read more
When hunting for good set ups, just keep in mind that every day that passes brings us closer to the target.
Read more
The Fed Minutes are scheduled to be released today. At times like this, we sometimes get a glimpse of what was behind the recent decision on interest rates. Is inflation starting to creep in? Just how divided or united were the Fed members when it came to timing for rate hikes, etc. Lets take a look at the charts and cycles and see if we can glean some idea of what could happen after the Fed Minutes are released.
.
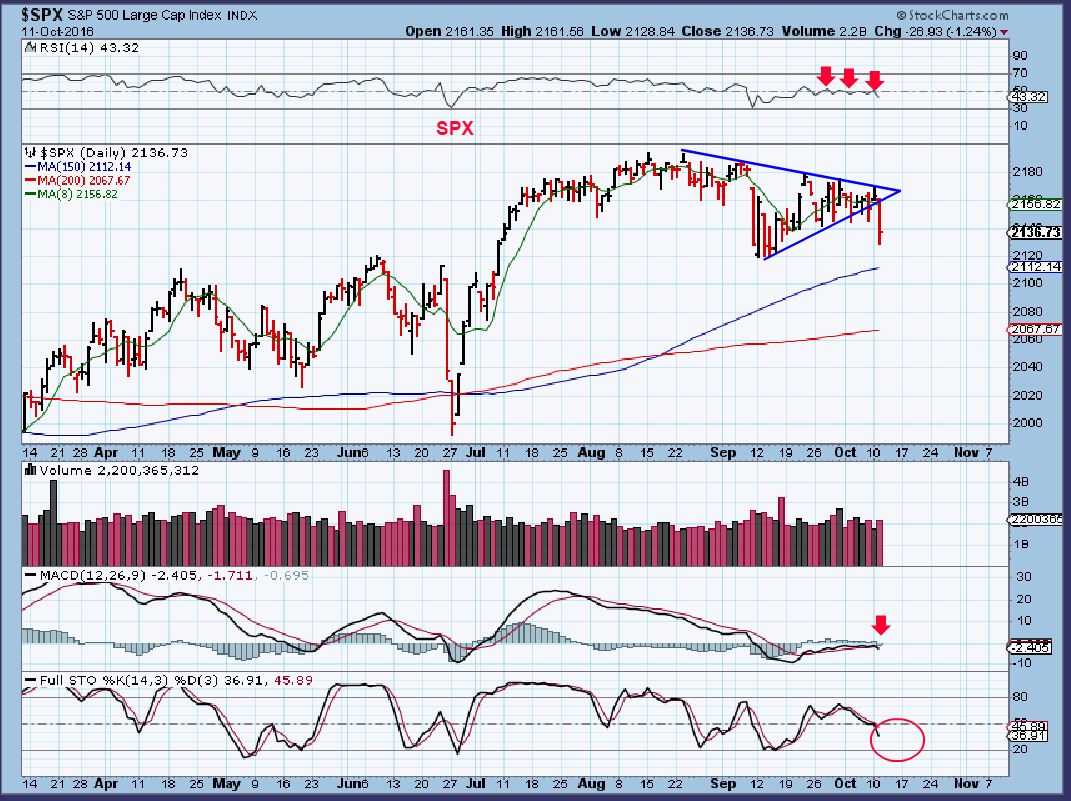
SPX – HMMM, This daily cycle peaked very early (day 8), and today is day 21. There are false break downs and shake outs in life, but this should be viewed as a warning sign. Why? I see a left translated daily cycle breaking down with maybe 10 more days to go. I see more room to drop on the stochastics, and a weak RSI. The Fed minutes could sink this ship or perform a miracle ‘shake out’ type move and a recovery, but this is a bearish set up the way I see it at this point.
Read more
If you have been investing and trading for years, no doubt there are times that you find it is best to wait for that ‘Fat Pitch’, but not always so easy. Well the good news is, I can see that a real low risk buying opportunity is fast approaching, so lets discuss that again in todays report after a quick review of the markets…
Read more
Scroll to top