You are here: Home1 / Premium
https://chartfreak.com/wp-content/uploads/sites/18/2020/01/TRADING.jpg
636
694
Alex - Chart Freak
https://www.chartfreak.com/wp-content/uploads/sites/18/2019/11/Chart-Freak-site-logo.png
Alex - Chart Freak2020-01-15 11:59:002020-01-15 11:59:00Wednesday January 15
https://chartfreak.com/wp-content/uploads/sites/18/2020/01/support.jpg
575
743
Alex - Chart Freak
https://www.chartfreak.com/wp-content/uploads/sites/18/2019/11/Chart-Freak-site-logo.png
Alex - Chart Freak2020-01-14 12:15:492020-01-14 12:15:49Tuesday January 14th _ Things That We Are Watching
https://chartfreak.com/wp-content/uploads/sites/18/2020/01/JAN-1.jpg
830
1092
Alex - Chart Freak
https://www.chartfreak.com/wp-content/uploads/sites/18/2019/11/Chart-Freak-site-logo.png
Alex - Chart Freak2020-01-11 19:45:092020-01-11 19:45:09The January 11th Weekend Update
https://chartfreak.com/wp-content/uploads/sites/18/2018/05/FRIDAY.jpg
559
853
Alex - Chart Freak
https://www.chartfreak.com/wp-content/uploads/sites/18/2019/11/Chart-Freak-site-logo.png
Alex - Chart Freak2020-01-10 12:37:232020-01-10 12:37:23Friday January 10th.
Was a Pullback in the Precious Metals Sector possible? Yes, I even posted this chart as an example of what we could see…
FROM MONDAYS S REPORT:
GDX – We also could build a handle to the 50 sma if the pause or dip continues. Churning sideways is normal action, you can see it in June/July and the end of July.
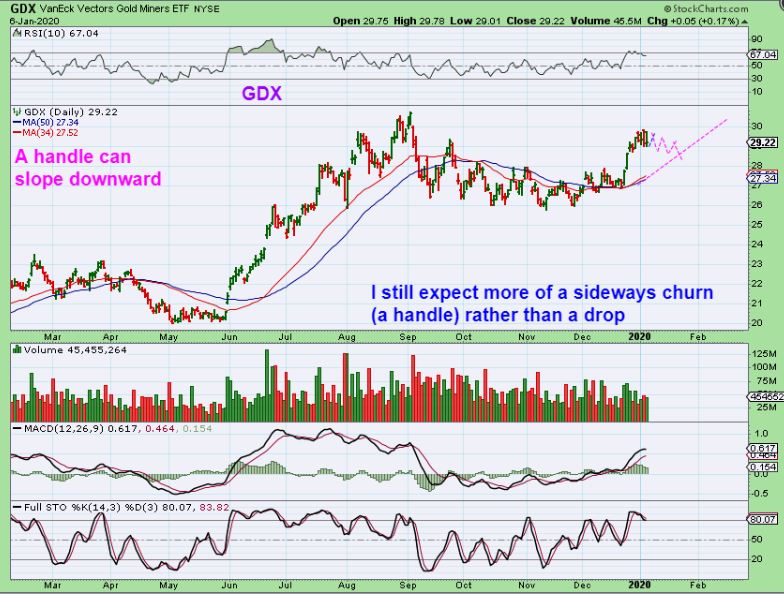
.
I wouldn’t exactly call Wednesdays action just a normal churning type of a pull back, so let’s discuss what we saw and also discuss what may come of it. First we’ll cover the General Markets and Oil…
Read more
This week we saw some acceleration in some areas and some choppiness in other areas of the markets, so I think that this Big Picture Weekend Report can help to clarify things as we come out of a somewhat choppy week. Lets take a look…
.
SPX DAILY – I am seeing what looks to be some topping action on the daily charts, so we may continue to see some choppiness and then a dip into a dcl. The 13 sma stop would still have you long though. Since this also looks to be a R.T. Daily cycle, we should see a higher low, maybe just a chop down to back test the 50sma.
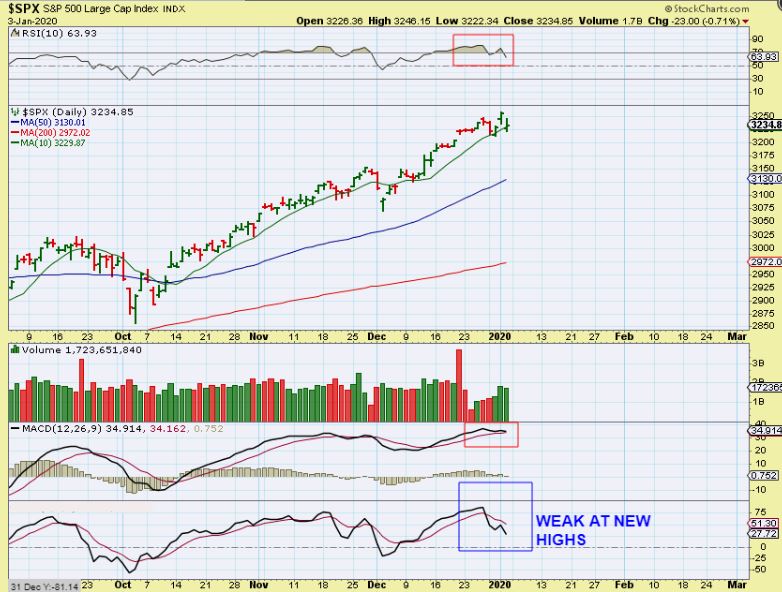
Read more
Scroll to top