You are here: Home1 / Premium
https://chartfreak.com/wp-content/uploads/sites/18/2020/02/FRI.jpg
621
705
Alex - Chart Freak
https://www.chartfreak.com/wp-content/uploads/sites/18/2019/11/Chart-Freak-site-logo.png
Alex - Chart Freak2020-02-07 12:17:422020-02-07 12:27:11Friday February 7th
https://chartfreak.com/wp-content/uploads/sites/18/2020/02/tug.jpg
627
743
Alex - Chart Freak
https://www.chartfreak.com/wp-content/uploads/sites/18/2019/11/Chart-Freak-site-logo.png
Alex - Chart Freak2020-02-06 06:02:182020-02-06 06:02:18Thursday February 6th
https://chartfreak.com/wp-content/uploads/sites/18/2017/09/SLOW.jpg
503
963
Alex - Chart Freak
https://www.chartfreak.com/wp-content/uploads/sites/18/2019/11/Chart-Freak-site-logo.png
Alex - Chart Freak2020-02-05 12:19:332020-02-05 12:30:48Wednesday February 5th
https://chartfreak.com/wp-content/uploads/sites/18/2020/02/2020.jpg
563
731
Alex - Chart Freak
https://www.chartfreak.com/wp-content/uploads/sites/18/2019/11/Chart-Freak-site-logo.png
Alex - Chart Freak2020-02-04 10:40:002020-02-04 10:40:00February 4th – What Next?
https://chartfreak.com/wp-content/uploads/sites/18/2020/01/TIGHTROPE.jpg
456
744
Alex - Chart Freak
https://www.chartfreak.com/wp-content/uploads/sites/18/2019/11/Chart-Freak-site-logo.png
Alex - Chart Freak2020-02-01 22:16:522020-02-01 22:18:24The Weekend Report – Walking The Tightrope
https://chartfreak.com/wp-content/uploads/sites/18/2019/04/FRIDAY.jpg
578
679
Alex - Chart Freak
https://www.chartfreak.com/wp-content/uploads/sites/18/2019/11/Chart-Freak-site-logo.png
Alex - Chart Freak2020-01-31 12:01:322020-01-31 12:01:32Jan 31st
https://chartfreak.com/wp-content/uploads/sites/18/2020/01/Rocket.jpg
551
747
Alex - Chart Freak
https://www.chartfreak.com/wp-content/uploads/sites/18/2019/11/Chart-Freak-site-logo.png
Alex - Chart Freak2020-01-30 03:13:462020-01-30 04:05:55Thursday January 30th
https://chartfreak.com/wp-content/uploads/sites/18/2017/12/2FOMC.jpg
529
779
Alex - Chart Freak
https://www.chartfreak.com/wp-content/uploads/sites/18/2019/11/Chart-Freak-site-logo.png
Alex - Chart Freak2020-01-29 12:38:372020-01-29 12:43:03Wednesday January 29th F.O.M.C.
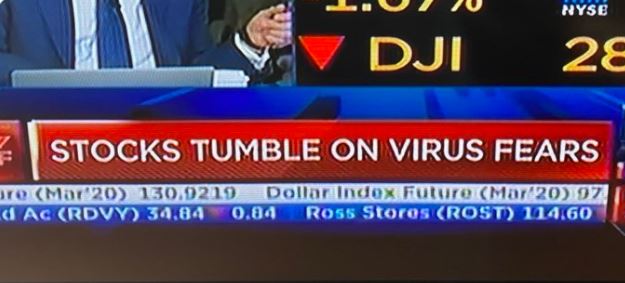
JUST A QUICK REALITY CHECK TO START WITH – “I saw on the news that the Virus caused the markets to sell off?”
.
Well, I have been showing the cycle count in the markets for a while as one that is entering a top area. This was last Wednesday JAN 22 on day 33 and I wanted to pointed out that one daily cycle peaked on day 32. Then the next one peaked on day 39, so we really could top & drop at any time, so we expected a pull back and anything could trigger it really.
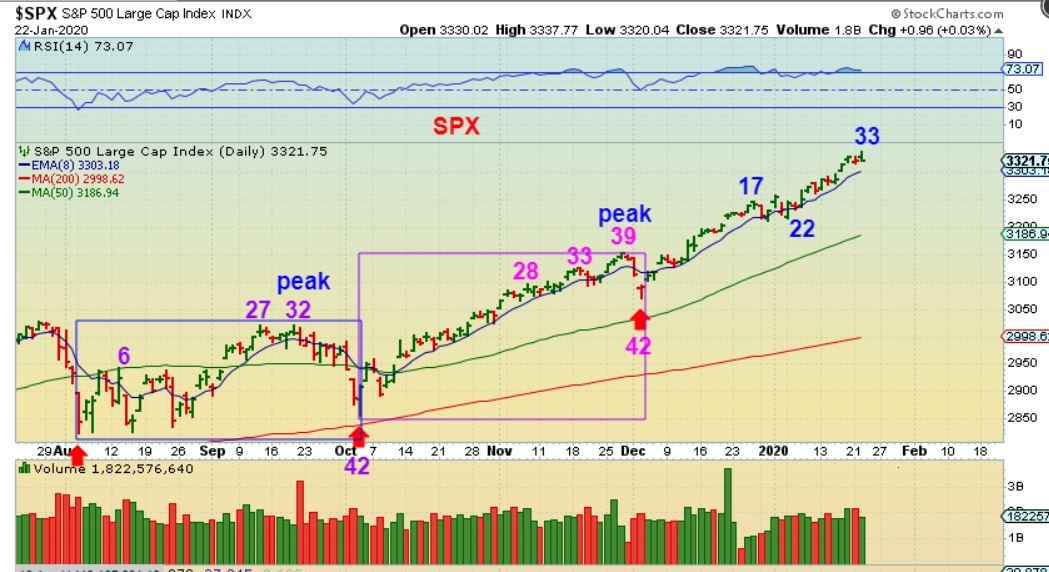
THIS IS THE REASON? When The U.S. killed an top Iranian leader & Iran fired back, all of the news was that this could escalate ferociously, but the markets didn’t crash then? Now is a virus really causing this drop? Not really. The markets were overbought & peaking on day 33, 34, & 35 and then we saw that bearish engulfing Friday. They were due to fall because of being this late in the cycle count. Certain sources will always try to give a reason as to why a market is pulling back or rising. In reality, it is often just the ebb & flow of the markets…
Read more
Scroll to top