Author Archive for: Alex - Chart Freak
About Alex - Chart Freak
I’ve been a full time trader for well over a decade and began trading in the late 1990s while working in management and sales at a well-known aerospace company. As my style evolved, so did my success, and it allowed me to leave corporate America to pursue my passion and trade full time.
Entries by Alex - Chart Freak
4-25-2018 – Hanging On
April 25, 2018 /90 Comments/in Premium /by Alex - Chart FreakIt is earnings season this week and suddenly we are seeing the Markets sell down, even when reports do not seem that bad. Let's do a quick review...
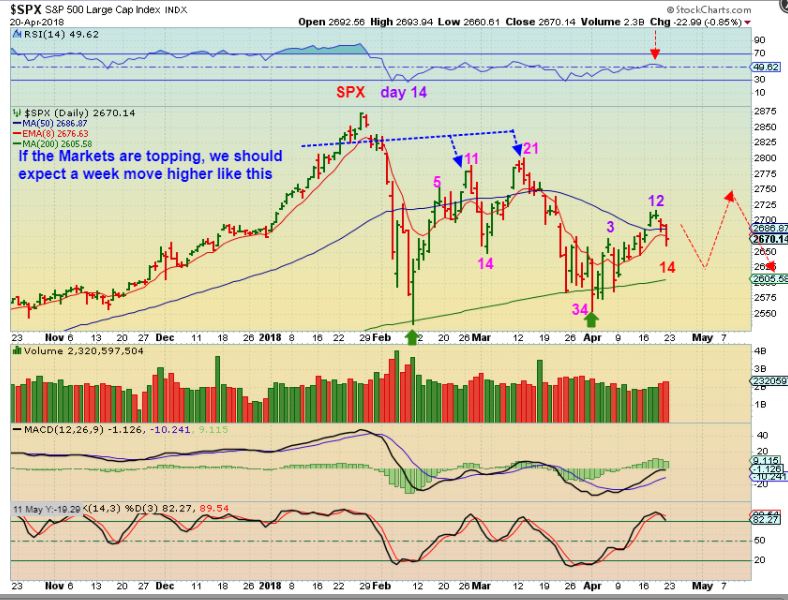
SPX APRIL 20- Last week I looked at the move out of the Feb lows and noticed a pretty drastic sell off on day 13 & 14 below the 50sma, so I drew the SPX chart with a similar drop into day 14, a bounce, and then possibly another drop.
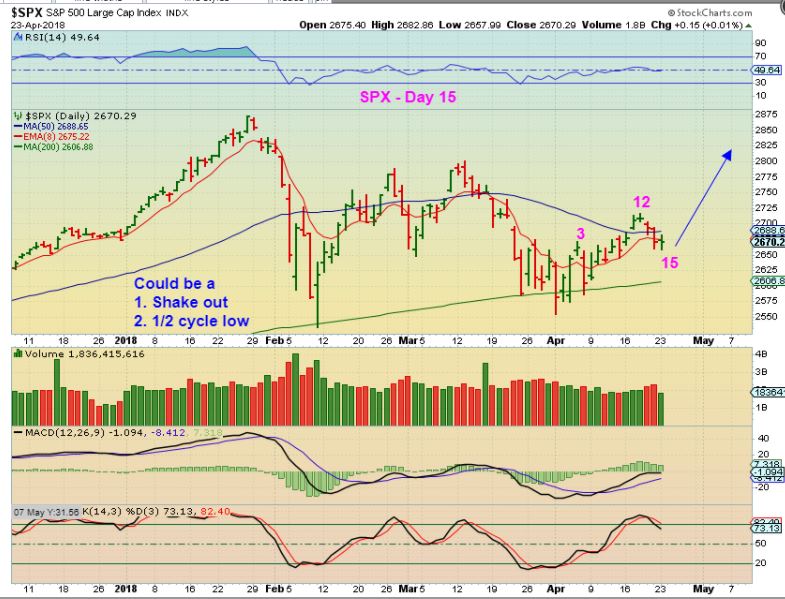
SPX APRIL 23 - Monday I thought that by day 15 we would get our 1/2 cycle low, and then a bounce higher. The markets were so strong in Oct, Nov, Dec, and Jan that I would expect them to at least make a double top, eventually running to the former highs. On Tuesday...
SPX - We are REALLY seeing a struggle here to gain some traction. 2553.80 IS CRITICAL in my opinion. If those lows break, this would appear to be a failed daily cycle.
And in addition to that, I posted this chart in the comments section yesterday.
April 21st – Not A Whole Lot Of Change Here
April 24, 2018 /130 Comments/in Premium /by Alex - Chart FreakWith Mondays trading, we didn't see a lot of change, and our expectations remain the same, so let's do a Tuesday Morning review...
SPX - This should be a 1/2 cycle dip, and we need to see price break higher soon. I expect that it will back toward the recent highs, and if it does, this current action could look like a shake out at the 50sma. So far, the move out of the lows has been a sideways consolidation.
4-21 Take A Look
April 22, 2018 /65 Comments/in Premium /by Alex - Chart Freak
SPX DAILY - This is where the SPX stands with its cycle count. We experienced a bit of weakness at the end of last week, and you all know my Big Picture outlook. This could be playing out the way it was presented in the weekend report 3 weeks and also 2 weeks ago. On the chart I wrote week, and meant 'weak'.
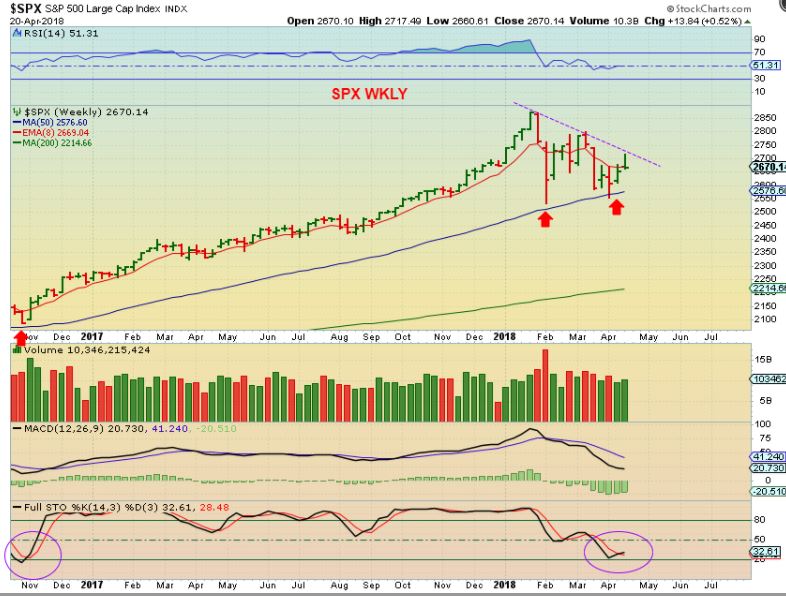
SPX WEEKLY - Nothing is wrong with the weekly chart at this point, but it was rejected temporarily at the down trend line, and I want to discuss the big picture further in this report.
Friday April 20th
April 20, 2018 /58 Comments/in Premium /by Alex - Chart FreakSo far in the markets it seemed like Everything had been taking turns moving higher, right? Aa a lean Green fighting machine, we've seen Tech, Biotech, Oil & Energy, Precious metals, metals and miners all enjoying a day in the limelight. All the charts are looking great!
....Or are they?
.
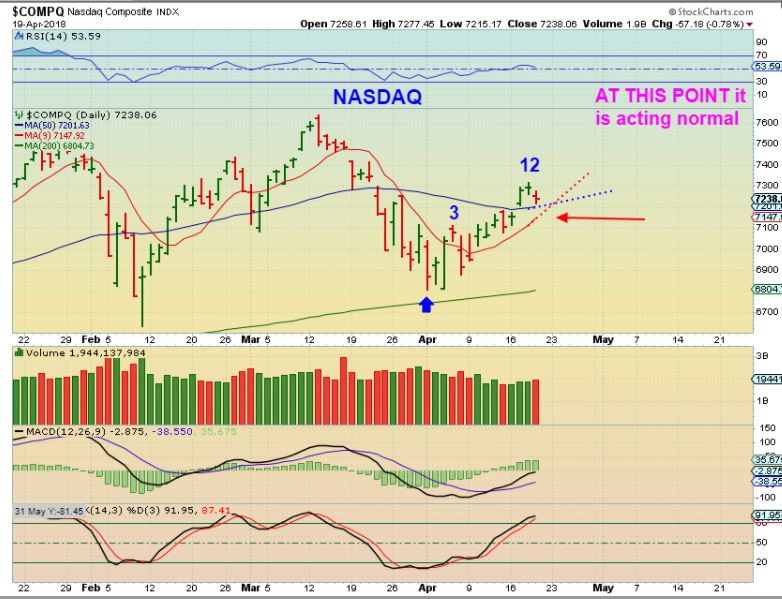
On a day when the NASDAQ had what would be considered a normal healthy pull back,
SOX ( Or SOXL) Semiconductors - Suddenly yesterday, behind the beauty cracks appeared.
Thursday April 19th – Almost The Same
April 19, 2018 /101 Comments/in Premium /by Alex - Chart Freak4-18-2018 Happy Days
April 18, 2018 /131 Comments/in Premium /by Alex - Chart FreakIt was another one of those days when it seems like almost every sector had green in it and stocks that were moving higher yesterday. Lets take a short review of a couple of different sectors and then discuss some of our current bullish set ups...
.
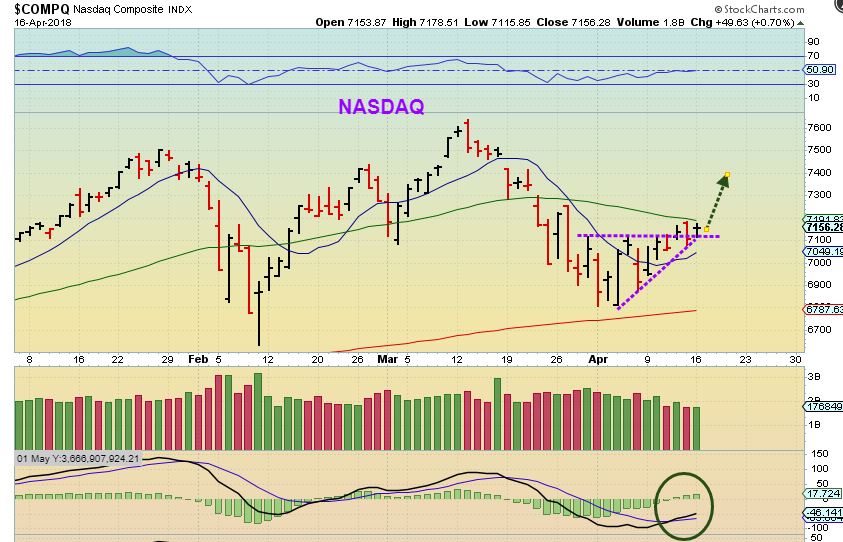
NASDAQ from yesterday - Early in the daily cycle count, I was leaning toward a bullish resolve of this battle at the lows. It was the most likely scenario due to cycle count and many of the stocks that I liked were holding up nicely.
4-17-2018 Things Are Popping
April 17, 2018 /118 Comments/in Premium /by Alex - Chart Freak
NASDAQ - The general Markets were on day 10 of a new daily cycle Monday. The are pushing against the 50sma as resistance...
March 14- Big Picture Review
April 14, 2018 /117 Comments/in Premium /by Alex - Chart FreakAs mentioned in many of the 2018 reports, and especially in the weekend report delivered 2 weeks ago, we are seeing many changes slowly taking place in the markets. Today we will do our very important Big Picture Review, and along the way , I will discuss what I am seeing.
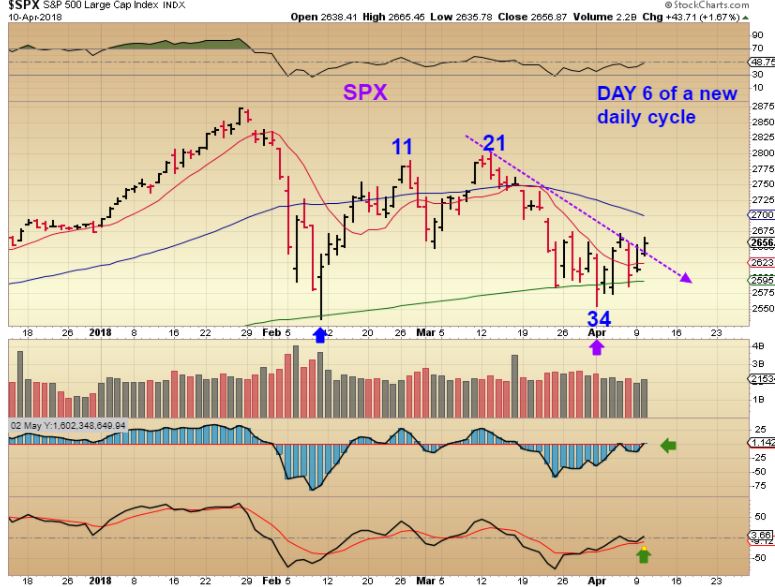
SPX DAILY - So far we still have our low on day 34. The SPX is going on day 10, and we are awaiting an upside break out.
Friday April 13th – It’s Just A Date
April 13, 2018 /114 Comments/in Premium /by Alex - Chart FreakFriday is the final trading day of the week, and usually I do not cover the entire market, just what may be important for Friday. It is enough until we get to the long weekend report.
SPX - Yesterdays chart showed the day count of this daily cycle. We had the low ( DCL) on Day 34, Thursday was day 7, so Friday is day 8, and it is early in this new daily cycle. The chart was bullishly improving internally, as you an see with my indicators on this chart.
Let me show you how they look going into the final trading day of this week...
Contact Us
26 Broadway,
8th Floor
New York, NY 10004
admin@bigleaguefinance.com
admin@bigleaguefinance.com
Latest Blog Posts
accelerator diet pills goji berry diet pills ultra 90 diet pills keto meal replacement bar top weight loss diet pills for thyroid patients where to buy t lite diet pills keto friendly thickener diet fuel diet pills peanuts keto friendly rite aid diet pills that work envy diet pills diet pills for breastfeeding moms belique diet pills perfect slim weight loss pills calories in a bottle of white wine

