
GOLD IDEAS
This report covers a lot, especially when we get to the precious metals – Gold, Silver, & Miners part, so lets just get right into it.
.
SPX – It has been a very volatile market, but let me discuss why I am getting signs of a meaningful trade-able low here (or very soon).
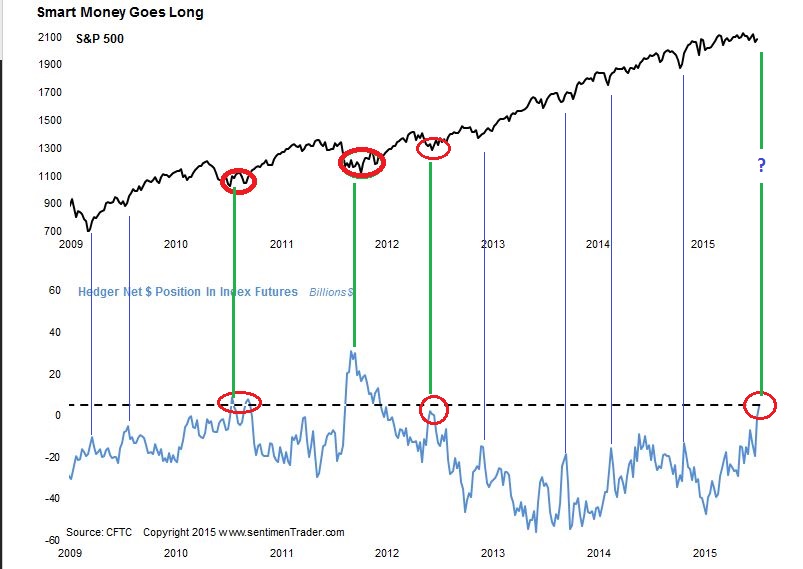
When smart money goes very ‘long’ during a selling off period, and dumb money goes ‘short’, and extremes get stretched, you can expect a low to come in soon. This can cause a short covering rally in addition to buying .
Smart Money is currently going long in a big way.
This chart stat credit goes to sentimenTrader .com. Notice where lows formed in the past? This is not an exact timing tool, it can get extended like we see in 2011, but what this chart shows me is that smart money has only been this bullish a few times in the past 6 years.
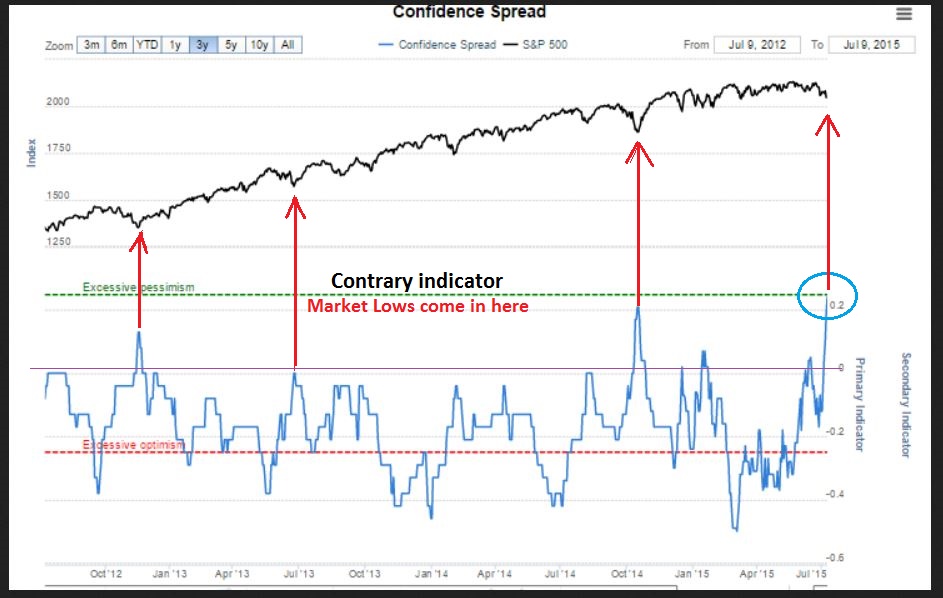
Confidence spread – And pessimism that comes at major lows hasnt been this strong ( July 9th) in years. The crowd expects a crash.
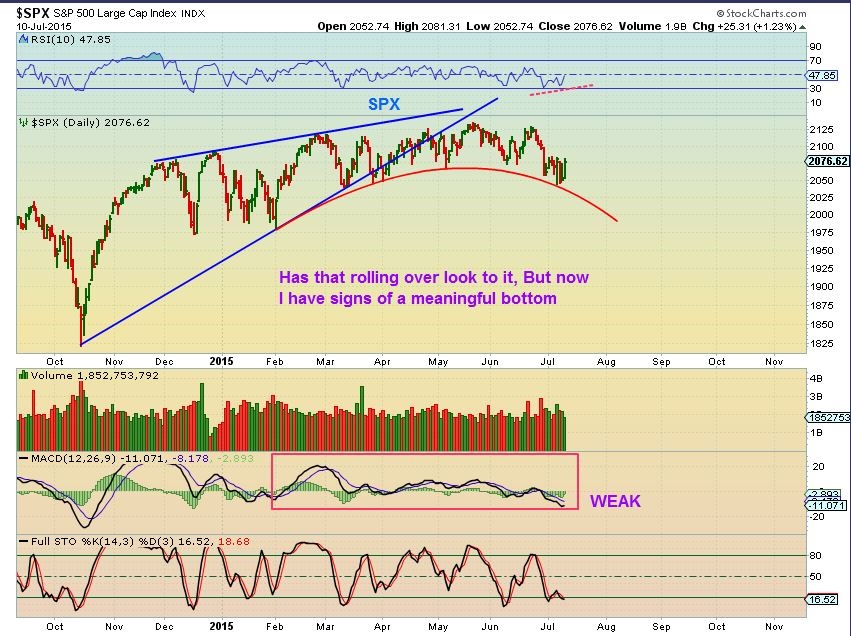
SPX – SO in past weeks I had been pointing out the bearish rising wedge. We do look to be rolling over, but now I’m getting signs of an ICL in the markets. A meaningful low. The SPX ran higher Friday and recovered the 200sma.
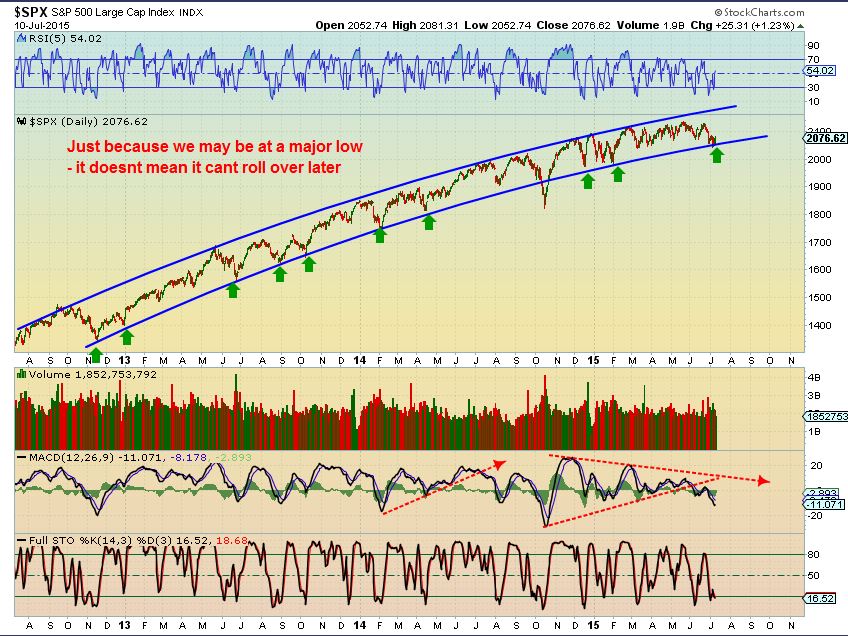
SPX – Just a note: Longer term we still can rally from here and go sideways, eventually rolling over. lets wait and see what the markets want to do longer term.
NASDAQ– the weekly chart for the NASDAQ has a reversal candle just about on that trend line.
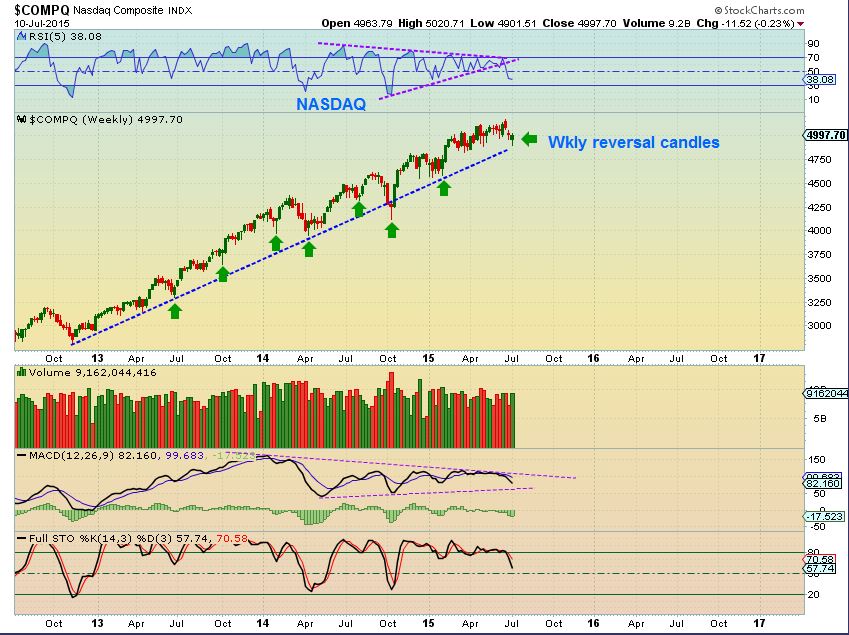
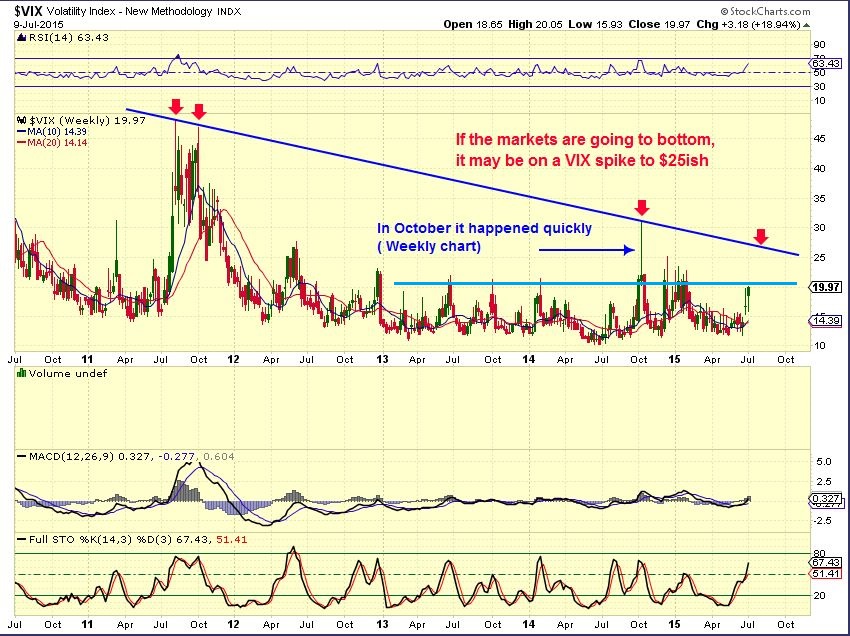
We may already have Market lows in place. Recent news of Greece, China, etc may have put in a low, as the VIX spiked to the 20 area. Just in case the markets start selling off over another Greece report or something else, this is a reminder of what I was looking at with the VIX. A spike to 25 ish is possible, and Markets would plunge a bit. HOWEVER – the pop that you see on this July 9 chart to the 20 area also may have been the lows of the market last week.
So here is a big question. The markets have corrected a bit, gone sideways, and neutralized the excessive bullishness. Will they now continue higher and we will see parabolic blow off markets in time? Or will we get a good 10%+ correction going forward? Its difficult to say, because the markets change as they move forward.
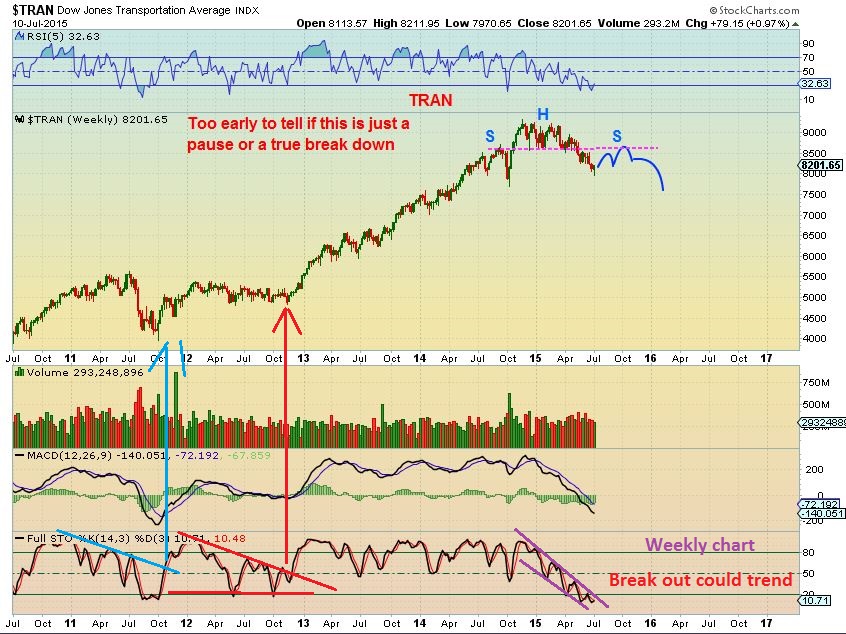
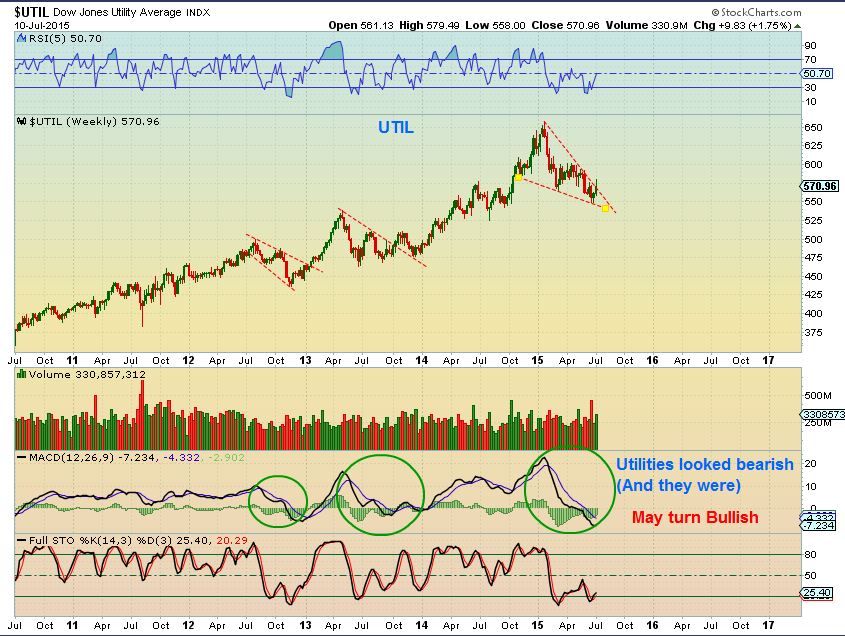
Example: I have mentioned that when the TRAN and UTILITIES sell off, DOW THEORY indicates that the markets are going to follow and correct. Those 2 areas have been selling off and weak, but lets look at them now.
TRAN WEEKLY – This does have both bullish & Bearish potential. It does look like it could rally for a few weeks (it’s oversold) but still turn out badly as a H&S. We’ll have to watch this, because I can also see a bullish scenario where this trends higher.
UTILITIES – I must say this looks very bullish to me now. We’ll have to take things 1 step at a time.
USD – July 6,7,& 8 …I was watching this wedge and calling for a drop in the dollar. It didnt have to be a big drop, but I NEVER go long anything with a rising wedge.
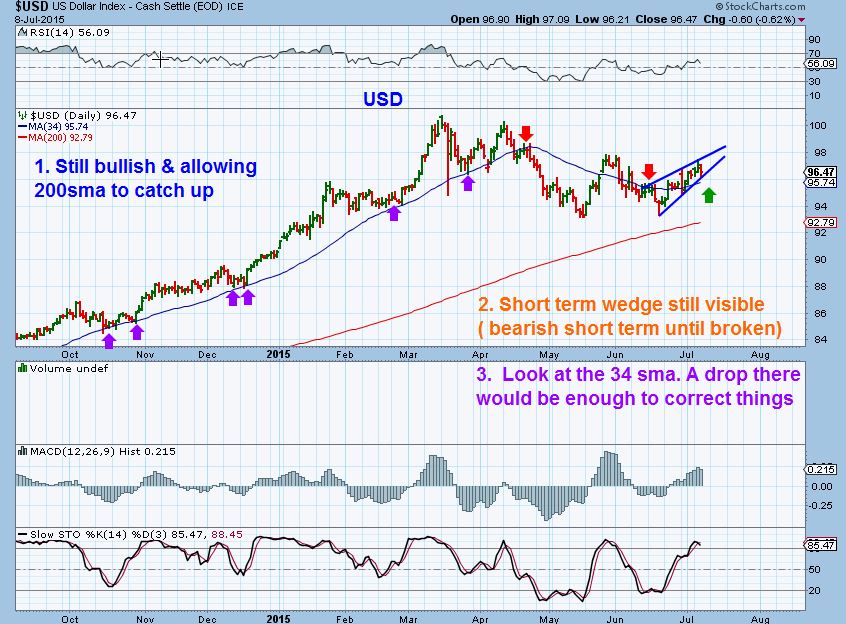
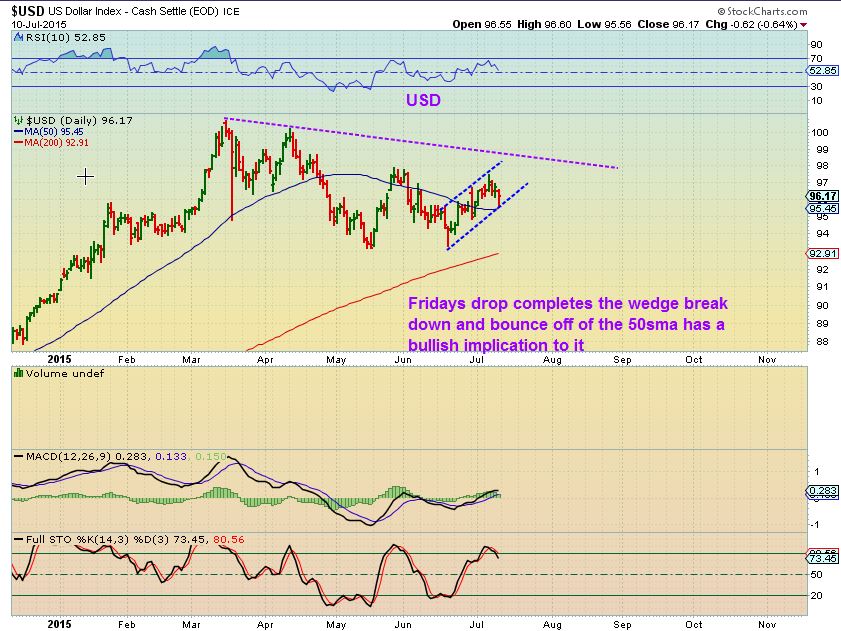
USD – The drop happened Wed-Friday. Now it can be a rising channel. It looks like it wants to run to 98 from here, but since it is overbought, a continued drop to the 200sma is not out of the question. The wkly chart explains.
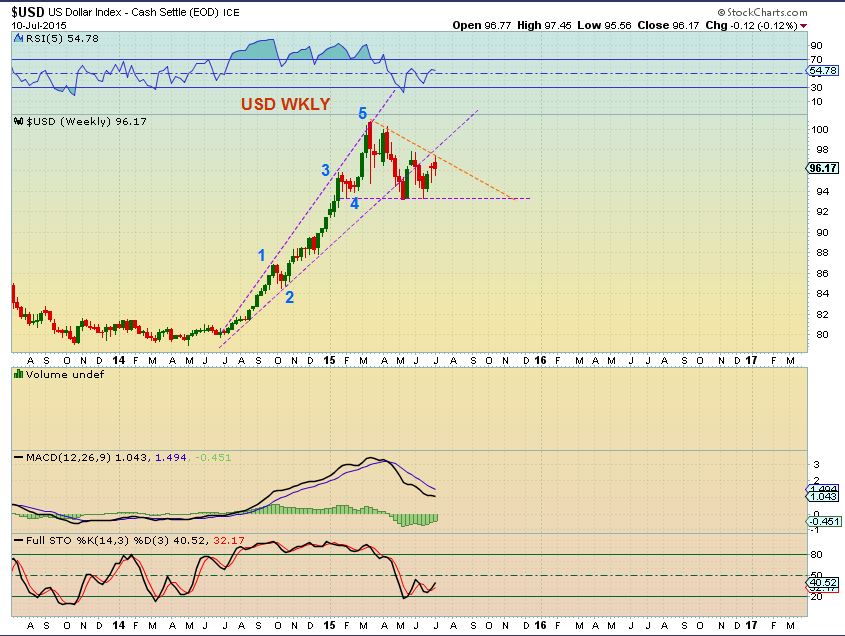
The USD WKLY CHART gets tricky. DO we run to the purple dotted line at 98 in the above chart, and then drop as this weekly chart below seems to show? It may line up with what I am seeing in GOLD. More later.
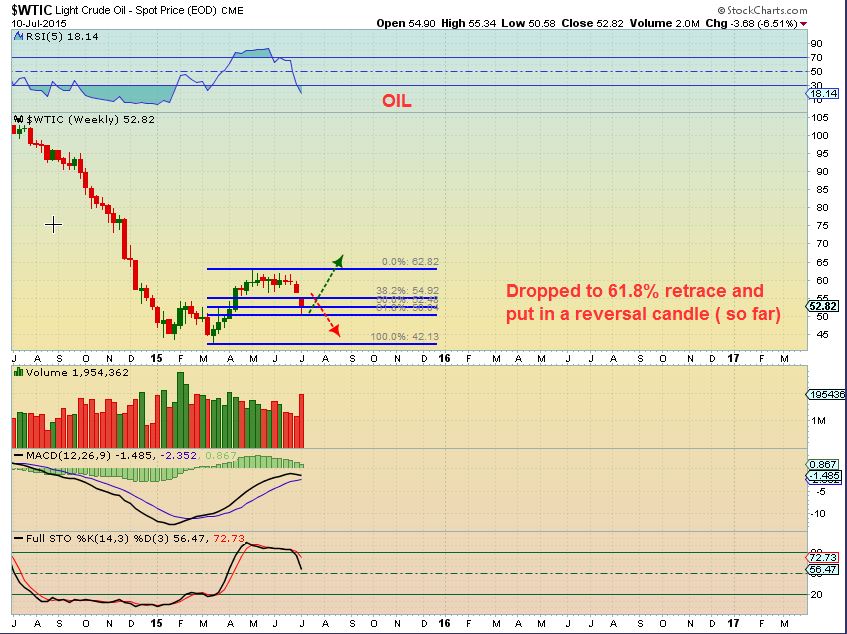
OIL – I think we are looking at a bear flag in the making. We may run higher to do a gap fill or tag the 10sma (not shown) , but I think OIL is going to roll over again. It broke down from a LONG consolidation and still has the energy to really do some damage.
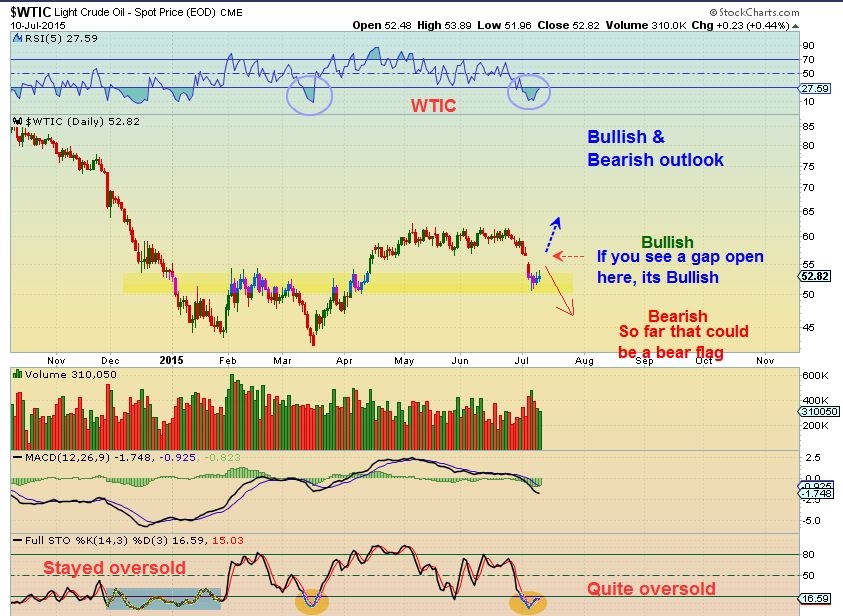
WTIC- reversed at the 61.8%& support. A Bounce to fill the gap above is possible.
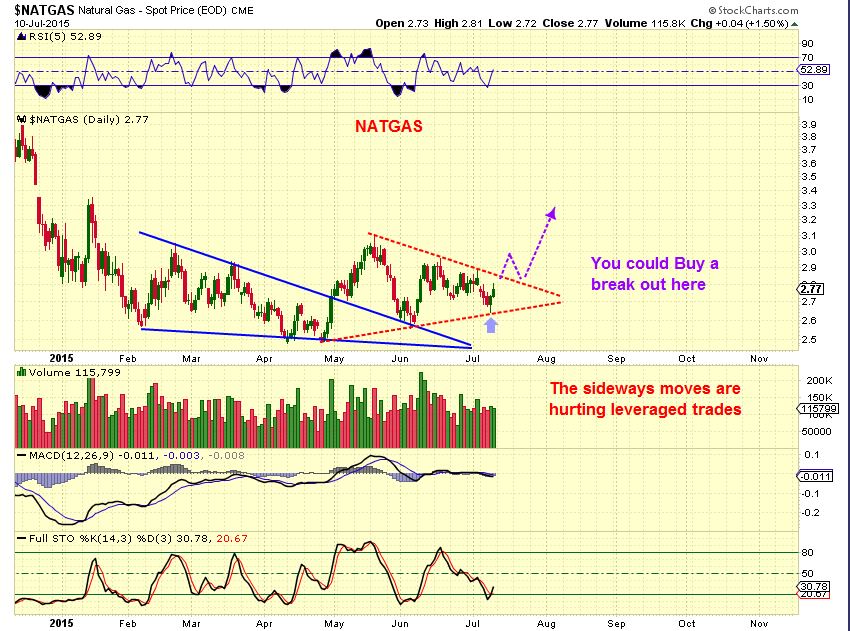
NATGAS – has a bullish set up at this point. I want to point something out about leveraged trades. Notice out pattern has formed higher lows in MAY, June , July.
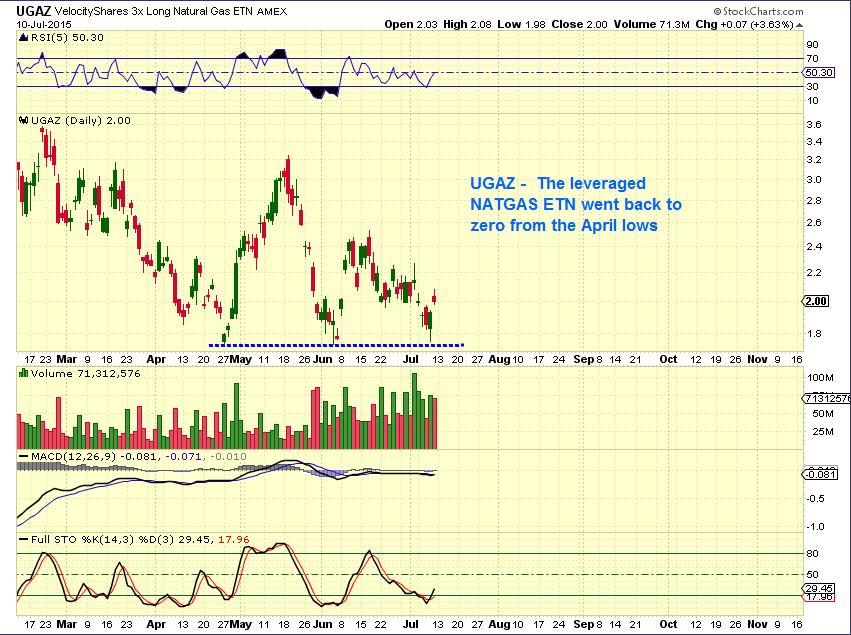
UGAZ – leveraged trade has decay and the NATGAS pattern of higher lows May, June, July does not play out the same in a buy & hold 3x etf. The 3x ETF trades are best as trades only .
GOLD SILVER & MINERS
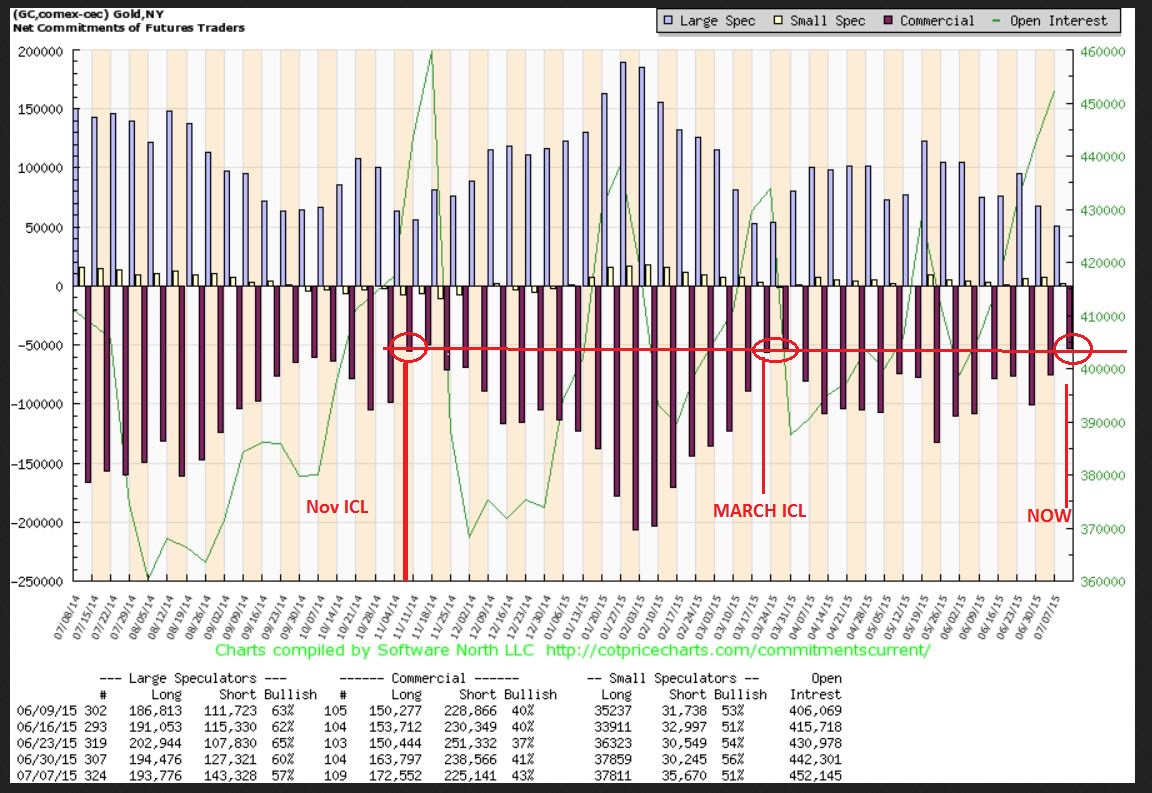
I have SO MUCH to say here, that I’m not sure where to start or how to explain it all. C.O.T. levels are very bullish right now. I believe we are close to an important low / rally in Gold & Silver here. No reversal in Miners yet , so Caution / Patience until we see one.
Let me start here- 4 possible near term scenarios
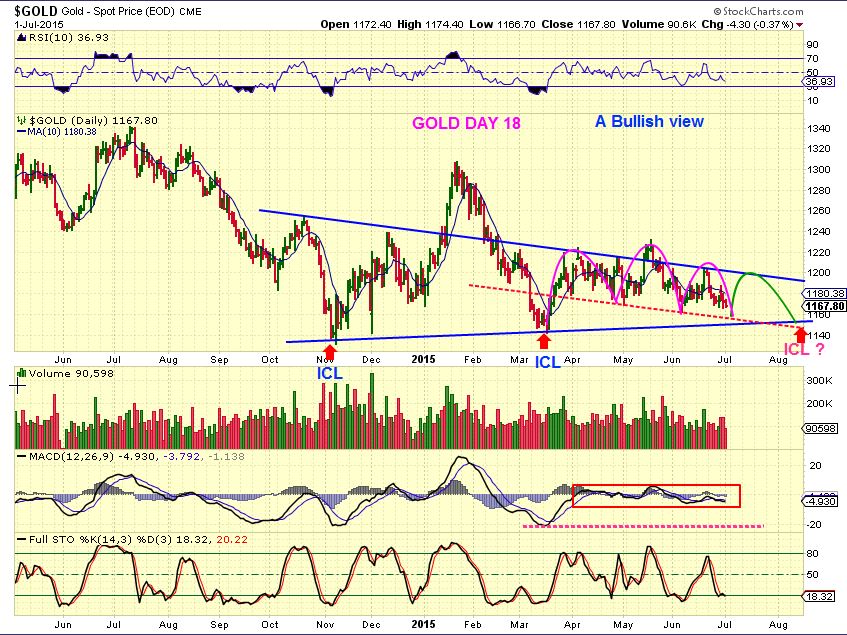
1. An early mild ICL (Very meaningful low) now or this week. (Very likely)
2. A DCL now & a 4th daily cycle that rolls over into the real ICL. ( less likely)
3. I am also now thinking that maybe this ICL produces a rally for a while and that changes the bearish sentiment. Then we actually could drop to the $1000 area later.
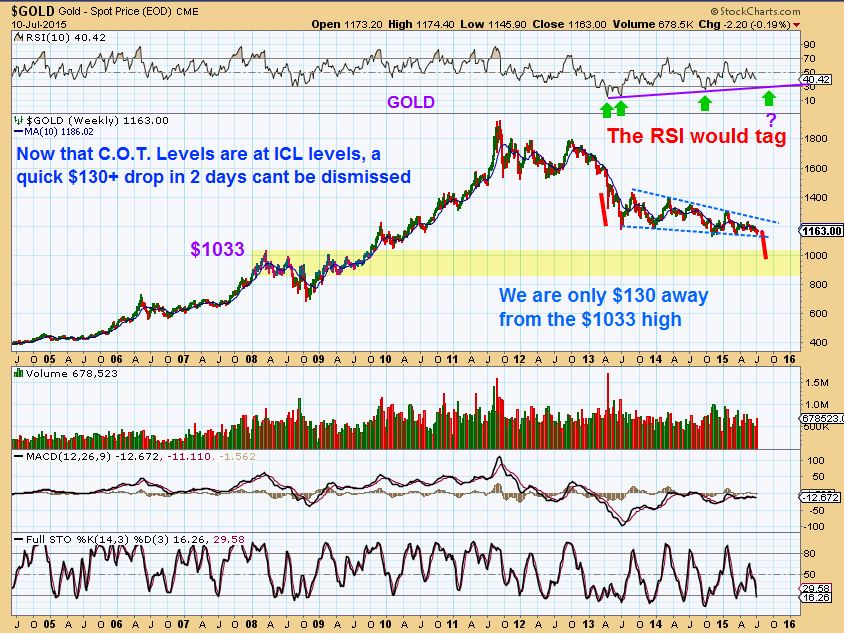
4. less likely, but also possible – With C.O.T. levels extremely bullish, a rapid $100+ drop in Gold to an ICL this week. You get the Test of the 1033 area and RSI tag of the trend line. It would have this look.
Review
– I have been saying for a long time that EVERYONE is saying they’ll buy the plunge to $800-$1000 this spring/summer. All year long , almost every letter writer you have been reading and emailing me about has apparently been calling for that sub $1000 plunge last spring and now this summer. I keep hearing “support broke, we’re going down!” – but those have been stop runs, as expected here so far.
– I kept reporting here that I cannot see that plunge with “Everyone” so ready to buy it. The Crowd is hardly ever correct.
My thinking now is that possibly an ICL now and a Summer Rally could change sentiment to bullish enough that we then could roll over this fall to that $1000 area when many no longer expect it. (Cycle guys will still expect it – it fits their analysis).
WHY an ICL here? Let me explain:
THE C.O.T for GOLD & SILVER is at prior ICL levels already! This is SMART MONEY closing short positions and going long. Dumb money is going short. The break of the Silver lows recently had many calling for their readers to go short. Apparently Smart money closed their shorts. We are very close to an ICL (Meaningful low) right now. Oddly , they used to come every 6 months apart, so just like the one we got in March, this would be very early .
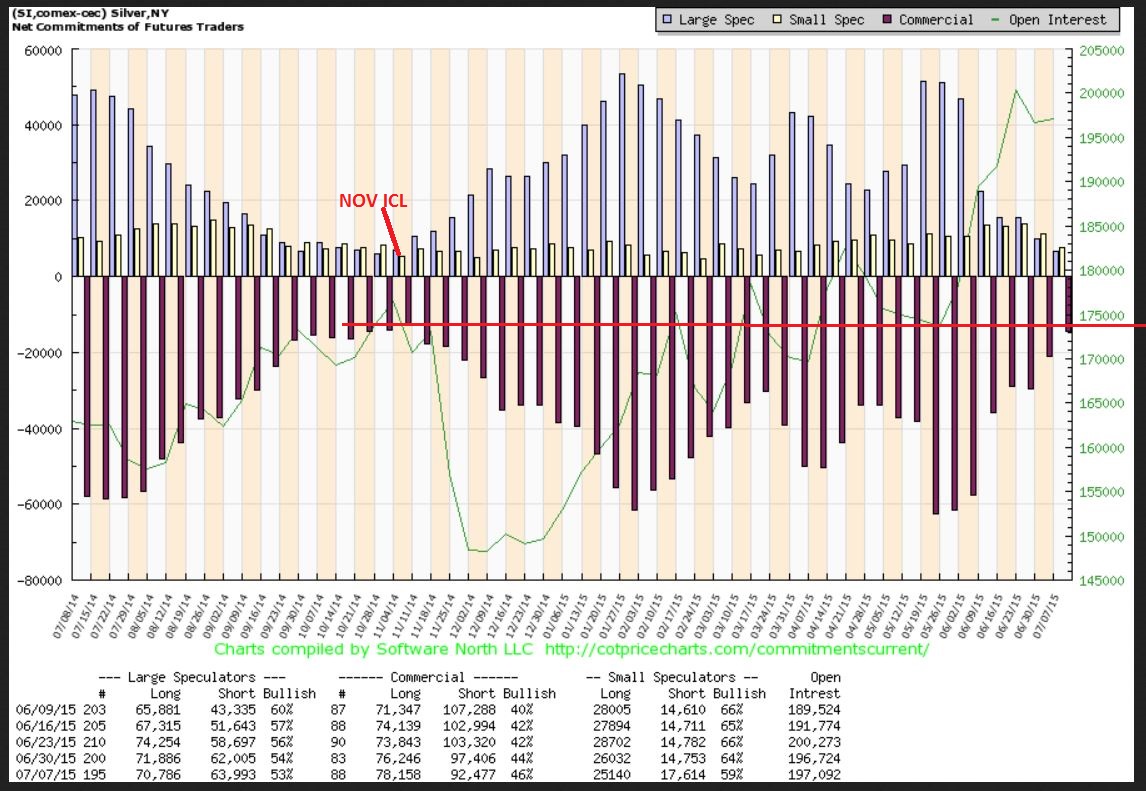
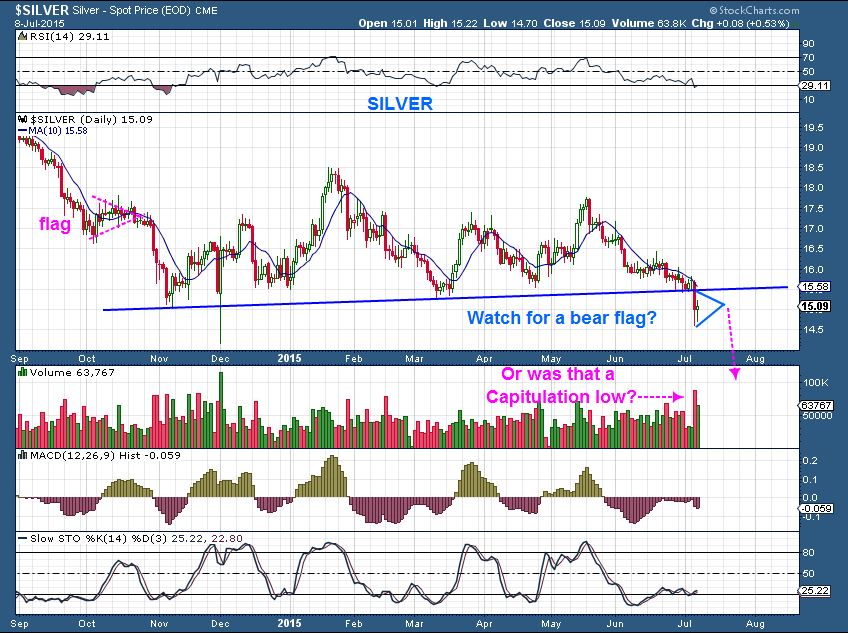
As I mentioned: The recent drop in Silver had many going short, saying that all support is broken and SILVER closed at 5 yr lows. I too cautioned that we may get a bear flag and further selling with this chart, or was that a capitulation low that would recover?
Look at the SILVER weekly as of Friday. Wow. Many who listened to the cry that “Silver has broken down , Go Short!” Are likely stuck. Smart money is going long.
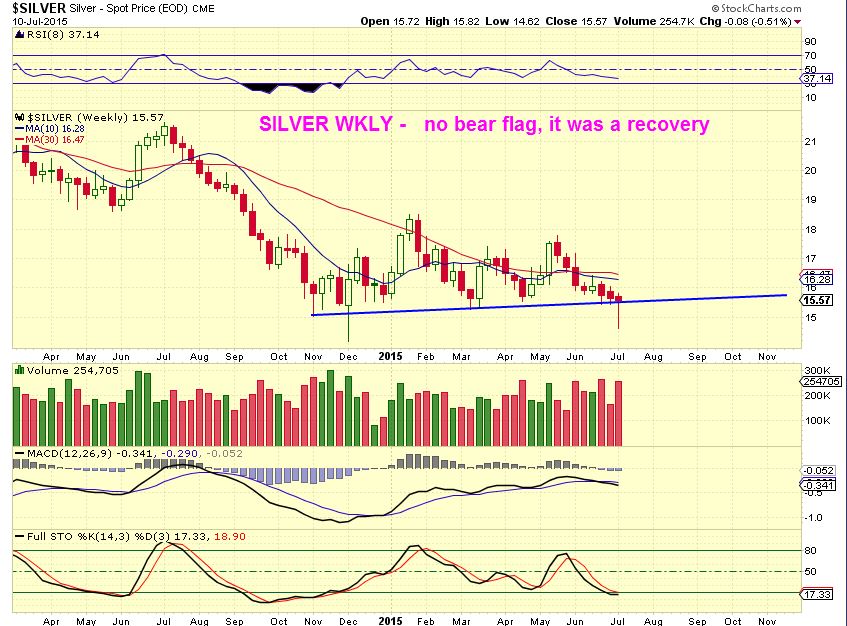
GOLD – I have been pointing out that a DCL can come at this time period. The last one was on day 24, we just saw a low on day 22. Did we just see a dcl , or a very mild ICL? Or will we crash this week into that ICL? Its still not exactly crystal clear, but the C.O.T. is very Bullish, and that SILVER weekly reversal is too. Also Orange Boxes show that moves out of an ICL are not straight up, I’m still being patient for proof .
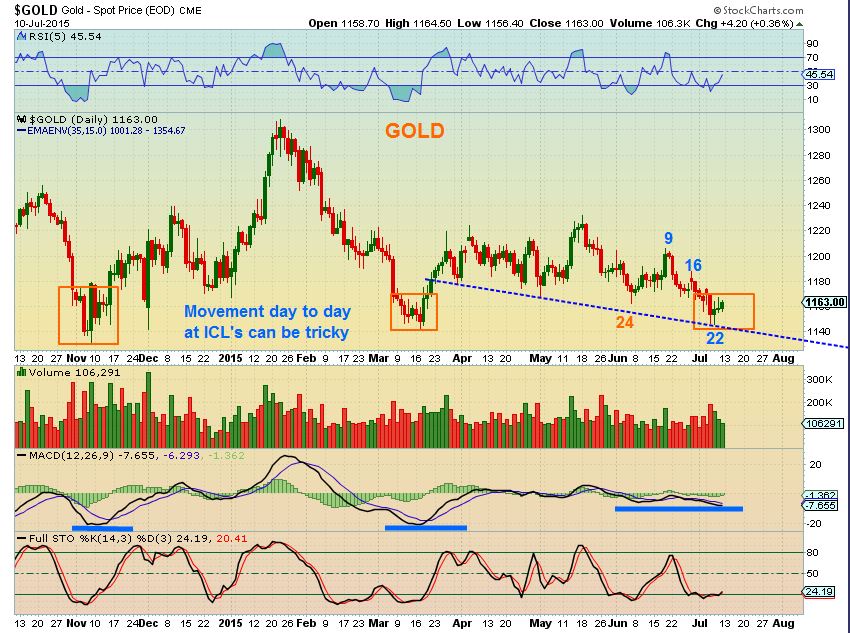
The above GOLD chart shows that if we see an ICL in this area, it is 3 higher lows (Nov, March, July). That may turn sentiment bullish.
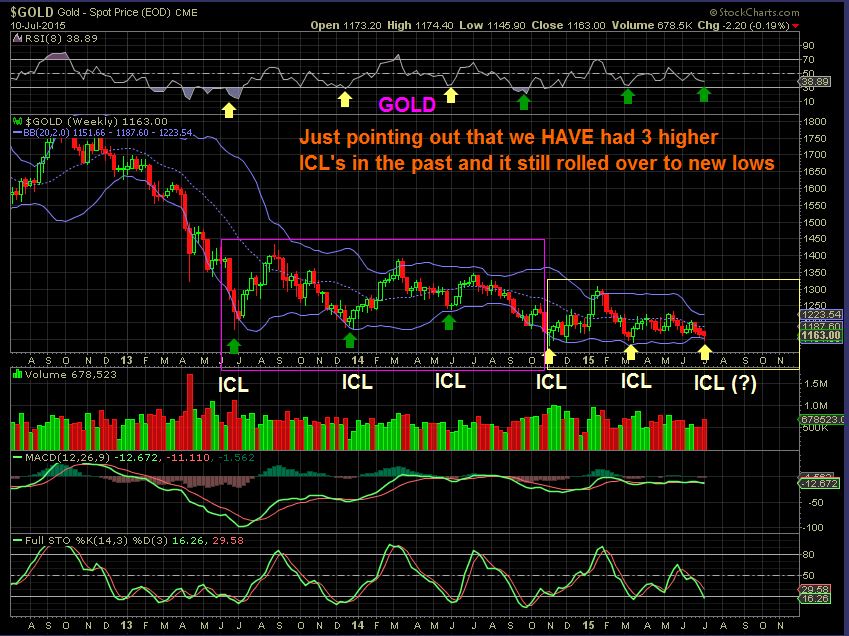
Please note: We did have 3 higher ICL’s before, so I wanted to show that below. This helps us to avoid bias and proves that we can have 3 higher lows and still roll over & drop to $1000 area.
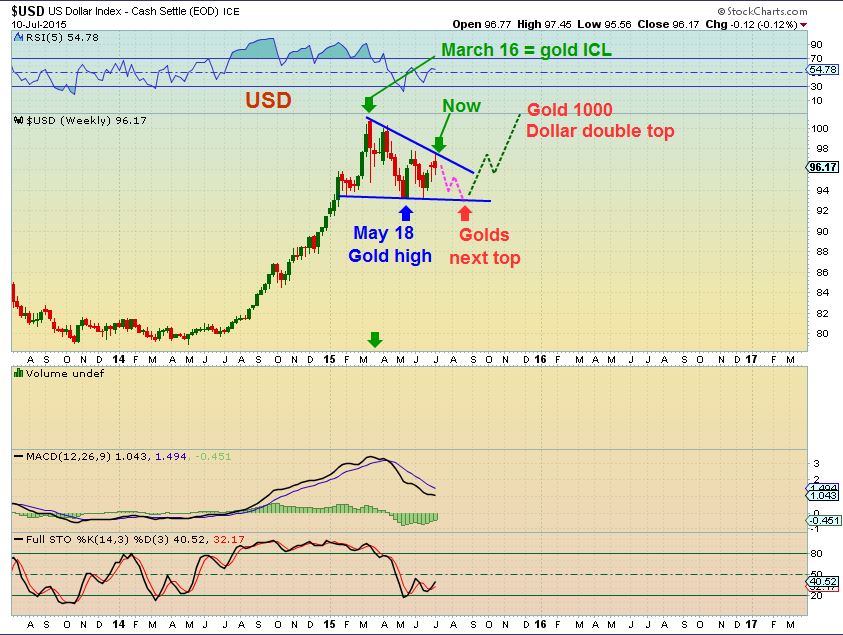
Can I reconcile this with the current set up of the USD? Yes. This is just an idea of how it could be possible:
1. Gold is putting in an ICL now or soon, 2 daily cycles higher, the dollar would drop from here (Magenta lines).
2. Then the dollar bottoms as shown and rallies to a double top & GOLD drops to $1000 finally into yr end
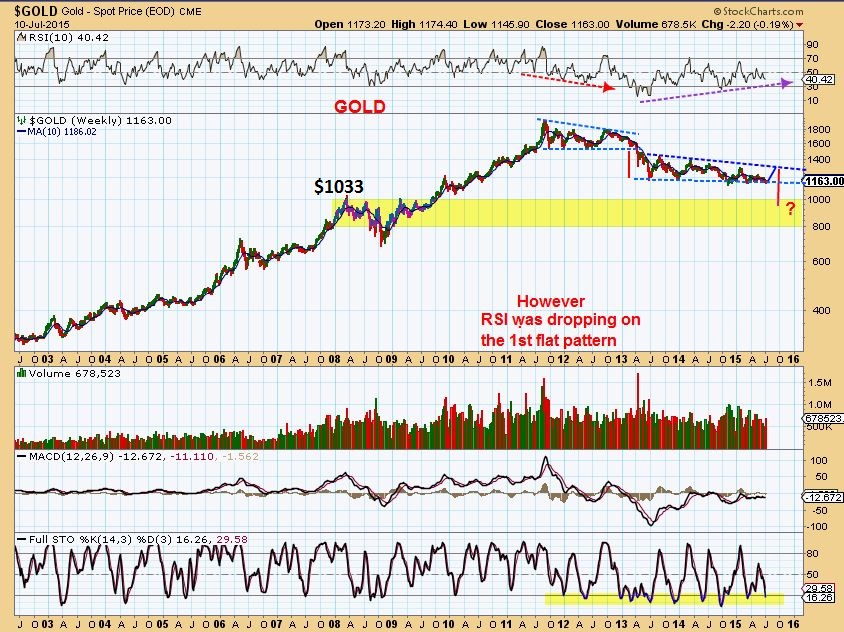
GOLD would look like this, which is very plausible. A rally now & then we drop to the $1000 area. We also dropped from a flat base triangle in 2012-2013, but the RSI was dropping then. We are seeing RSI strength in this base.
NOTE: I AM NOT FIXED TO THE ABOVE IDEAS OF GOING BACK TO THE $1000 area
My thinking was that everyone expected it all year long so far, so I didnt think we’d see it. Now if we rally, we’ll see if everyone gets Bullish and then that drop can come 🙂 It is possible that THE LOWS could be in here and GOLD / SILVER may rally upward, leaving many behind waiting for Gold $1000, as I have mentioned in the past too. We will watch how it plays out unbiased. The point is, the C.O.T. reports are very bullish right now. They are at ICL levels, we need to be alert.
July 1 – Before the C.O.T. report came out, I had drawn this chart of what I thought a 4th daily cycle could play out like. If everyone was still calling for $800-$1000 Gold, I thought we’d remain in sideways mode. This is possible but less likely in my opinion.
-I actually have a several other charts for the Gold sector, but I will save them for future reports as things unfold. I’m going to conclude this here with a quick wrap up.
I think we are about to get some good buy opportunities in the general markets which could be putting in a Bullish meaningful low. OIL is bouncing and may just be putting in a bear flag. I honestly think that the oil cycle topped and has plenty of downside left, it may be a good shorting opportunity if it plays out that way. Oddly, Natgas still looks bullish. I think GOLD / SILVER are near or at their Summer lows and will rally very soon. The C.O.T. levels are at prior bullish levels. The hard part is how will it play out?
1. Summer Rally from here for 2 daily cycles ( 2 months) and then roll over?
2. Flash drop now into an ICL this week ( maybe even dropping $150 to the $1000 area?) and then flip & rally upward?
3. One more daily cycle that leads us sideways / down for another month?
I think that the smart money is telling us that GOLDS lows are here and the strong Silver wkly reversal is saying the same. Confirmation will be in future action, likely this week. It could be whip saw type action, so it may not be easy, but I’ll be looking for signs of that low being in place. Miners closed at lows, so GOLD/SILVER may have another quick drop left too. I think we need a little more time. Time will tell.
Thanks for being here, I’ll be looking for trading opportunities if they present themselves this week.
~ALEX
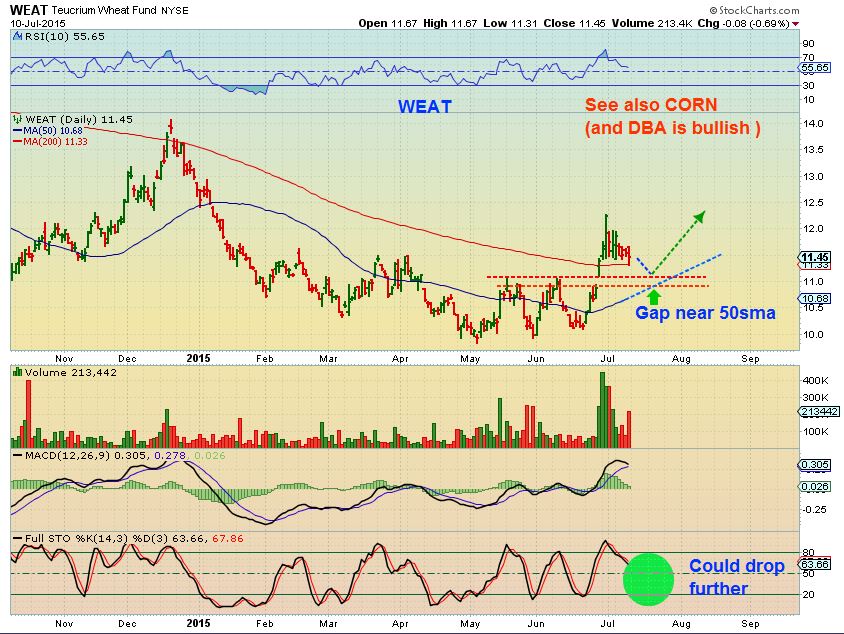
I liked the look of DBA chart a lot. When looking at WEAT, CORN, SUGAR , etc – this looks like a bullish area. Corn is a bit extended and may need to pullback.
WEAT may be on 200sma support, or could possibly work back a bit more to the gap. WEAT & DBA currently look bullish


Double Bottom on GDX just hit.
Hey Bill,
Hope you had a nice weekend. Slow board today 🙂
I’ve been mentioning that for a retirement account or long term hold, I have loved UA , NKE, ULTA, and a few others.
UA sold off and formed a cup & Handle….Breaking to new all time highs again. What a great stock for the longer term holders this has been.
Actually all 3 are at all time highs right now, and this is after we just had a volatile week last week.
Thx for the advice. Bought a small amount UA earlier, got nervous in the sell-off and let a small amt go for profit but held on to some. Good call for sure! Thx.
Yeah, Its a good company . That sell off into the cup was a little concerning watching it real time. Anytime you get almost 2 weeks of straight selling I just think , “this is ridiculous!” but I actually bought some yrs ago before they split – so I just watched to see if it would go as far s the 200sma, but it didnt.
NATGAS broke out of that triangle
I took a position in Miners JNUG & NUGT as soon as JNUG went green. NUGT still red.
This is not really low risk, but keeping a tight stop makes it lower risk for “traders”.
Looking at the MARCH 16 lows, these can hang at the lows for days, so it may not be a reversal and straight up, I am trying a trade here in case we get follow through
I saw silver stocks responding well ( CDE, AKG, SSRI, and some gold miners too). Maybe this is where they reverse
I forget who, but someone here was still flying the KITE last week. Nice move today
Ahoy!
: ) nice move and I think it continues (after a small pullback?)
CDE gap fill & reversal higher ( See SILVER WKLY chart in the report). AKG, SSRI, and HELLO HECLA (HL)
I sure like the Oil Sector’s (XLE) long term charts (monthly, weekly) for a buy with a stop below the recent lows at 72.42.
Wutcha think CF ?
Yeah, It actually looks kind of good volume – wise for at least a bounce. Then you’ll have to monitor its progress from there.
It dosnt look like it has the force to blow out the lows at this point.
Starting to build a position in GDX Calls here…..fwiw
I want some skin in the game.
Very good risk reward imo.
I just have 3 letters for you. X I V
Alex, based on report and discussion here, seems I would be best off selling out of DUST. Realize now that my exit was this AM (was busy and missed it). Last 3 weeks you could short any pop, even intra day on miners and be guaranteed to be good. So, sounds like that is over for now and limited risk/reward to the downside, right?
I talked IMH a couple weeks ago. Sold Fri at 20.8 from 18.8 Hit 22 intraday today before backing down. She’s a bit volatile to be sure, but may be worth a watch. Also flying KITE, short oil (SCO), long gas, short volatility (long market).
I made a few bucks on last two DUST trades. This is a small position with reasonable stop, didn’t want you to think I bet the farm on an eminent breakdown. Thanks!
There may be more room, but that COT number does usually indicate that soon there will be a strong pop and then short covering. Like I mentioned it’s not an exact timing tool, but it has been extremely reliable.
Thanks, Alex. Yeah, I saw the COT in Friday and had been wondering since how it would play out. I closed all metals sector shorts today; even if it doesn’t zoom up this second, I determined the risk/reward to bank on major, immenant breakdown wasn’t in favor to the downside here. Essentially, right about breakeven.