Quick Low Risk Trade Idea –
I must say that I am a little disappointed in some Energy stocks . Some are still good, but I got stopped out of GDP and sold REXX under the 50sma ( I still hold longer term shares from the $2.60 area). Will I re-buy it if it goes above the 50sma? Only if it bursts higher with Strong volume.
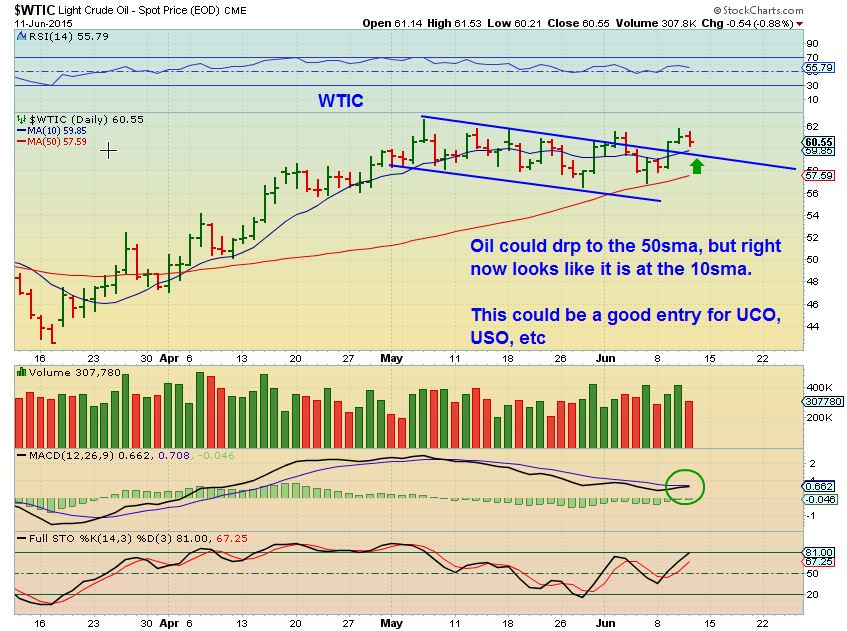
I am thinking that OIL itself still looks good, so I may deploy my money in what could be considered a “low Risk” trade . The only reason its low risk, is your STOP is close by- underneath your BUY . Either a little below the 50sma or where you are comfortable.
The buy would be calls or USO . Some may want UCO ( leveraged , so be cautious). Very Experienced traders in front of the screen may want UWTI. I will not be around to monitor these trades for you, please know your trading plan. Thanks !
Public Post – Some Random Charts and Ideas 
 How Does It All End?
Scroll to top

Alex, Did you mean a good entry point for oil @ 10 MA or the 50 MA? i took a short position via DWTI & planning to close today &switch to calls.Thanks.
I think the 10sma is going to hold, because the upper channel line is there too. I was saying that it MIGHT drop to the 50sma tho
PACD has strong volume off of lows right now. (Kind of a good set up, but many Energy stocks have been disappointing ).
The chart looks good, but it also looks like GDP, which I bought and got stopped out of.
Coal stocks (ACI, ANR, BTU) showing once again that knife catching is harmful to your health. Yikes
As I’ve said before, that is their specialty. Losing investors’ money. They’re good for tax loss writeoffs, otherwise, I’m inclined to wait until after the sector bankruptcy phase.
I wonder if the energy stocks are signalling this was only a bear market rally and it’s coming to an end????
Thats not a bad guess, but it is not necessarily what we are seeing
I will cover it in my weekend report.
Alex, what are your thoughts on natgas? It’s close to the 10 and 50 sma, so if the bull swing is still in tact is it a good spot to reload?
Hi Zoli
I like the small reversal today . I was eying the $2.70 area, but today may be it. Refresh for a quick view of yesterdays price chart & why the $2.70 area seemed reasonable (Click on it)
.
I’m in on this but would add in the 2.75$ area.
Great, thanks Alex
Love the setup. Makes a lots of sense.
Thanks Alex
What do you think of DVN Discovery Ventures?
Cant find the chart –
DVN is Devon Energy
Its a mining stock. $0.21. Love the volumn increase
Got it…Canada stock, sorry about that.
The Canadian DVN.V looks great. Nice weekly chart. Daily is nice too. Could wait for a pullback? It ran up in March and did pull back, but this does look like a good break out on the weekly.
( The OTCBB stock has no volume, you’d never get out in a sell off).
Maybe time for another sector?
Updated TLT channel, failed breakdown. Failed breakdowns normally soar.
https://pbs.twimg.com/media/CHTjXzoWwAA0B21.png:large
I dont see it as different from my TLT chart. When I drew my TLT chart ( refresh, its here) it was prior to the break down. The break down came soon after . The moving averages were curled down looking like a break down would come, but then it had string divergence and reversed.
The reason he has more of a wedge is he chose to draw his bottom line from the Highs of the DEC highs. I didnt
Thank you. I changed the comment before your replied.
Oh yes, I see that now. Also sometimes I get varying steepness from LOG SCALE or even the length of the time frame.
Small postion in SOL
Did you see CSUN today?
Yup
AUY, Yamana just did a fakeout run below the lower trend line, now green?
There are some seriously damaged charts in the energy sector. Breaks below lower trend lines. RIG, WRES, REXX, KEG, EXXI. However BAS, GURE, HERO, DQ, PACD look good.
So true, and breaks below the 50sma (REXX, WPX, CPE, OAS ) to a chart that was potentially acting correctly.
CIE still at highs
Yeah out of many of my stocks most at a profit due to the entry point. But charts on many below 50DMA don’t look good. In natural gas and oil trades as well as some low priced miners and energy. I’m thinking the next big trade will be the miners but may take until the end of the month or early-mid July to get a proper setup. I am headed to China for two weeks next Friday and would like to be a little light when I take off.
I agree, there is going to be a good buy in Miners ( not sure if it’ll be the end of a 3rd daily cycle or a 4th, but should be great.
And have a Great trip to China!
I can continue to cry about REXX on the hour. She cut me, man!
Alex, looks like the market is headed higher and commodities are not. Any good looking setups on general market stocks you follow?
The weekly on $CRB suggests it is trending up
I have seen this pattern with BOX in other stocks. It POPS strongly on good news and profit taking kills it, but it canre-coop.
I was looking at POSSIBLE ( not sure) Last engulfing candle on TWTR ( CEO removed) ,
I look for follow through on TKMR,
RDN is a good set up Wkly & Daily
,KNDI, AXLL, , RKUS, Still watching FMSA at the 50sma, himx, I Like ETSY , CMCM shake out a few days ago, CORT, CCIH, SNSS (odd) , INVN, LEJU,
All for various reasons.
SFY is my only energy stocks acting positively today.
Still in GDP, (bought in again 2 days ago). Holding on until $2.35.
Feels it will rocket next week.
FCG is still not launching…
Love CRK chart.
tempting to snatch a few shares (with a tight stop).
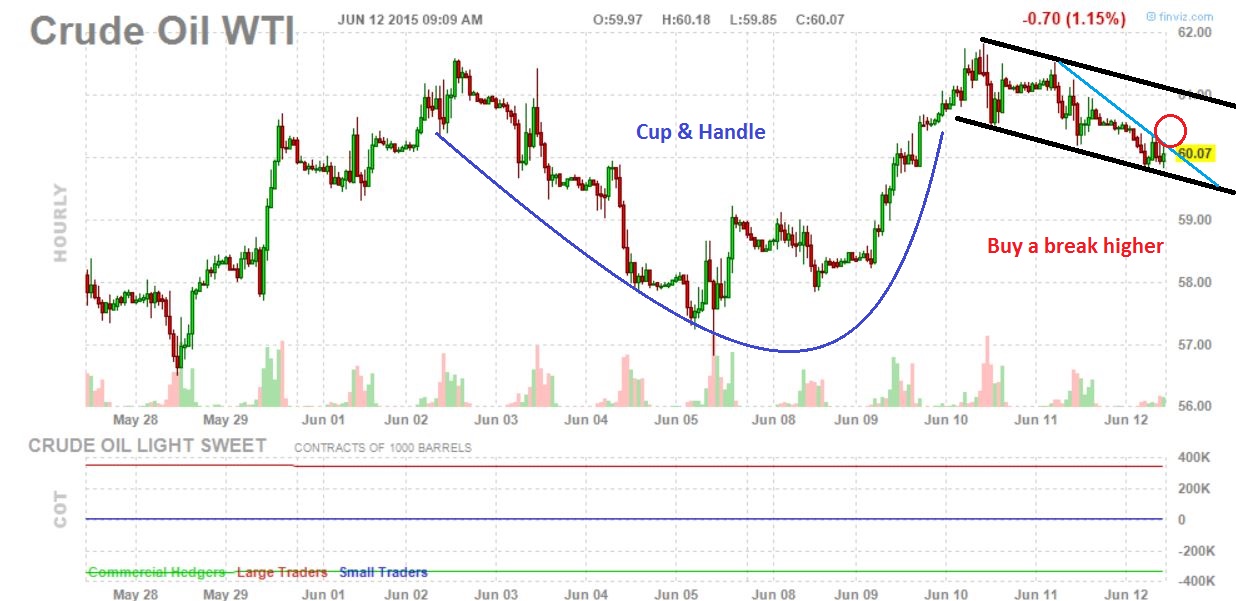
/CL bull flag (on tick chart) – line in the sand $59.85 (10MA)
see chart.
Alex, great stuff, clear, concise. In. Added USO calls $21 strike. UWTI holding 1/2 pos’n, added to BOIL.
Best Wishes Cason
Thanks! I could use some good luck here, been beat up pretty good recently.
UWTI- at breakeven, USO slightly behind, CLNE – breakeven, REXX – semi-significant loss.
Reviewing charts today Still like oil and gas next week. Weather much warmer patern, could be much better report Thurs. Rigs count (Baker-Hughes via Seeking Alpha) lower by 7, down 61% from peak, lowest since Aug 2010. Watch RBOB and distallates at EIA report for clues on crude not just headline #. Gas consumption nearing peak period in US.
REXX closing below lower BB 2 days in a row. Expect snapback if crude moves higher next week.
We are all so sick of waiting for action, that we gave up on SZYM too ( I had) . This week was interesting
$3.00 Monday – $3.75 at one point Today
BWEN & GURE interesting too
Well, right or wrongly, not all of us…
In the long run, I think there is upside. Even now it looks to be forming a pretty orderly Round bottom since the April Highs.
I did well on it overall but gave up on the rest of my position this week when it couldn’t hold its 50DMA.
II did too…I had accumulated this lower when I first started pointing it out in the $2’s.
It looks to be re-gaining strength.
Well I got a few more gray hairs on this one because I made my usual error (stops too tight) and got stopped out on my position at $3.01 Monday which actually would have been a great place to add. But…good news…I recovered by buying it back at 3.13 this morning after watching it retrace this week’s move so I am back in SZYM at a full position. So glad.
Wow! I bought it back too, but much higher than you. I think the weekly chart shows promis, but I would like to see it close above $3.42 today or next week ( 10 WMA).
It held the 30WMA through the whole downturn and that’s important too
Alan, not alone there. How many times have I stopped out at what turns out to be a great entry! I stopped out of TLT Wed only for bond prices to soar for next day and half. If I had added would have made a bundle. But of course if I had added bonds would have fallen hard! 😛
Alex, Any thoughts on natgas? Falling a little faster than hoped but still above the 10 and 50? Maybe another 1 or 2 more days for flush or better to look for a reversal?
I Deshy
I posted a chart several comments below. You can look for a reversal in that $2.70ish area before stepping in.
My bad!! Didn’t scroll down far enough…thx for responding!
No worries…many here work all day and just quickly check in on a 5 minute break or so. Glad to help. 🙂
Further down I mentioned that TWTR is changing C.E.O.’s and it looked like a “last Engulfing” candle. That is a sell off that engulfs the candle from the prior day & then recovers ( usually recovers the following day )
TWTR just went green. That could be the lows.
REN positive!
Check out the COT guys.
Almost the same as the March ICL? In Both Gold & Silver, must be the DCL
Saw that. That’s what I was thinking!
Interesting, from Nov shorts mostly ramped the whole time as it rise, haven’t seen it pullback mid-ICL like this recently.
/CL is setting up for next week.