Stacking Up
Things are stacking up as expected.
.
SPX – it was assumed that we would turn higher here. A low risk long trade.
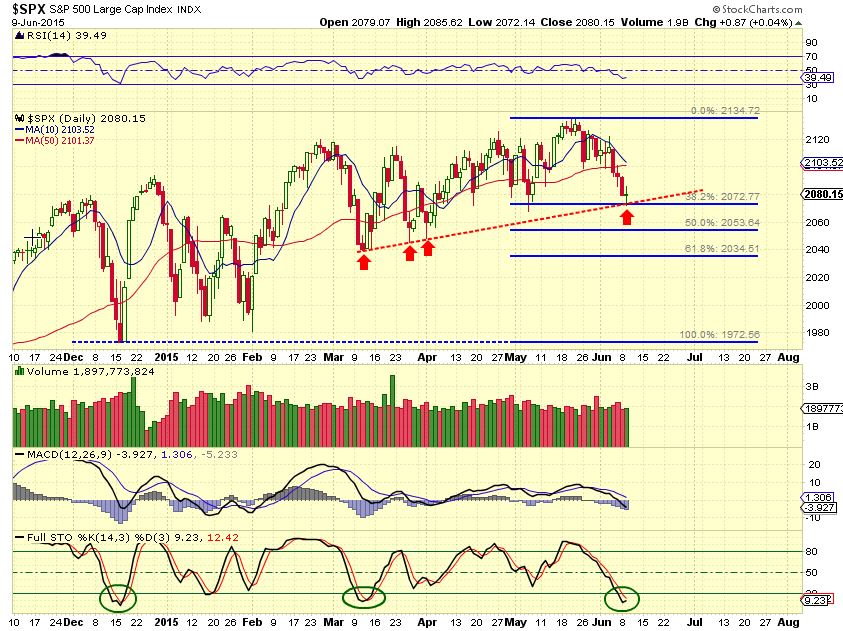
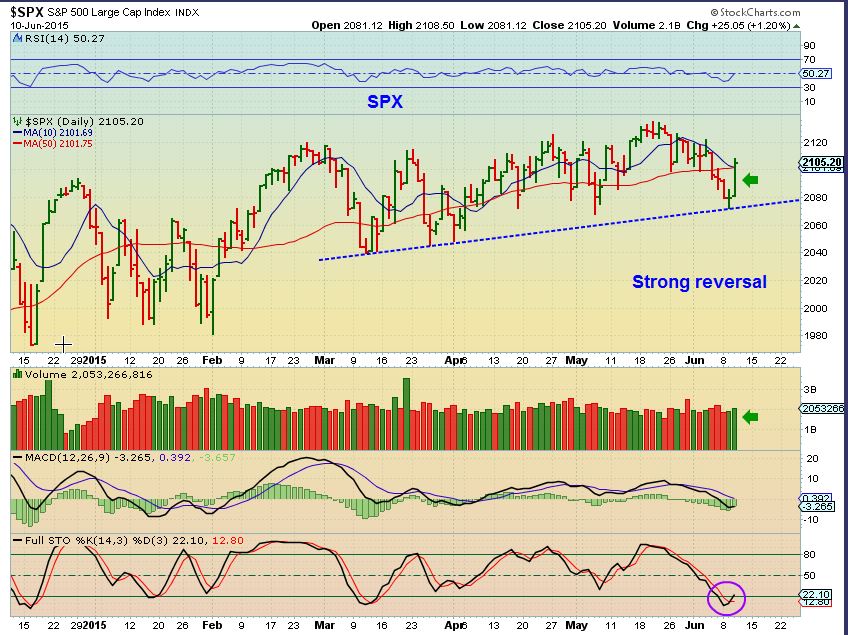
SPX – this was the follow through as of yesterday, and its still oversold.
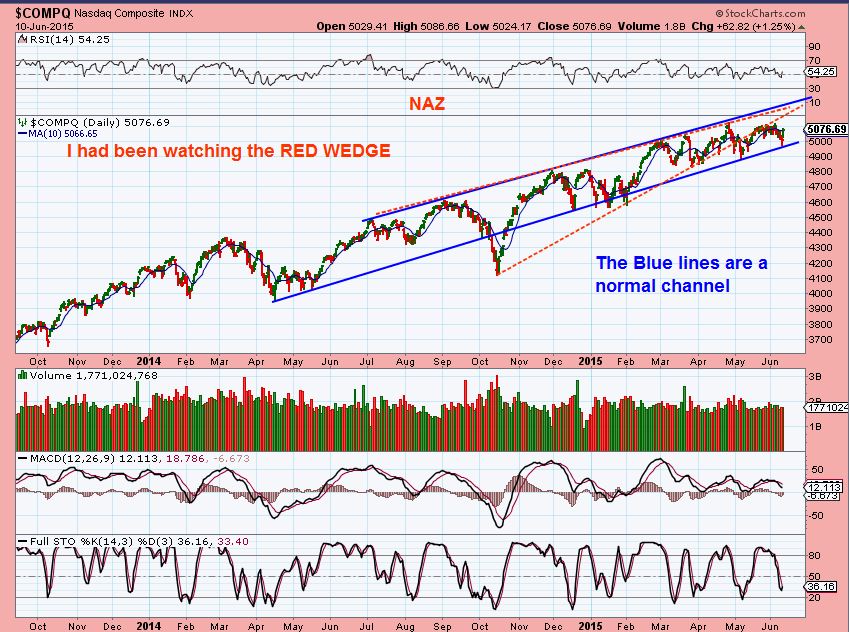
NASDAQ – The upper trend line could be drawn parallel using April highs as a tip. This would give it even more room to run.
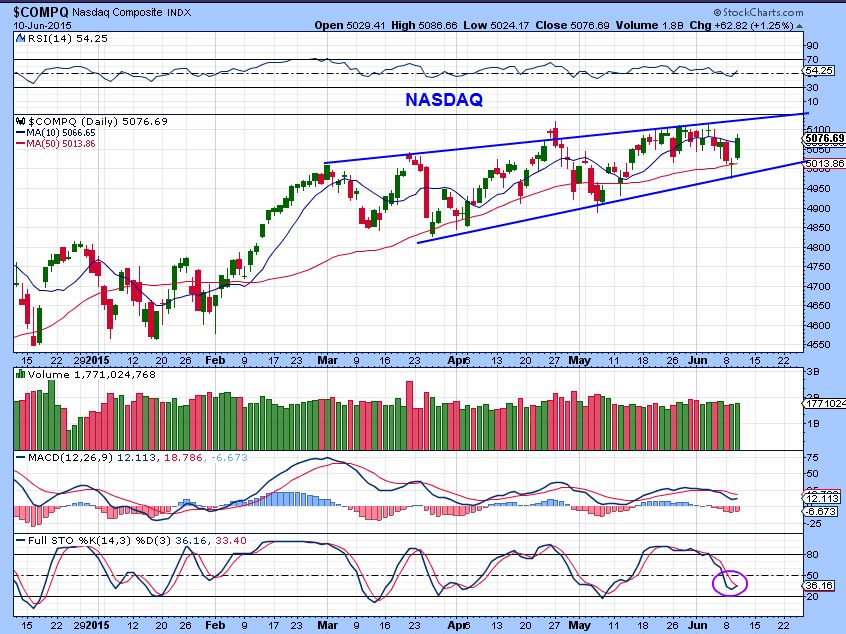
I was watching a wedge pattern in a few of the markets. They broke down and ‘tagged’ the underside, but the longer this sideways consolidation plays out, the more this pattern can morph into something else. I am still watching things with 2 differing views.
$WTIC– these candles are topping candles. It can lead to a simple 1 or 2 day sell off, so I expect a small pullback .
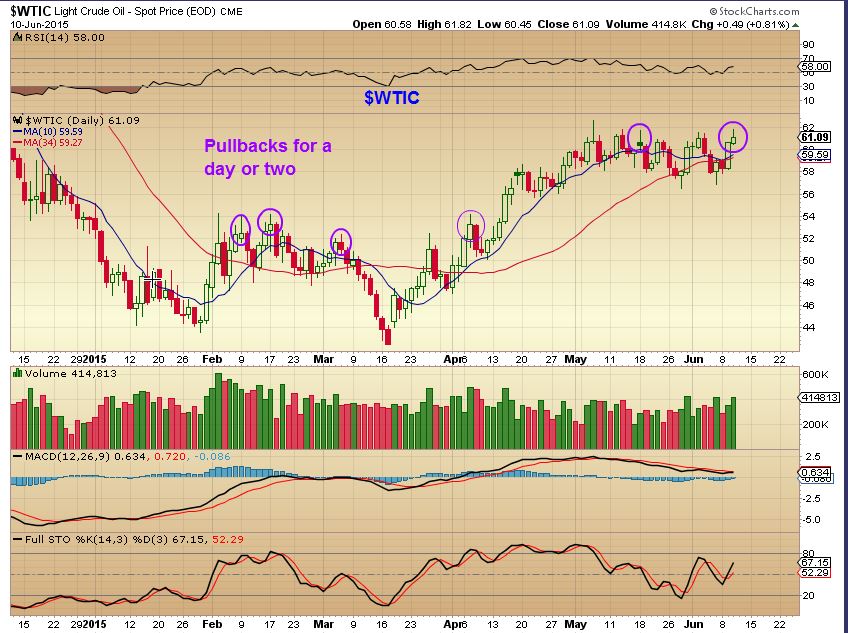
No big deal, we are still looking at something like this-
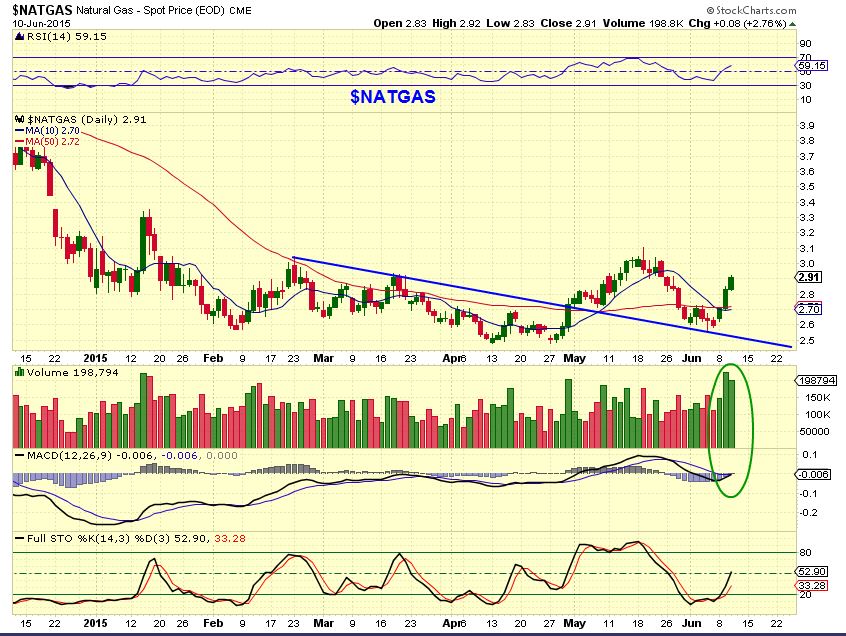
$NATGAS– great move and nice volume. This trade is paying off well in UGAZ
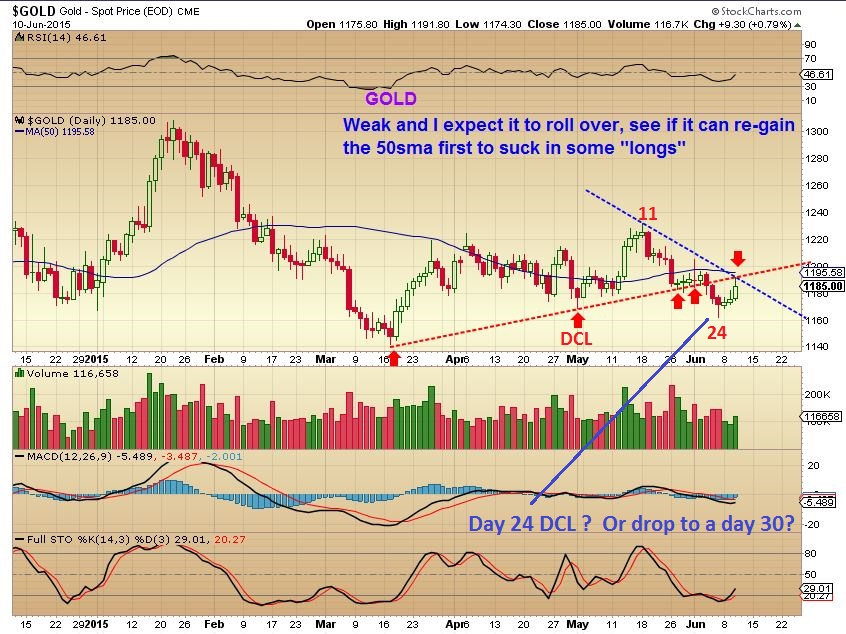
GOLD hit resistance . I have mentioned that I didnt expect much from Gold short term. Was that the DCL day 24? Or could it drop & do a stop run making a day 30 dcl? Tough call, Gold is oversold , but weakish. It needs a strong burst through resistance or it will eventually fall.
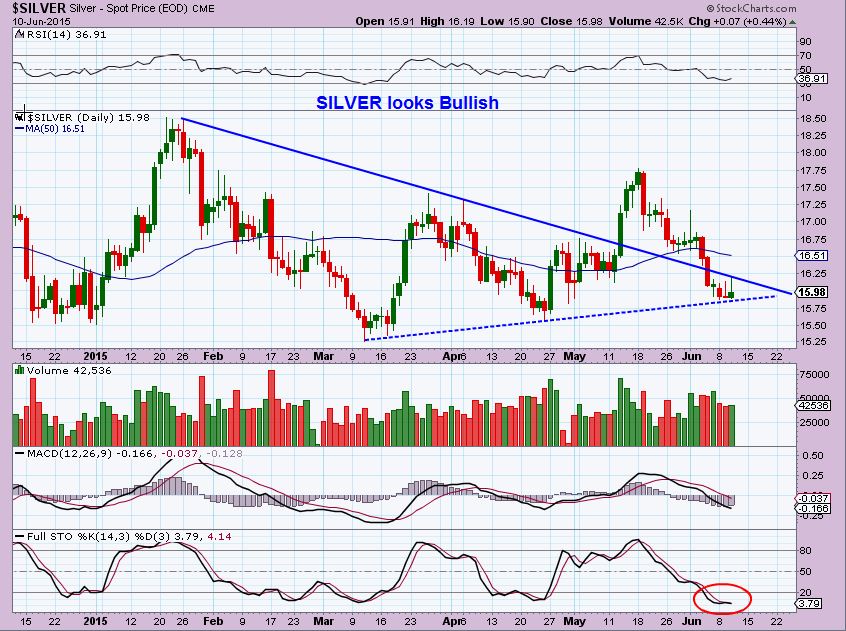
SILVER – That is an interesting predicament . Trapped. Today will be interesting since a small move will break this pattern one way or the other.
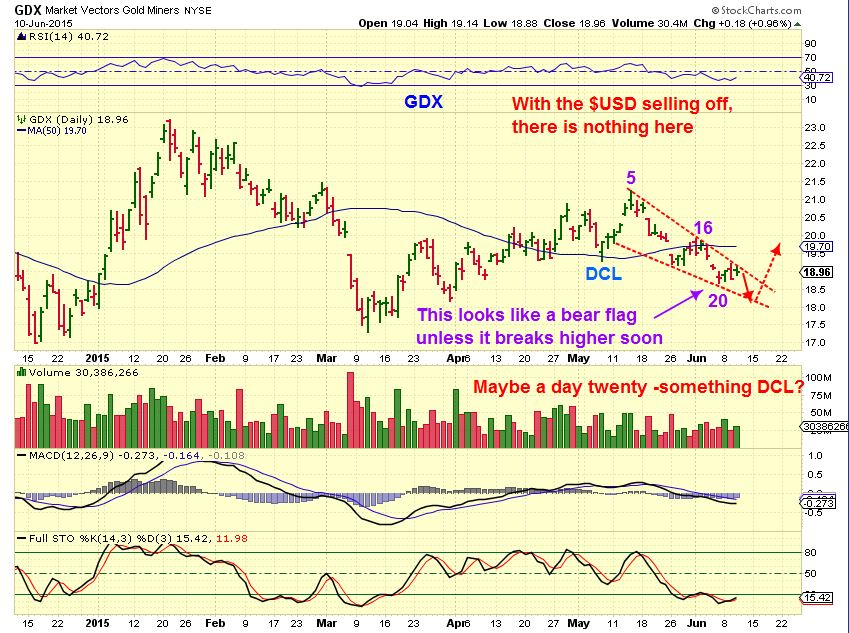
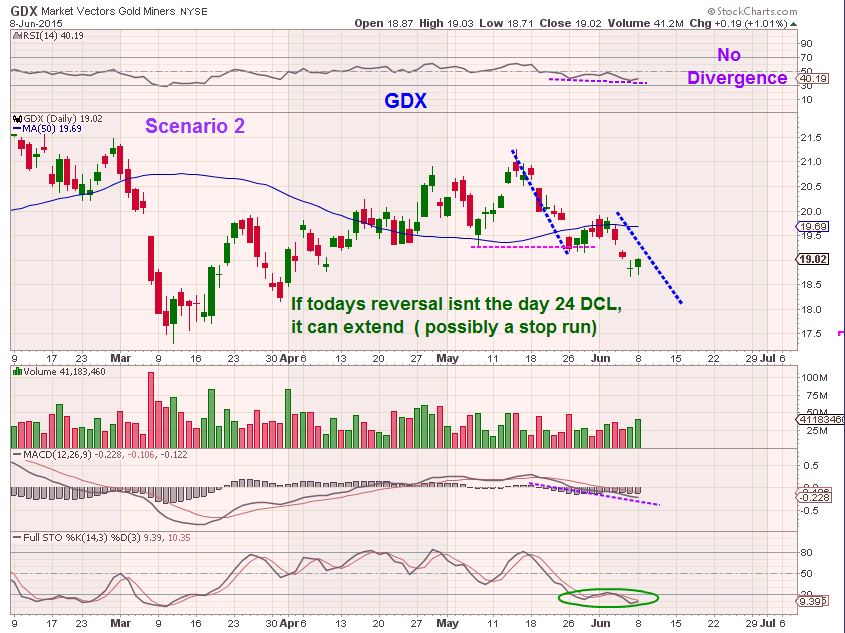
GDX – NEM has been strong but the did an offering and the stock dropped , locking GDX in this pattern. The Day 20DCL is likely too early, and this looks like a small bear flag. A drop below day 20 ( Stop run) would be normal to me.
I foretold that outcome with this chart so everyone wouldnt go leveraged long
The trading in the markets has been volatile and explosive with recent set ups. Oil and Natgas has played out as expected, but sadly some Energy stocks are responding well and some aren’t. I want to do 2 things here…
1. Show some interesting ‘set ups’ for possible trades. Some are energy, watch them if we do pull back today.
2. Show how some set ups that I have posted in the past played out bullishly. The reason for this is NOT to boast in any way, there are some others posted do NOT play out well. The point is , this is to show that these set ups can play out nicely, and with a low risk entry and a stop in place, losses are contained and gains can be healthy. It builds confidence when we see similar set ups later.
Here are a few interesting set ups-
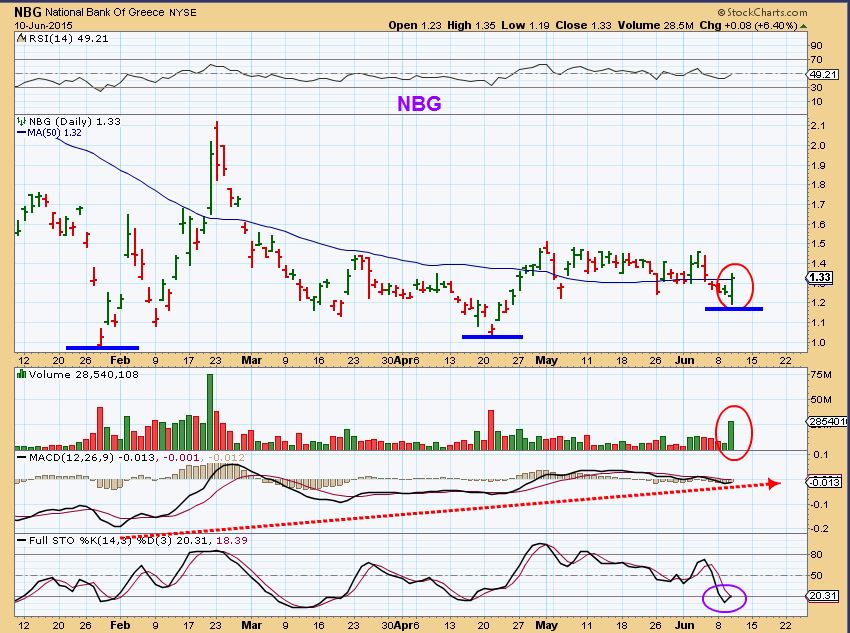
JD has been mentioning Greece and specifically NBG in our comments section for a while now. I think yesterdays set up is looking like a real move may come now. Bullish engulfing, higher lows, oversold, etc. (obvious Geo political risk, be cautious)
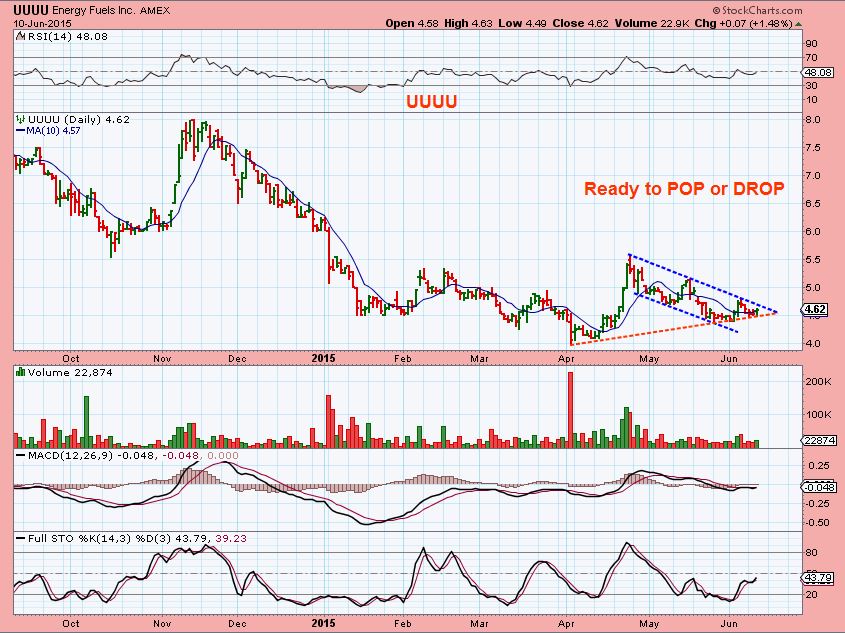
Check out URG, URZ, UEC, URRE, DNN, and UUUU ( Uraniums)
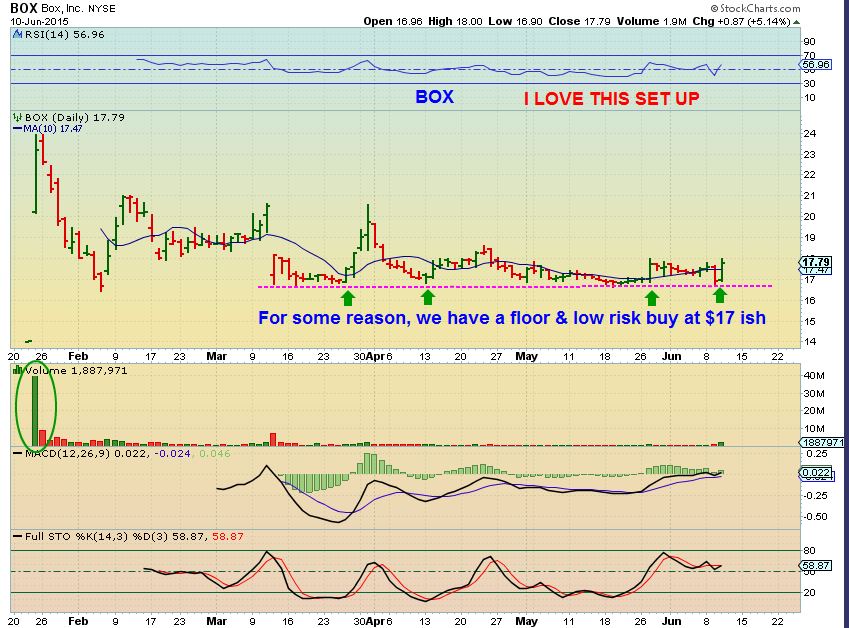
BOX– the reason this is such an explosive set up is that its new ( minimal overhead sellers) , and has a solid floor near $17 where buyers step in. This can be explosive and run fast without resistance on the left side of the chart
Experienced traders : See ETSY, MOBL, DANG, XNET for a few trade ideas
.
Some Energy thoughts-
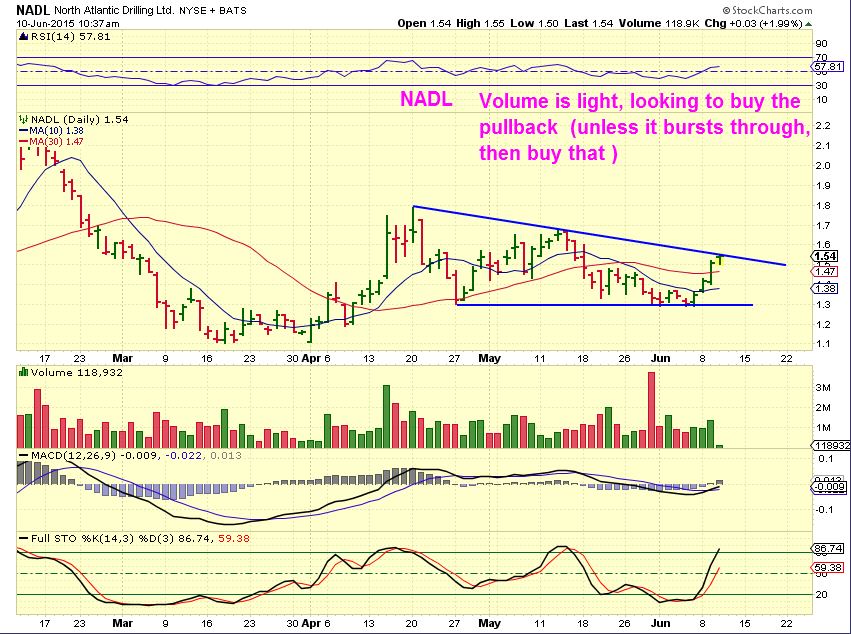
NDLE – watch to buy a pullback?
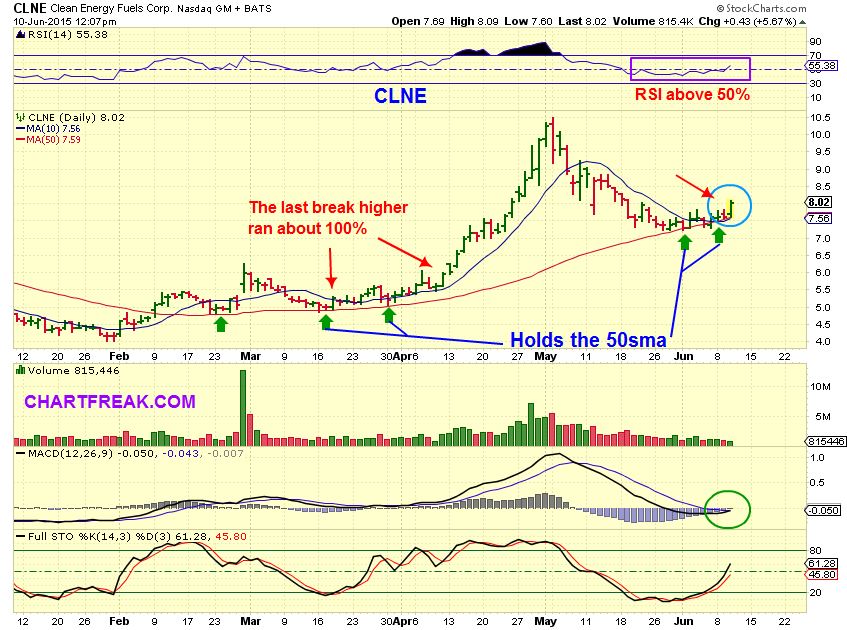
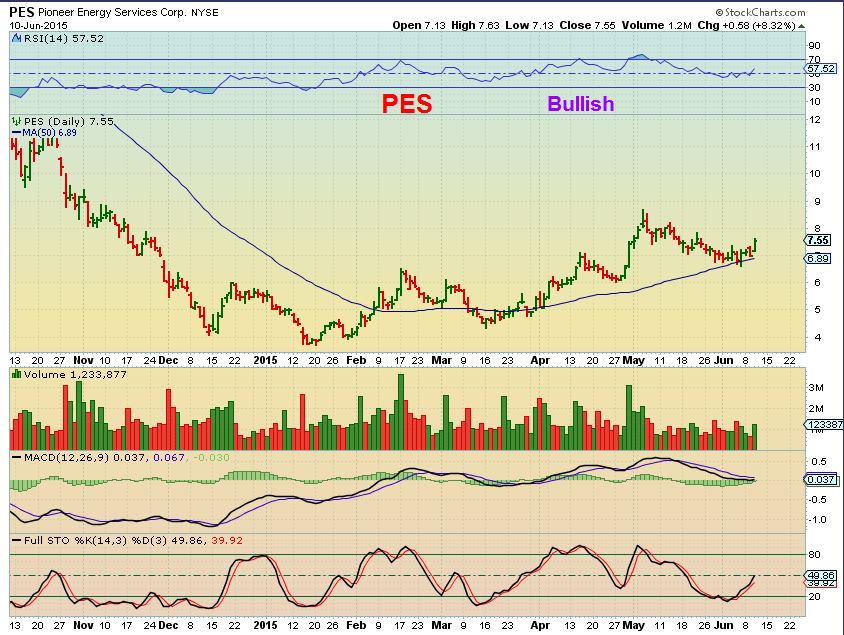
PES is acting very well. Higher lows and near recent highs. This is a keeper so far.
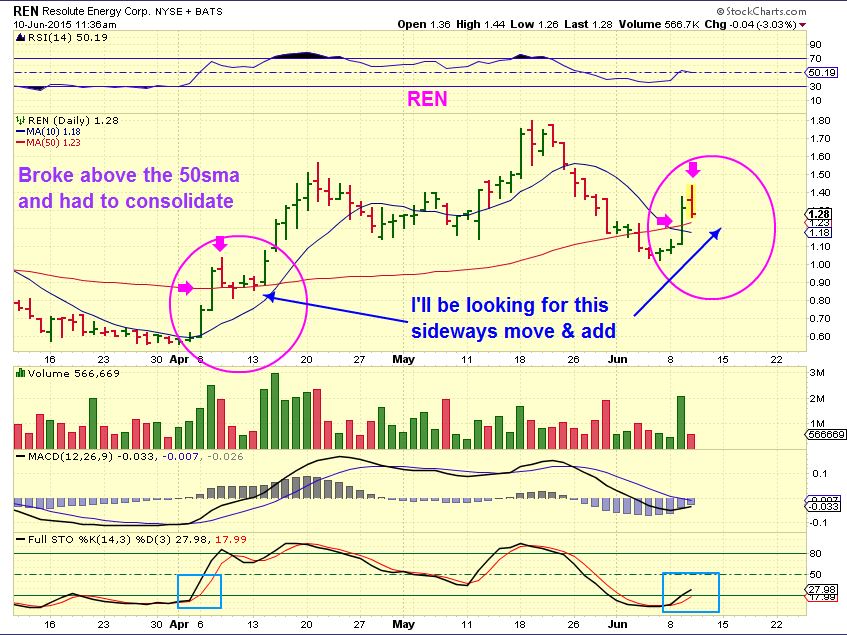
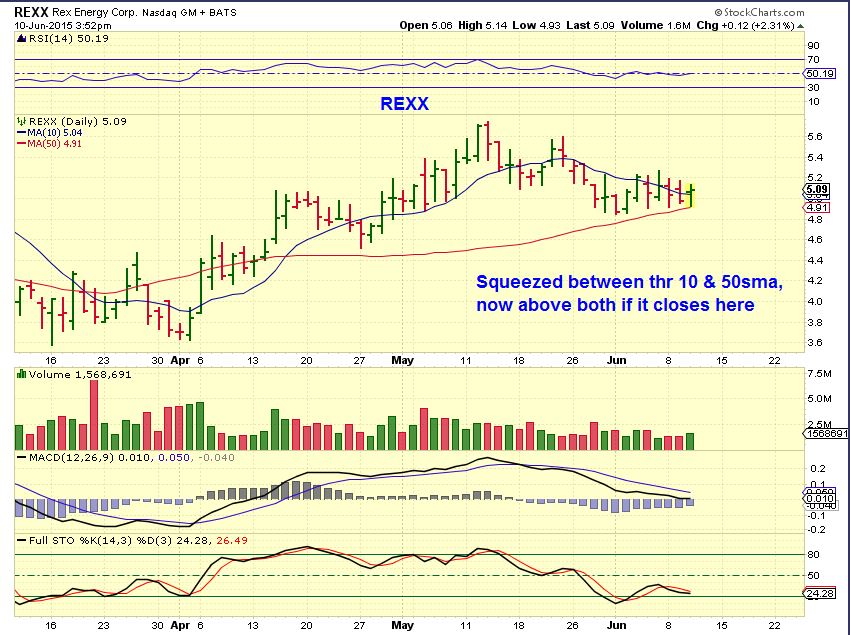
If oil pulls back, I hope REXX holds the 50 sma line. Also near recent highs.
Not Energy –
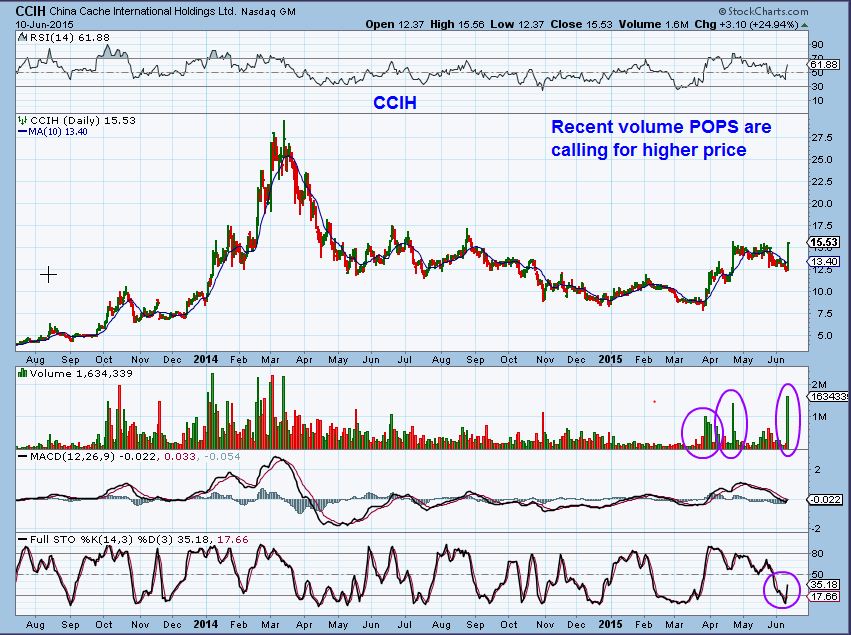
CCIH- Look at the potential. That small move recently was $7.5 to $15.53
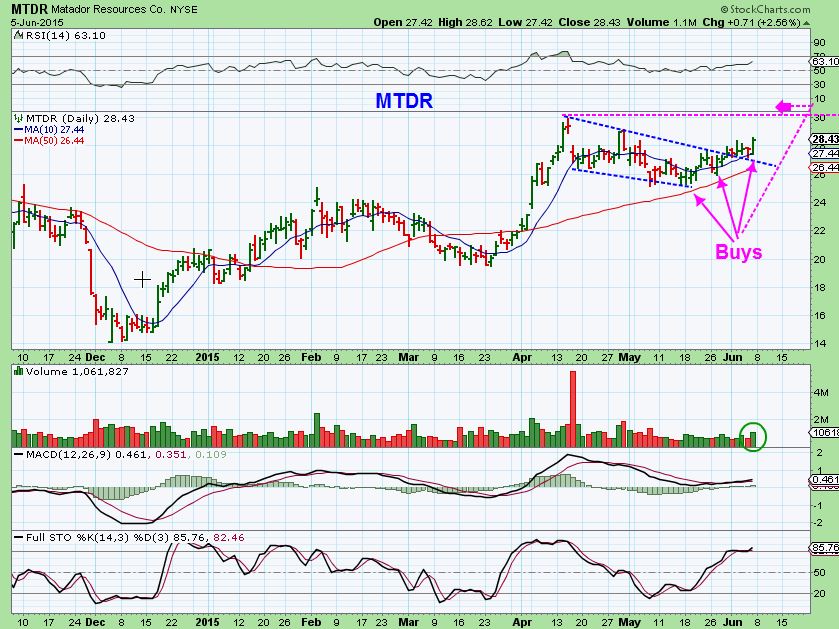
MTDR– reminder of an older chart. This has moved higher, acts correctly so far, and is still a good set up
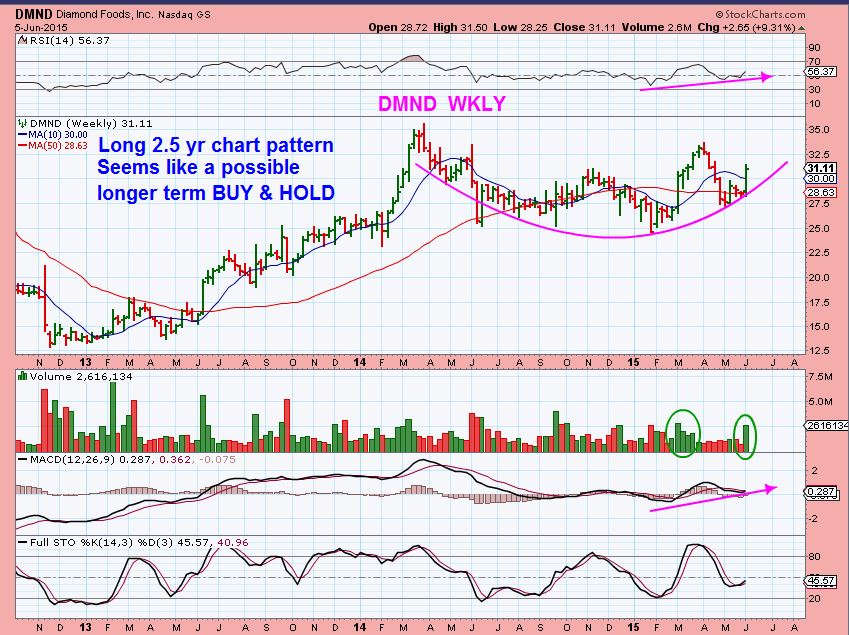
DMND WKLY– posted in the weekend report
Just a couple of recent Set ups that followed through-
.
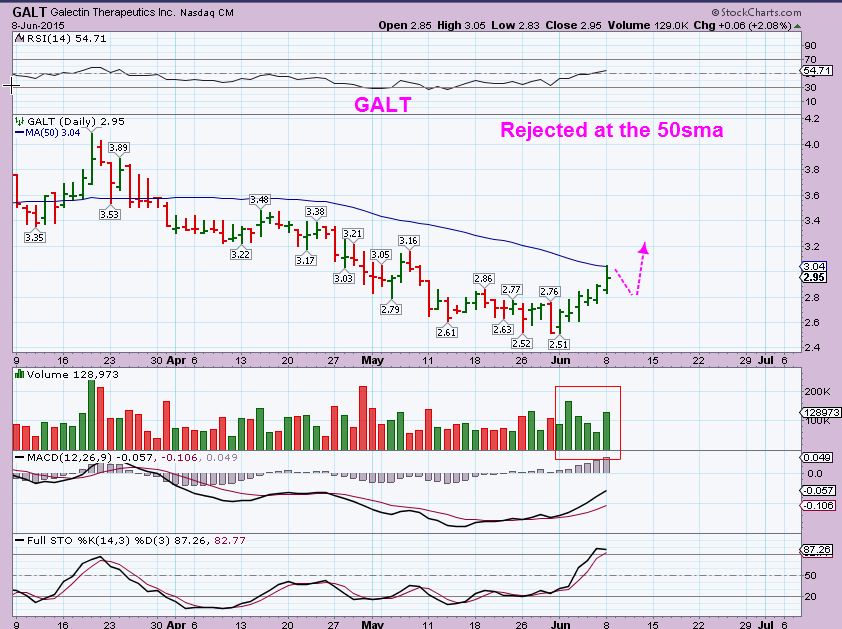
GALT JUNE 8- looking for a break higher, Volume was swelling
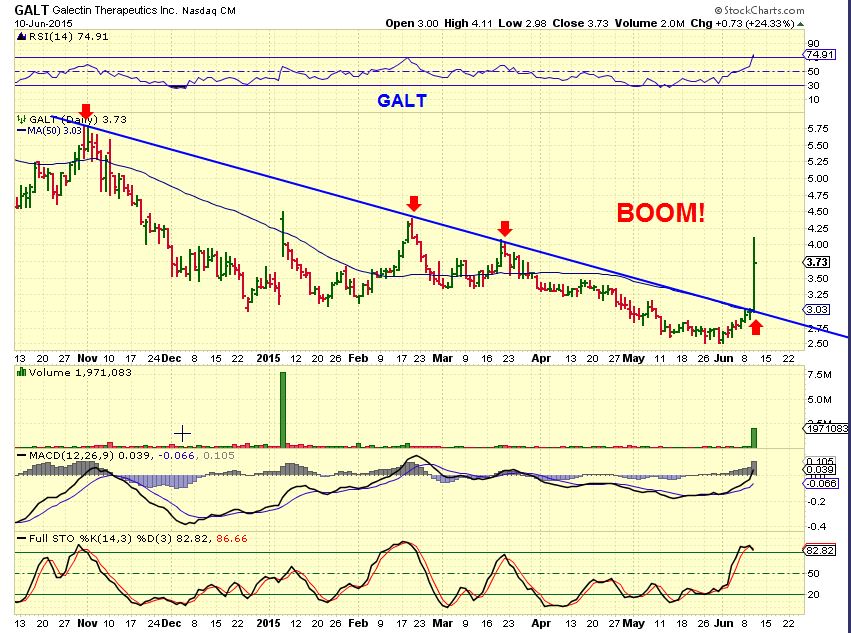
GALT 2 days later
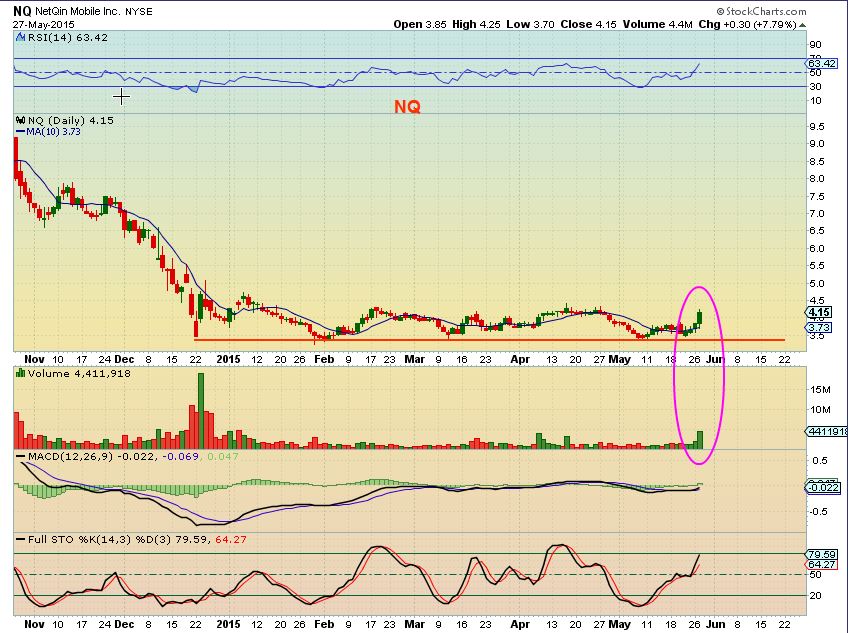
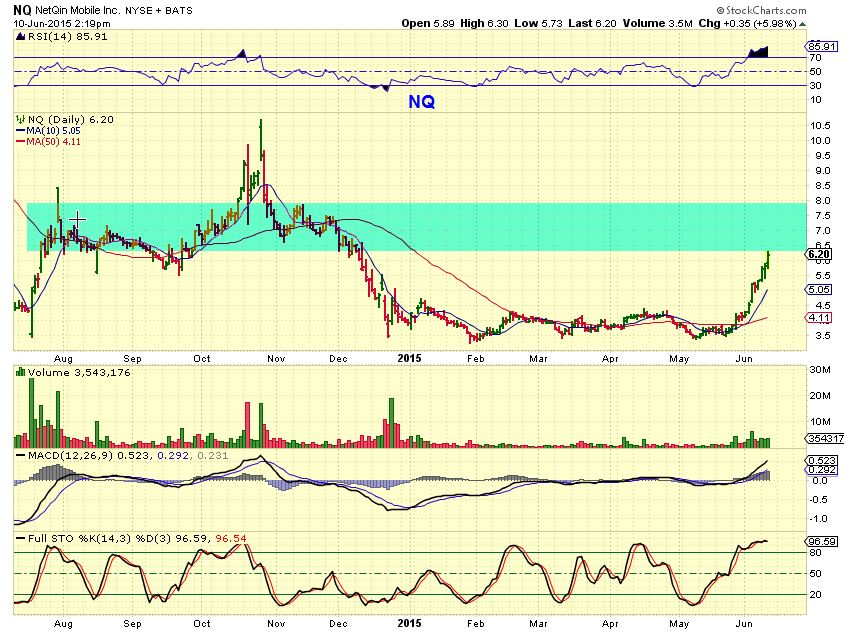
NQ – I love long bases with a volume POP. STUDY THAT BASE, it was NOT always fun. like SFY, GDP, NADL, etc…it was prone to sell off.
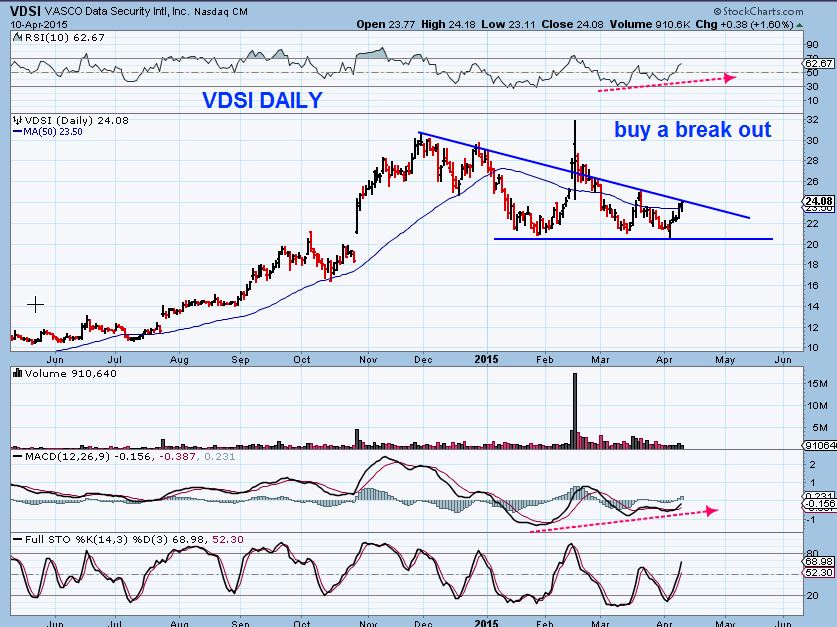
VDSK- Triangle pattern from April. Buy the break out ($24)
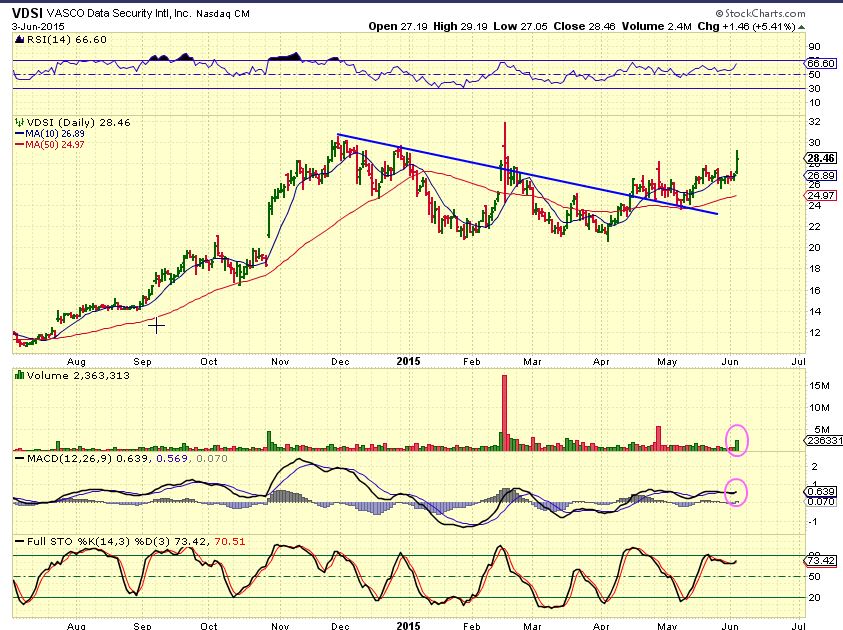
VDSI – $28 June 3, and now this pattern is bullishly aligned
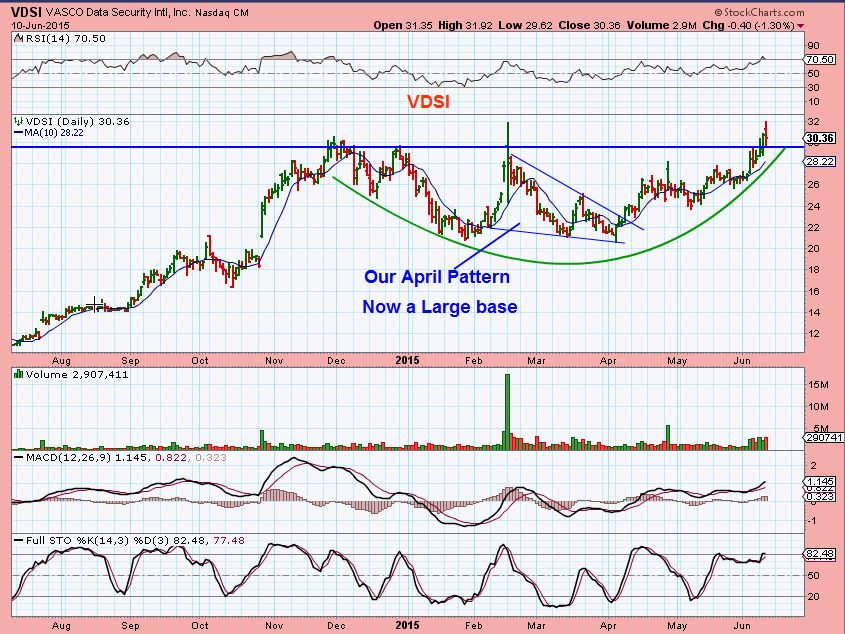
VDSI – Now is a large base . You can see how over time (2 months) some play out in a continuous bullish pattern, though there are pullbacks along the way. This has a $45 to $50 target over time
LESSON:
DSKX– I had been watching this STRONG healthcare stock, it doubled in a month! It had a long base, and I love those, but honestly – I didnt trust this drop all that much. It was scary & looked like a failed bull flag, but it did stop at the trend line. A reversal would be a low risk Buy at $2 .
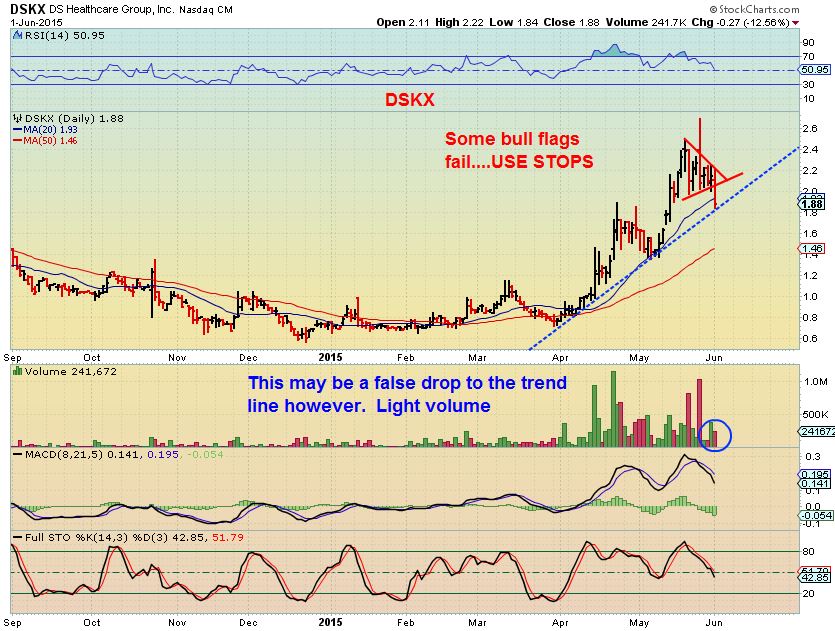
DSKX – has double again in 6 days since that June 1 drop. The Lesson for us starts earlier on ?
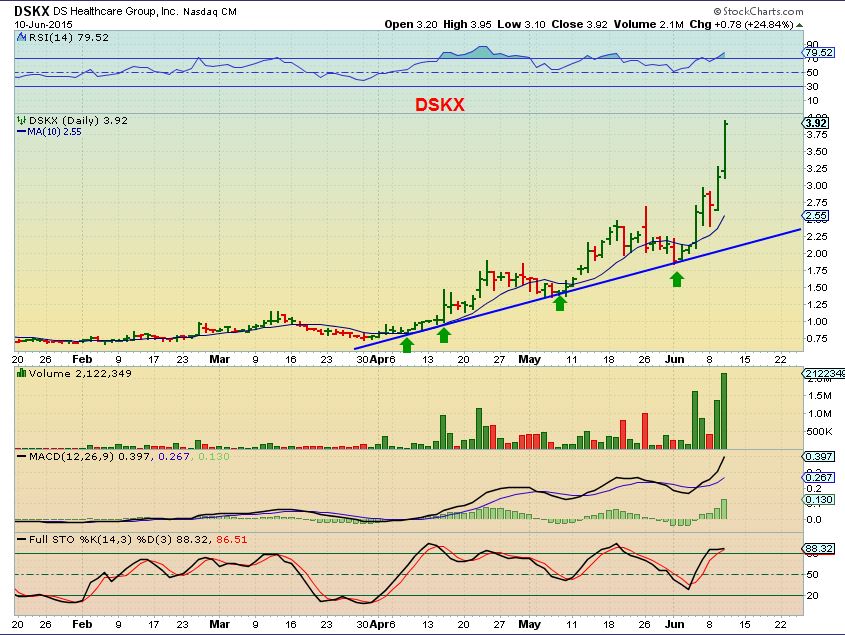
DSKX was one of those stocks that had formed a long strong base. STUDY THIS CHART BELOW
When we see those LONG BASES currently forming in Energy or Gold stocks in the future, the future gains may be special. If or when we finally break free and start an uptrend, it will NOT be smooth & steady all the way. Look at the sell offs within the bases. Look at the SELL OFFs after the base break out. The DSKX chart helps you to see why I love those set ups and in some I do not sell in the sell offs of a core holding, I add.
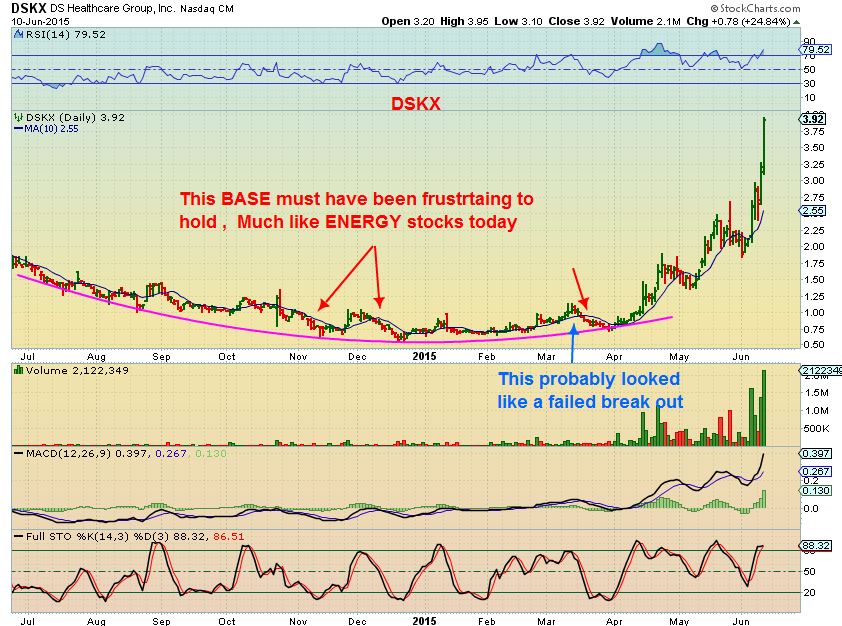
Exhibit “B”
You know how Thursday & Fridays go. Todays report usually covers Thursday & Friday and a weekend report will wrap it up and direct us into the following week. IF something unusual or different from what this report is expecting happens, I will update . Thanks for reading along and being a subscriber to chartfreak. My goal is always to try to share with you something that will help you now and even more so, many years from now.
~ALEX


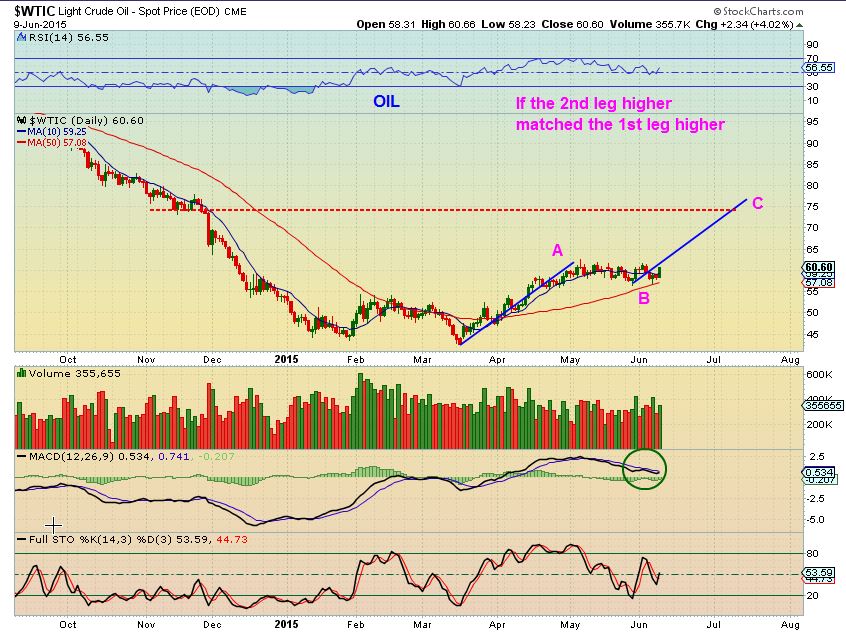
CF you’ve been writing about potential multi year rallies in some of the energy stocks. Yet Oil is expected to top out at 70/80. Or is it your contention that it will not top out and majorly reverse (tp below the March lows) and in fact end March was the bottom in oil a la 2008 in the late 30s?
I have read others feel it is just a bounce, I look at the 2009 drop / recovery in oil and it was basically a V-Bottom. I dont really expect anything different this time.
Refresh for my old chart that I posted in March. Look at the left side and picture that on the right. SO FAR, it is a twin
Many thx as ever
..yup yup and nice.. dang. :o)
As for #2 — ohhh go ahead and toot your own horn CF you deserve it ;o)
Anddd can I just add not only does this build confidence, BUT even more importantly, seeing chart after chart after chart pattern play out (speaking for myself only of course) ;o) subconsciously reinforces the fact that there truly is indeed “always another trade” & the monster within -shall I say – pretty much gets smothered to death… death by charts?? LOL
I cannot tell you how much that fact alone has helped me morph into an entirely different trader. Gone are the days that I spent chastising myself for missing a trade or selling to soon, or .. (insert any negative self-talk your inner demon may prefer)
for I no longer have to worry about such trivial things again because ……………………….
“THERE”S ALWAYS ANOTHER TRADE” … by golly …THERE TRULY IS!!!!! … all you have to do is pull up any one of the bazillion charts on the watchlist & go to town… woo hooo!!
Bravo chartfreak…
By Golly? ;-D)
ha! well originally I had a curse word there.. but backspaced that thing away.. ;o)
That is a funny Gif, didnt see it until I refreshed.
you like? ;o) it PERFECTLY surmises how I feel … mind you, I often hit bumps that FLING ME completely out of the car, but I brush myself off and jump in and fire that mother up…….(as Charlie Daniels would say) https://youtu.be/952h-AJ3Bcg?t=15
Exactly Mria, Been there , done that. Like you said – Seeing how set up after set up can play out, you dont sweat it so much if you miss one or sell early ( well, I hate that I see early at times , like CMCM and MNKD for example), but there is going to be another good set up if we can just be patient enough.
Thanks for the above
Silver — if that trendline holds… it’s a TEXTBOOK “E” woo hoo HiHo Silver….
https://www.tradingview.com/x/l7zgSuJS/
I have a pattern that is uber bullish for GOLD too, but it doesnt match cycles timing at this point.
I would love to see it. I don’t see anything positive with miners or Gold.
And Amen.
Nice chart Maria!
welll… not sure.. we shall see soon enough though :o) if not .. its “back to the drawing board” for real ;o) Tee Hee..
ps. Yes, my fingers go that fast, and
pss. Yes – i really do dress up in a superman costume
Nice chart. Is it going to hold?
here is my “novice” take:
here is the 2hr chart on SLV… notice that “E” subdivides into a “3” wave…. also notice that volume is Declining… this is “good” news because if it were going to break down.. then it “SHOULD” be a “5” wave – an “impulse” wave slamming down with increasing volume/power — hmmm …
well – that’s just my humble, novice take on it … we shall see though.. markets always like to make us the fool and I seem to courageously step up to the plate every time… lol
https://www.tradingview.com/x/nmwU70DD/
Nice chart! You’re an Elliot expert.
OH PLEASE…..I just started in LATE April.. hasn’t even been 2 mnths .. LOL
I have a LONG LONG LONNNNNG way to go before I can add that title to my (albeit long) list of nicknames.. (wink) ;o)
in case you care, here is how it looks on the lonnnng term chart – but SHHHH don’t tell anyone being a novice In all – I’m shy about this count ;o) … https://www.tradingview.com/x/fom3JFb3/
You think the bottom is in, Maria?
oh my… noooo … That is far far above my pay grade — that’s like up there with CHARFREAK type PAYGRADE.
FWIW: That long term chart is one I’ve been working on for a while now — and the reason for the post is really twofold:
1. Im a truly beginner (not being modest) looking …hoping.. begging?? lol for feedback; and
2. I can only count the waves that are present on the chart.. ANND since the waves only show up in my charting software as far back as 1990 I must begin counting waves there.
BUTT… Since you asked, — I do have an alternative count (still bullish short term) that puts silver in an ABC correction and just beginning C up which ends at top of channel, before beginning a larger leg down. I always try to have at least 2 different counts available at any given time in case the pattern/structure changes, I have the other lifeboat standing by at the ready to hop into… ;o)
I dont’ know if that helps??? here’s the alternative count..
https://www.tradingview.com/x/P31jlq59/
Thanks for sharing. I’m a little familiar with Elliott Waves but not enough to put my own counts together. Longer term cycles and Fib levels based on 2008-2011 bull cycle starting to coalesce with daily cycle theory (CF) for potential low late summer Aug-Sep. But that’s just 1 Theory/possibility. Silver continues to sell down any time it rallies even a few pennies so hard to get excited about it right now.
I meant to put in my report IAG and AKG as Miners that look to be breaking out of bases while Gold/Silver do nothing.
.
No buy recommendation, but AKG looks sweet and goes on a watchlist
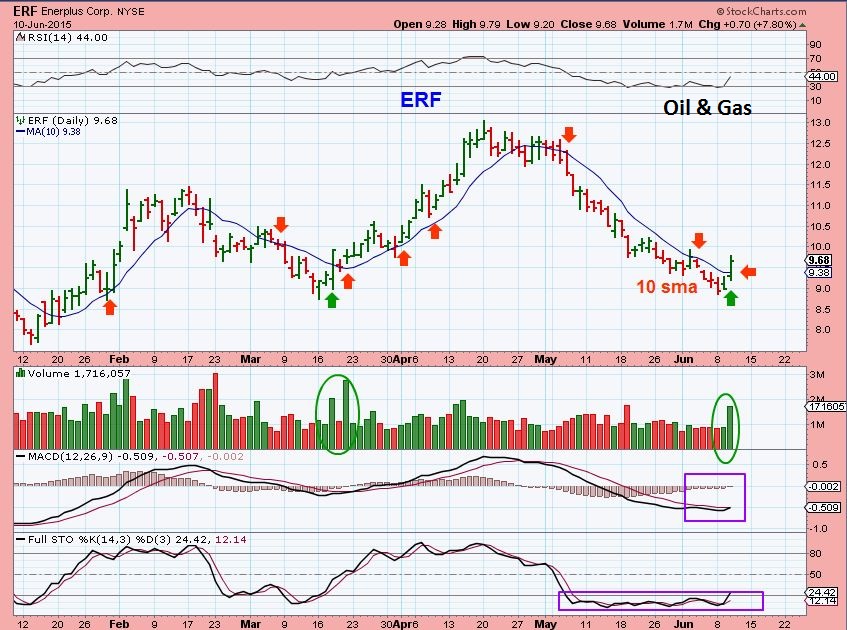
There goes ERF, BOX, DSKX, DMND, from todays report. ( I own none of them 🙂
Interesting charts todyay : LITB,, MOBI, SIFY, FENG, DANG, JRJC,MBLY, LEJU, EJ, JMEI ( good set up)
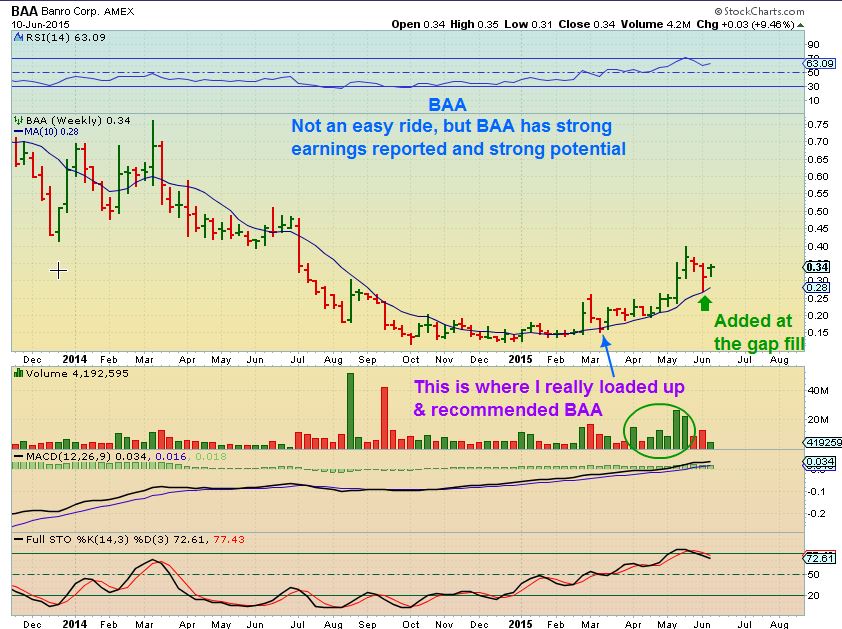
BAA
REXX and CBAK both under their 50DMA. Still holding them but may cut back on REXX if it doesn’t show some strength soon.
I’m done with REXX. Extremely disappointed. Had lots of promise. Failed me completely.
Alex, looking to soon add back piece of crude that I sold yesterday but from chart above looks like might still expect selling tomorrow so today is not the entry, right?
I’m done messing with REXX, looking to sell now into any strength. She let me down.
Gold/miners tough, certainly no reason to go long but haven’t seen a great short setup yet. Looking for one but it can’t hold a bounce long enough to even go short!
Some of my stops got hit, im waiting to see before I get back in. FWIW
Thanks, Bill. Saw your comment. Decided to wait to see what tomorrow brings. I lightened before yesterday’s oil storage report by design.
I’ll look to buy back in today on any strength in oil, seems unlikely right now. From head only (going in to work now), gas near 38% retrace of recent move, good spot to add back?
Hi Cason,
Actually, If you go back to the OIL chart and read what I wrote right above it, that may answer your question.
I expected a small pullback, not necessarily a “SELL” with the reversal candle. I mentioned 1 or 2 day small pullback. We saw that today and it looks like it i recovering.
Yeah, question withdrawn. Was really debating with myself if midday today or tomorrow morning was the buy. I expected a pullback today (even before reading report). I lightened load yesterday and am looking to buy my own shares back cheaper 🙂 we’ll see what tomorrow brings.
Looks like REXX had news on their sites out this morning. Obviously, not we’ll received. I can’t overstate how concerned I am about the disconnect in the stocked for the oil and gas commodities. A day or 2 is one thing, but this is very disconcerting.
Sell until you get clarity whenever you say to yourself,
” I can’t overstate how concerned I am about the disconnect in the stocked for the oil and gas commodities.”
I go by my Gut Feel often if things I know are not following through
Good advice, will take that today, thanks!
Alex,
Do you have a list of stocks that you holding as a long term / short term investment?
I’m a new subscriber and not sure if you do have a portfolio somewhere on this site that is been updated as you taking the trades.
Thank you.
Hi Alchi,
No , I’m sorry for the confusion on that.
In the past I had referred to a retirement account type of longer term BUY & HOLD investment. I was asked what I would be holding as a buy & hold. It was based on good fundamentals and being in an established uptrend and at that time I mentioned Under Armor ( UA) and said that a few others might be MCD , NKE, etc.
When I am discussing BAA, I am discussing a long basing pattern that I started accumulating for various reasons a while ago. As long as it remains above the 10 WMA ( Weekly Moving average on a wkly chart) and trending higher , I add on the dips, if it closes below the 10 WMA that would be a sell for me. I would watch to see if it recovers at that point.
SFY getting boring and working on its base for low risk accumulation. Perfect!
was $48 in 2011!
refresh for chart.
nice… like I tell my son … “if your bored, go do pushups” … but leave your “stock” (insert subject) alone!
(providing it still meets all the criterion for the buy of course) 😉
Nice Maria!
my son is intrigued by candles and charts and will learn very soon (he’s 4).
Alex….. are you shorting GOLD at this moment ???
Larry Edelson give us advice to do so.
Thanks my dear.
NATGAS taking a breathing. Time to re-load?
Or wait one more day. Alex, your thoughts?
UGAZ likes to launch from $2.23-$2.27 area.
NATGAS chart attached is from yesterday and we’re at the line now.
Tough call since UNG and UGAZ have gaps below.
When you say re-load I assume you sold yesterday because we had a NATGAS report today. In THAT case, if I personally has no position, I would take a s partial position now expecting maybe a UGAZ gap fill ( it doesnt have to ) and add more on a dip tomorrow. If it bursts higher maybe add more because you are correct. Its tricky trading the wiggles, everyone has their own method.
I expect higher NATGAS prices.
Thanks Alex!
Correct, I sold 1 min before the close yesterday :))))
Took partial postion today.
I understand the risk but NATGAS will be higher in the months to come.
Bull Flag looking on the 4h chart on UGAZ.
Nice trade – I figured that Thursday report would be a good reason for some to step aside.
REN down with the quick sell-off?
$1.18 has been a support area.
Watching it….see the 10 sma
GDX – everybody expect $18 (which works with Alex’s model).
will it bounce from here? tough one.
won’t touch it until up-trend is confirmed.
UUP looks ugly. Will/Should help $GOLD.
agree.. it can EVEN go as low as 17.26… (if my count is correct)
I’m staying away until I see B complete…could be anywhere in that blue box — just has subminuette V left then… rocketship time…
https://www.tradingview.com/x/lTsJMJuz/
Well, when it is time, just let me know!
REN dropping under 50SMA into close
Well the picture from this article certainly didn’t come from my portfolio. Unless you go right to left. Really got kicked in the teeth today, UWTI was one of my best performers. Ouch. Stopped out of TLT yesterday to watch it rise from the dead today. That was awesome.
Well waddya know TLT will make a seriously bullish weekly candle tomorow probably.
Was on the cards since last week. Stochs have a long way to go up. Next stop CFs $127 resistance.
Gold priced in Euros have been leading gold priced in $Dollars. 1050 gave way the other day. We made a backrest yesterday just like $dollar gold broke the trend line and has been retesting it. Shown in Alex’s chart. However $Euro gold can’t seem to make it above 1050 tonight. We’ll see but I am staying out unless we bounce to the 50sma which I’ll short or we test the 1250’s low area which I think is going to happen then Ill look for a mid June rally into July for about 4% return and back to that trend line break. From there and seasonally speaking is when we get the larger drop which breaks the 1240’s to ??? But sets up the big yearly win for 15-20% rally off the 150 day ma We’ll see.
Alex, I meant to say 150 day cycle not 150 dma…..excuse me. Have a good weekend….UGAZ pull back lining up per your chart idea….Thank you.
Thx Shermo
ALSO OIL is backing up to the 10sma, may be a buy for UCO, USO
Euro gold has been leading Dollar gold recently. the 1050 number was breached and since then Euro gold has come back to retest this level. It is having a hard time to get above it. See how important this number is to Euro gold.
http://goldprice.org/gold-price-euros.html
Annoyed stopped out of my fro, now back to where it was before. Sold right at bottom.