Running With The Bulls?
The DJIA, SPX and NASDAQ have basically been in a sideways move through most of 2015, as seen in the chart below. Despite the sideways action, there have been many Bullish set ups and even Bullish action in some of the beaten down sectors . The good news is that it doesn’t look like it is about to end now. Lets look at some charts and discuss this further…
DJIA- Jan -May was rather sideways
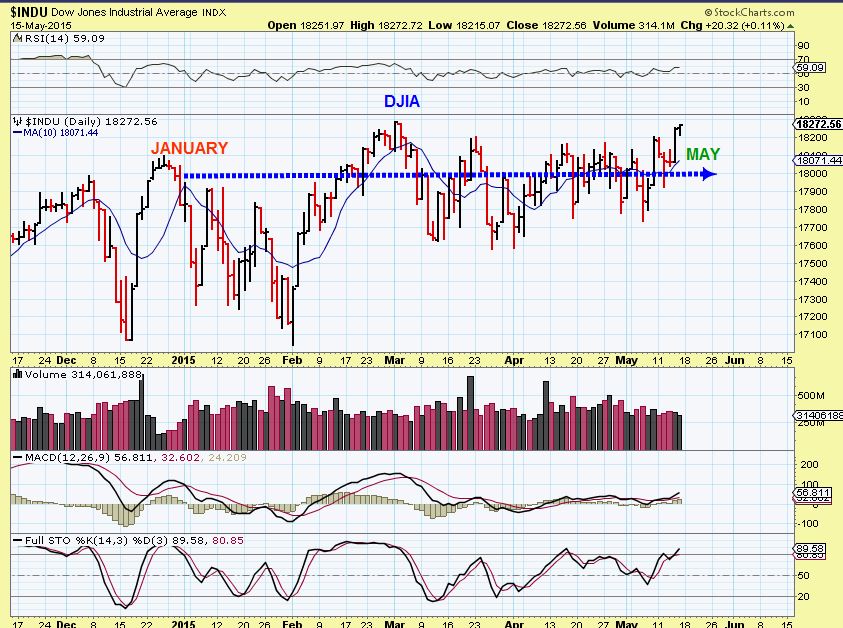
We have discussed sideways consolidations in the past and how they can lead to some nice trending moves when they finally break free…
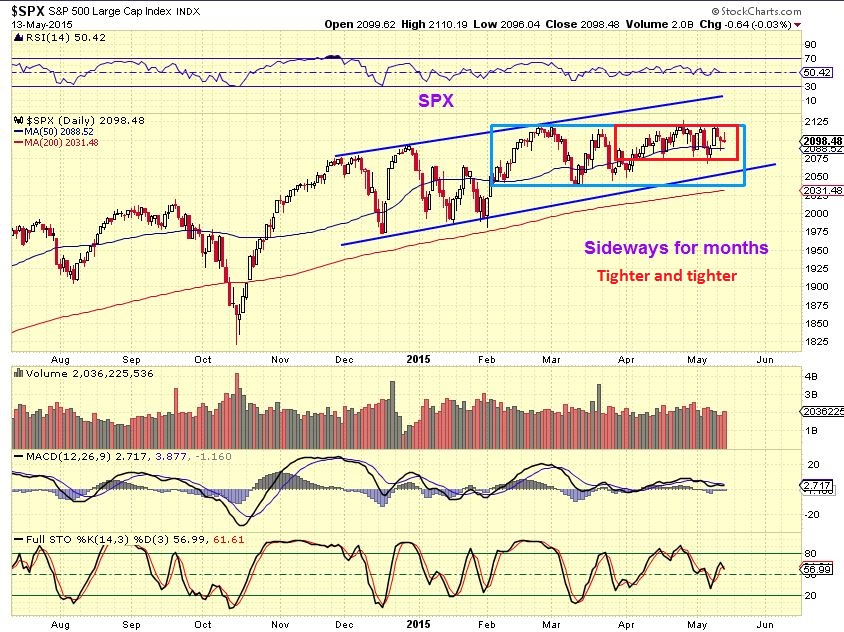
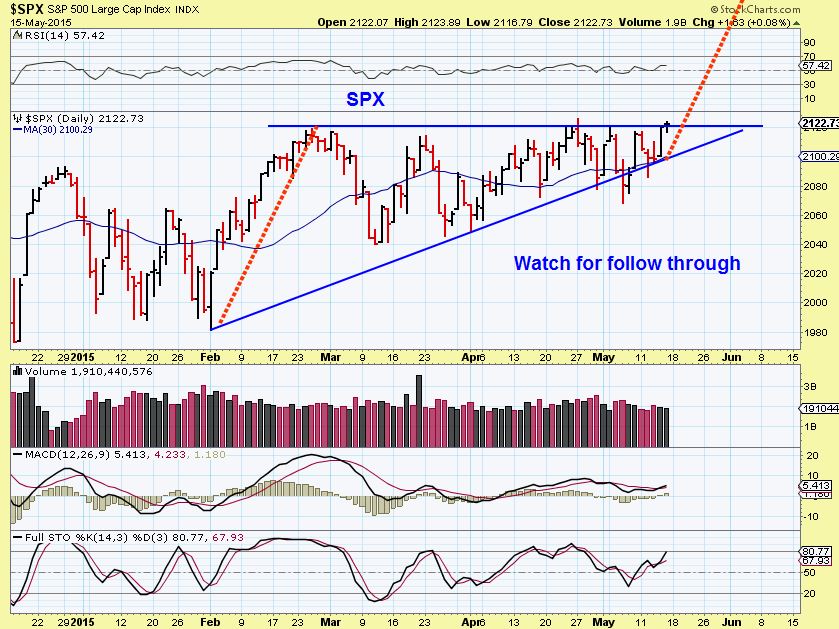
So on May 13, I pointed out this sideways consolidation in the SPX , and how it also could be viewed as a sideways move in a rising channel
May 4 – I saw this bullish type pattern forming (not as much of rising wedge)
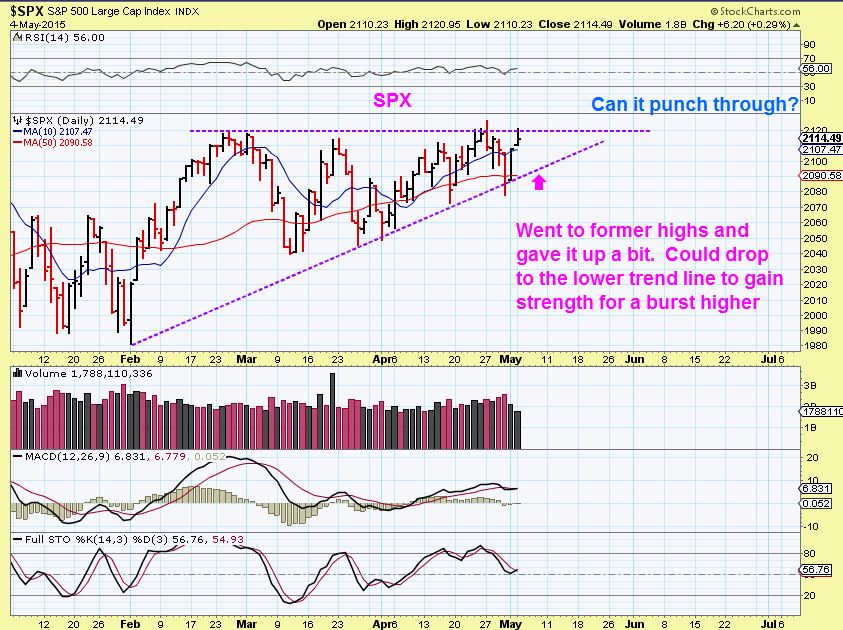
After this weeks close at the highs, It looks likely that there could be a break to the upside. The run higher after this consolidation could be significant.
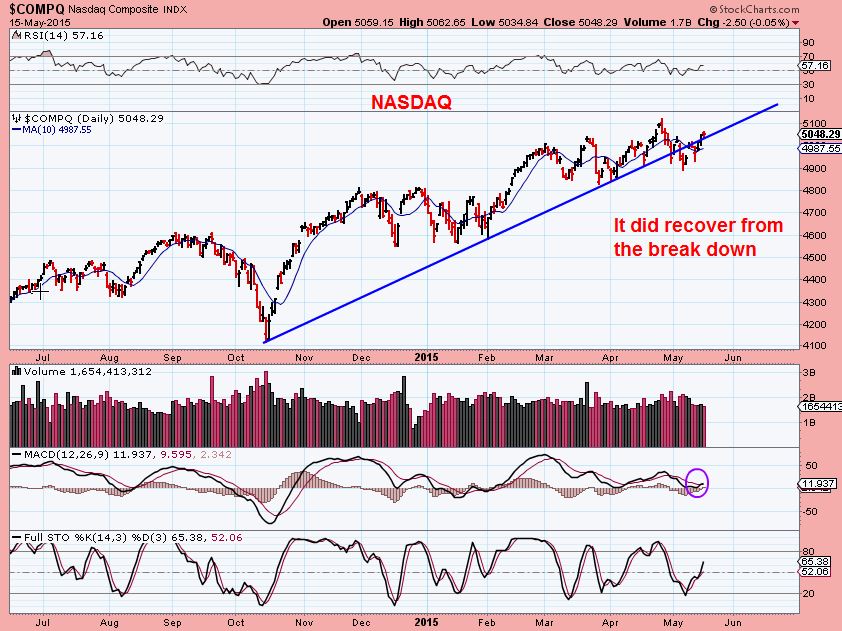
The NASDAQ broke down & recovered so…
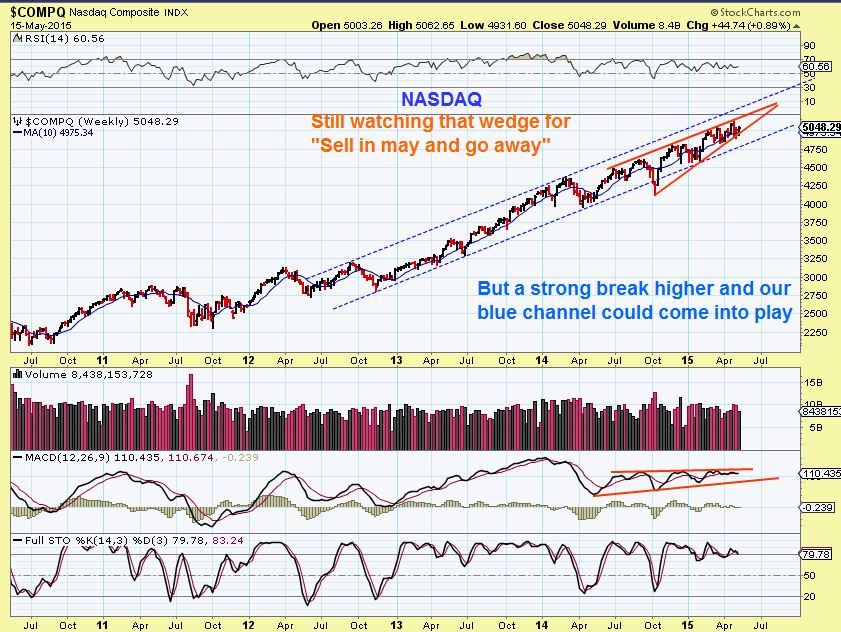
The NASDAQ WKLY also has a bullish look to it. I’m still eying this Wedge pattern, but if it breaks ABOVE the wedge, there is more upside. This is a long consolidation.
I have been bullish on the Commodities lately. OIL, NATGAS, the CRB, Metals and Miners have traded well. WHEAT ( see ETF WEAT) Popped last week and Sugar and Coffee also look good. The dollar is up $0.50 this a.m. and Gold,Silver and OIL are also Green, so that is encouraging.
.
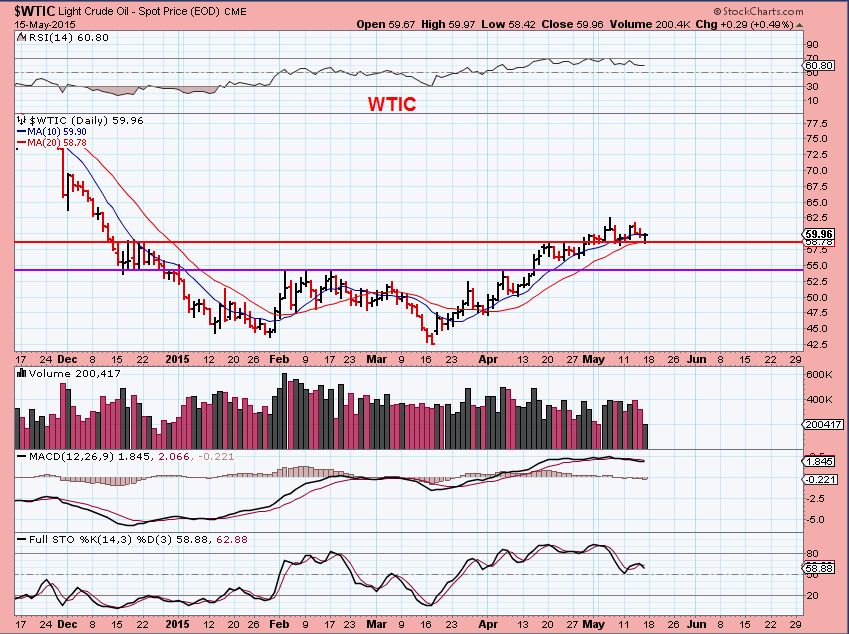
OIL – Still Bullishly climbing higher, with small dips & sideways consolidations as expected
XLE MAY 5 – As for Energy stocks, I posted this . We expect dips for the move to remain healthy, so I figured a dip to the 50sma (maybe sideways) would be possible.
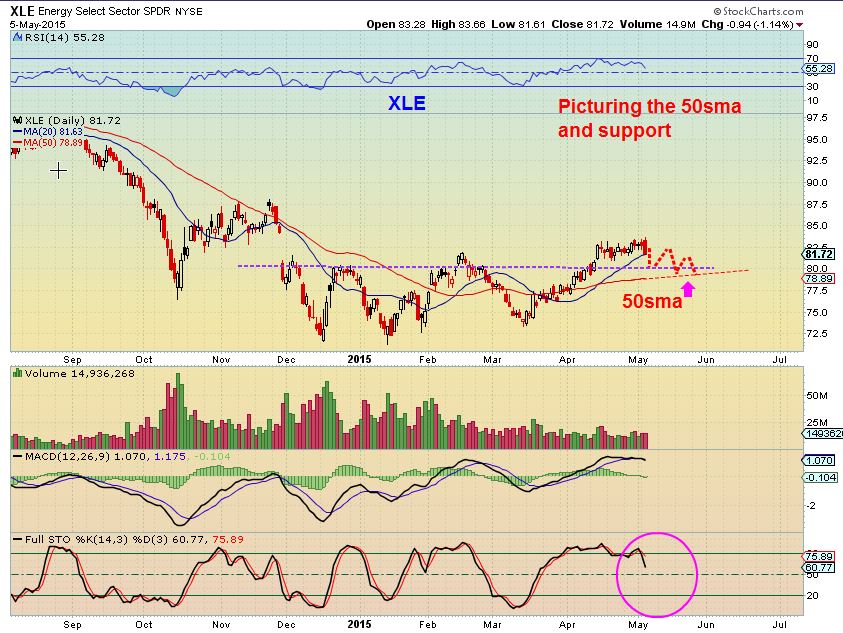
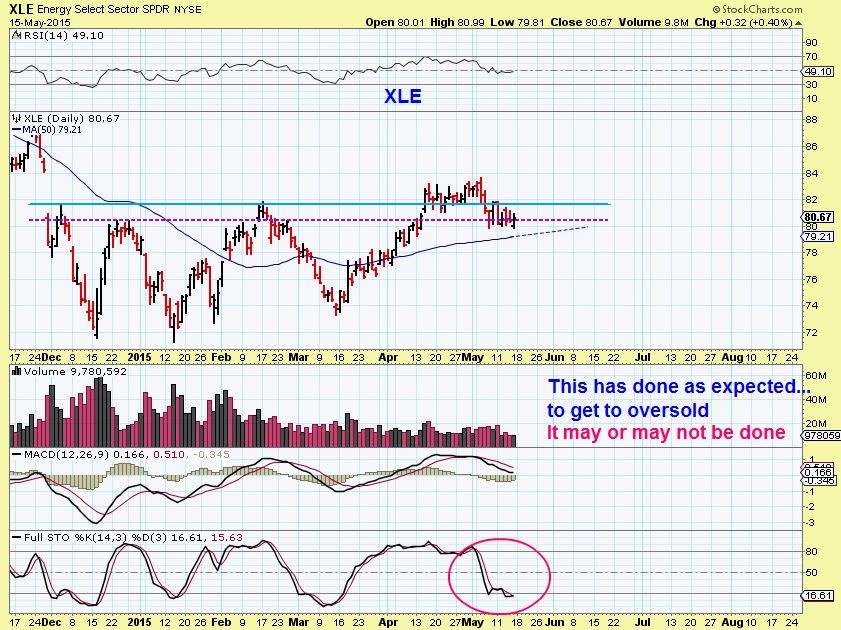
XLE is doing just that, working off that overbought situation in the chart above ( Magenta circle)
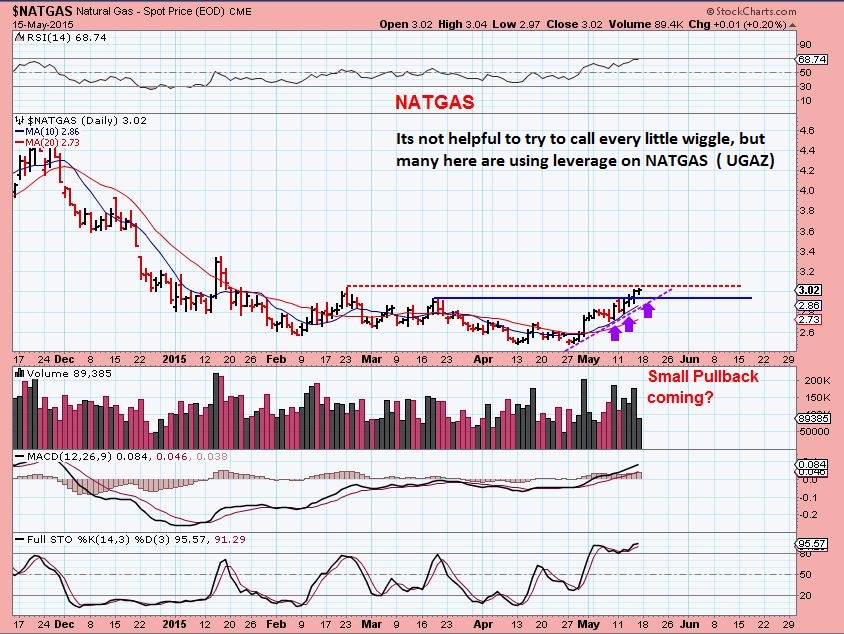
NATGAS: I dont like to try to predict every drop & every surge, I want to just say that it is still a bullish set up. Many here trade this with leverage, so just realize that drops will come and that is normal.
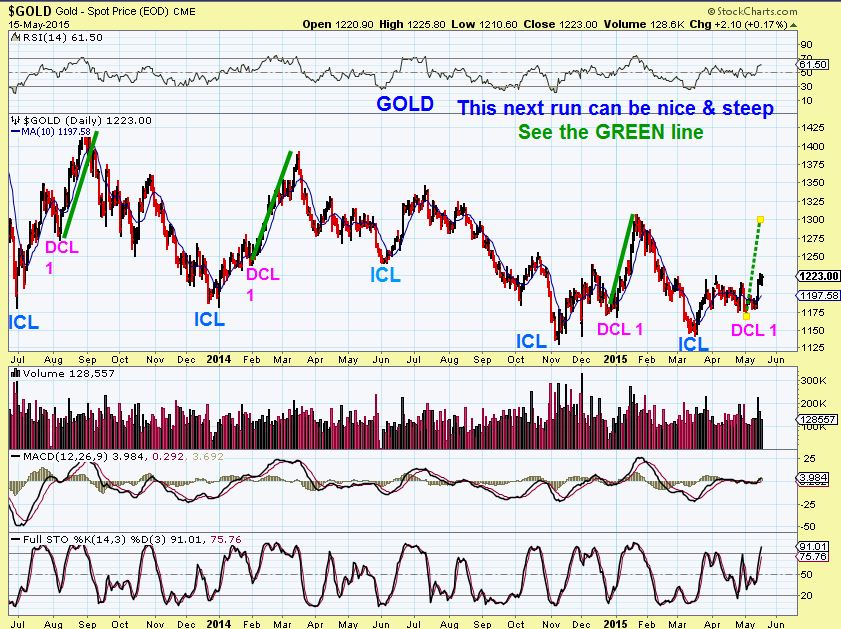
GOLD- I expect more upside. Gold surpassed the prior cycles highs.
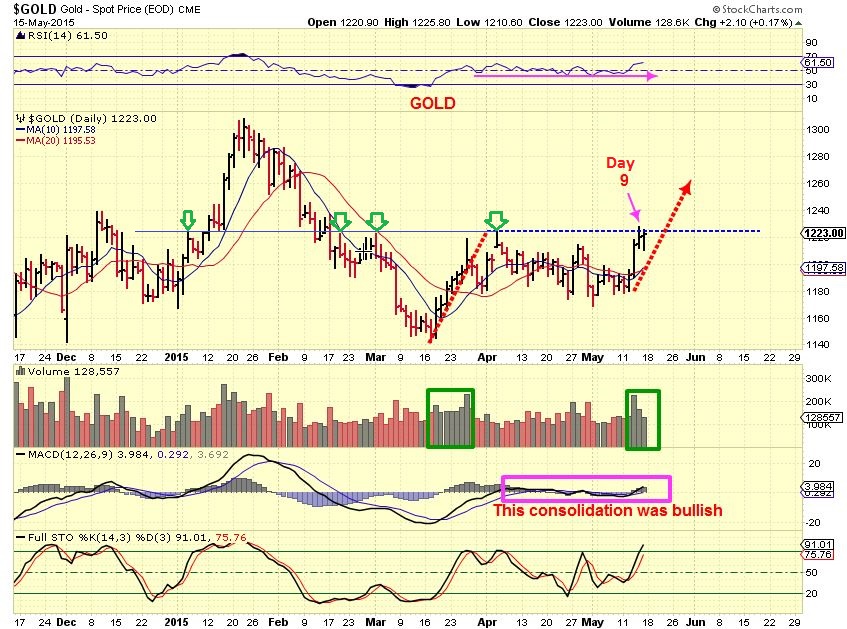
Gold has its Daily Cycle low in place and this next run can be profitable (Green Line). GOLD has a Higher low than the last ICL in Nov. A higher high above January’s $1307.80 would be very bullish! It could indicate the end of the Bear Market in Gold of the past few years.
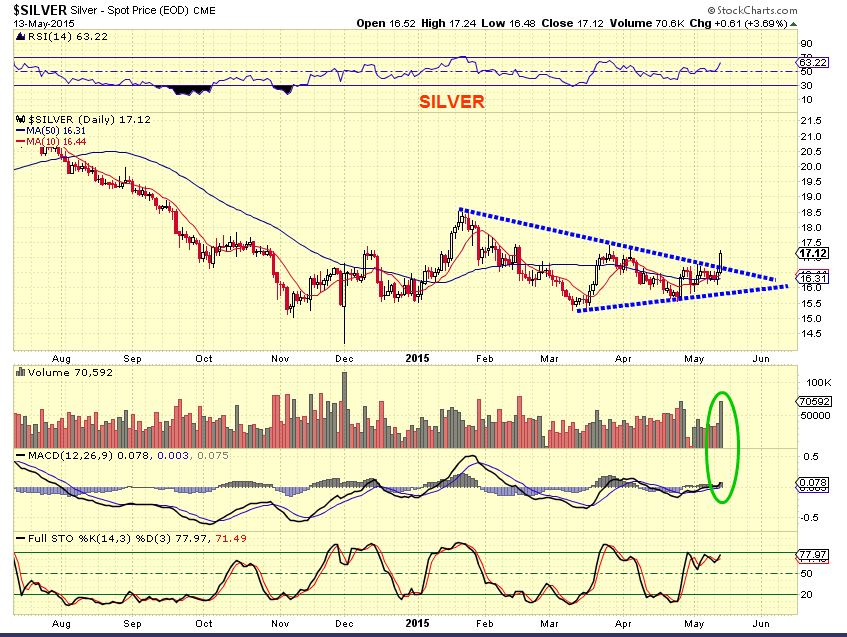
SILVER MAY 13 – We got our break higher for a bullish move, but…
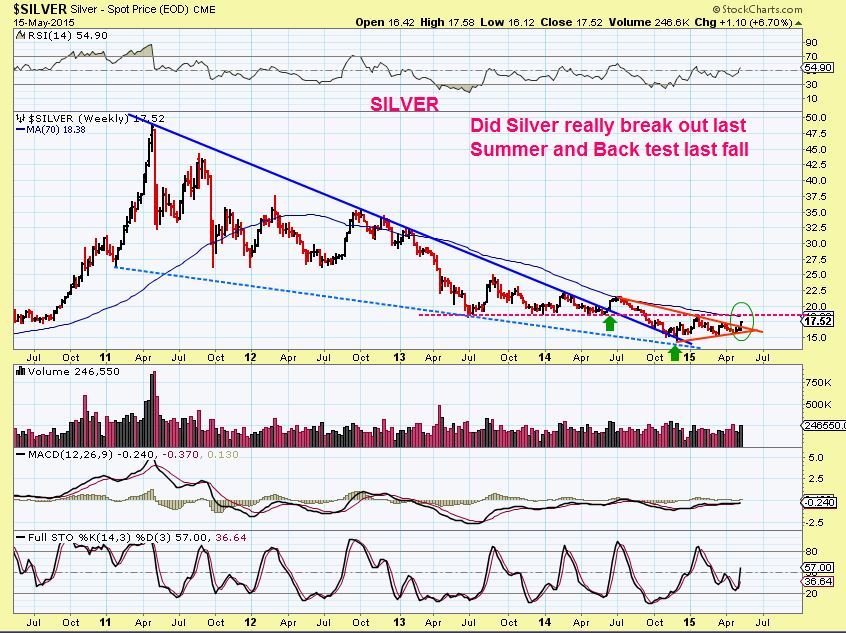
Did SILVER really break out last June and back test with our Nov lows? THAT is Bullish. Is this bear market ending and returning to a Bullish resumption? Time will tell.
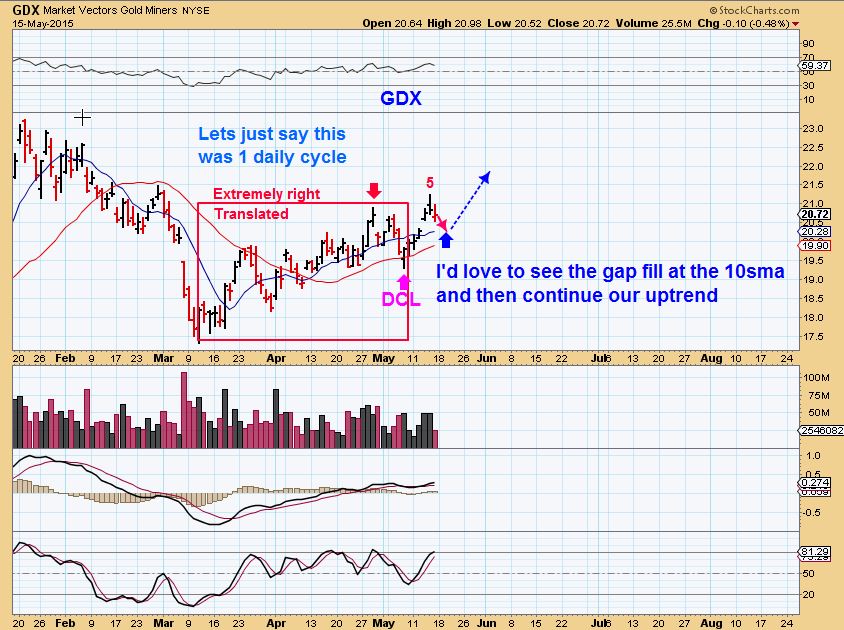
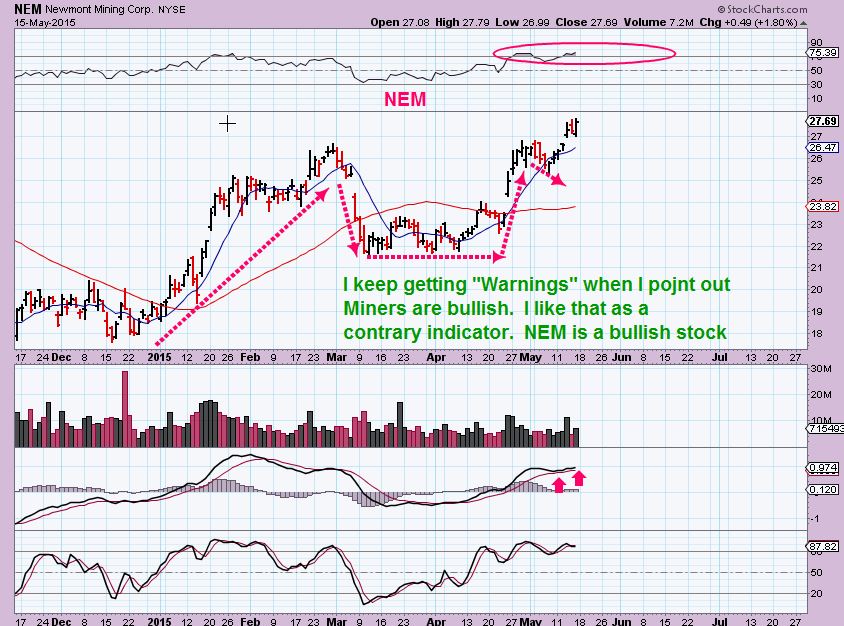
GDX– I have already mentioned that many Miners are bullish set ups and have been acting better than GOLD & SILVER were. GDX was very right translated, and has now made new highs in this current uptrend.
NEM is a big part of GDX and it remains bullish.
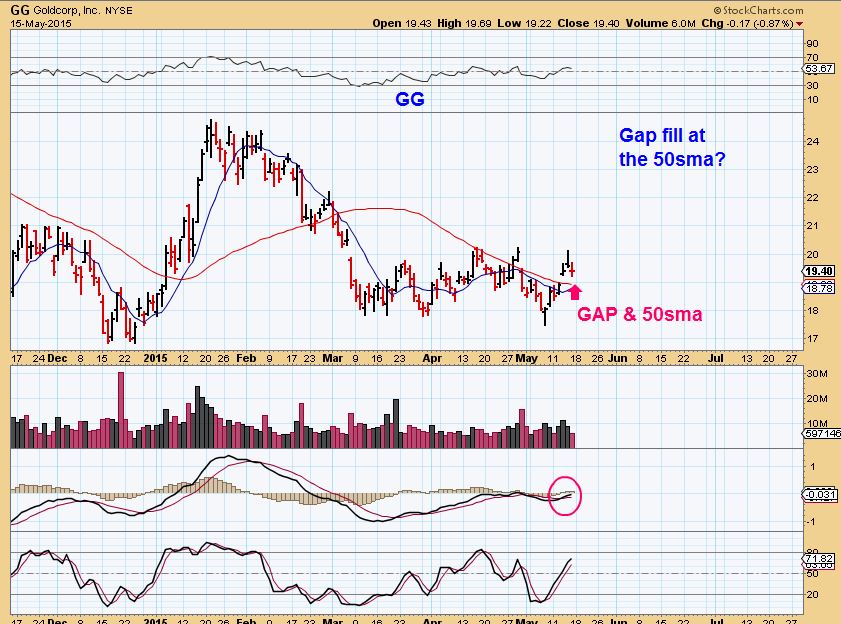
GG has been a weaker large component of GDX, but last week began shaping up. It still has a higher low than December .
LESSON:
I wanted to throw a quick lesson in here before discussing some Mining & Energy stocks. In the past I have mentioned how much I like stocks that get beaten down to an extreme in a beaten down sector that should recover. For example I’ve mentioned this when discussing our OIL Stocks recently, and also Energy stocks and Miners in the 2008 sell off. They got beaten down to ridiculous levels and can recover over time. I made my best investments then. The lesson is that this usually happens after forming a base first & rises ‘Over Time’. It can take time for a stock that went from $30 to $5 , to get back to $30.
SO THIS IS THE REMINDER: These trades often take a long time to recover and it is not straight up, but can be very rewarding. This reminder is for any who want to accumulate a position and hold. You may be holding for a year or more.
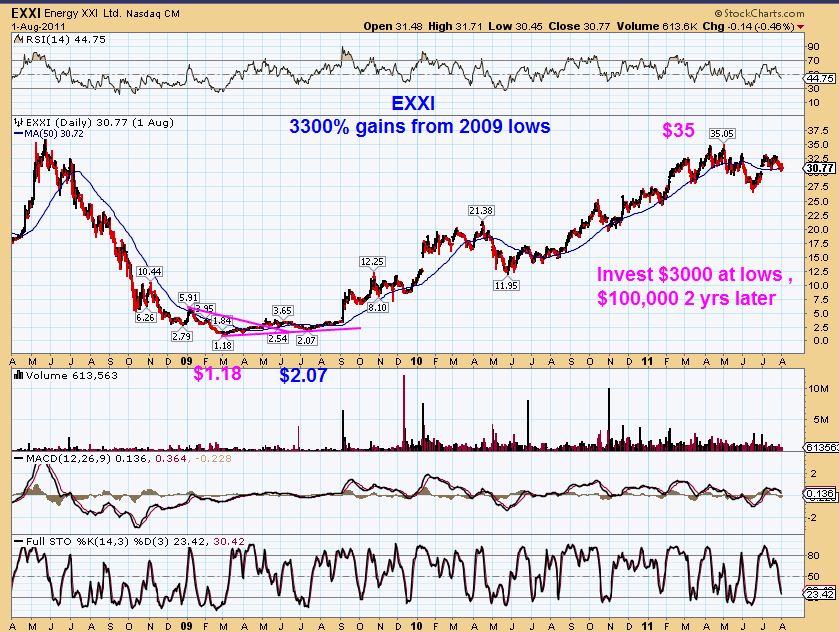
So this was EXXI in 2009 – 2011. It dropped from $35 to $1.18!! It eventually made it back to $35 , but please notice it was 2 yrs later and it was NOT straight up. In time , it was also VERY REWARDING.
This is a tech stock recently at Highs of $37.50. It Dropped form $20 to $4 in 2011, but then recovered to new highs. Notice that is was not straight up. It formed a base and ran up over the years, with scary drops along the way.
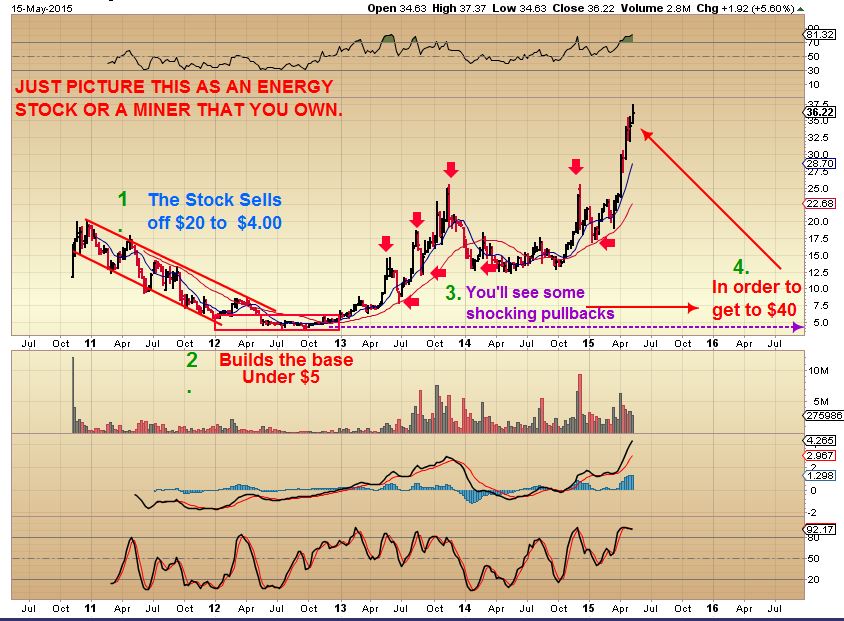
I mention that above lesson because I am going to point out some of these base patterns forming again. If Energy and Miners are bottoming, they could be great opportunities over then next 2 years. They arent going up 500% by the summer and they will not be straight up. They will have wiggles and drops, but in time they could be huge %-Gainers if Oil, GOLD / SILVER make their recovery. Also they can be ‘Traded’ as they break from their base, pullbacks can be bought, etc. Traders raise stops as they Pop. We have been doing this in Energy already.
In prior weekend reports , I have hinted at the idea that GOLD may have put in its lows in Nov 2014, and in this report I pointed out that SILVER may have broken out and back tested already too. Miners have been acting quite bullishly since the November lows too. SO Let me discuss some of those long bases in various charts for Miners.
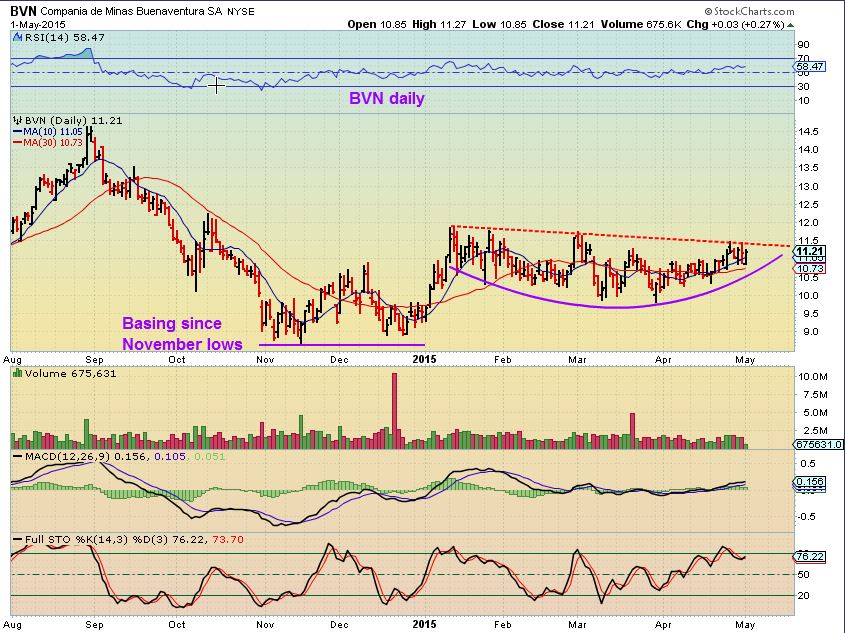
I mentioned BVN on MAY 1, because it has that base and certain characteristics that I look for before a pop at $11.
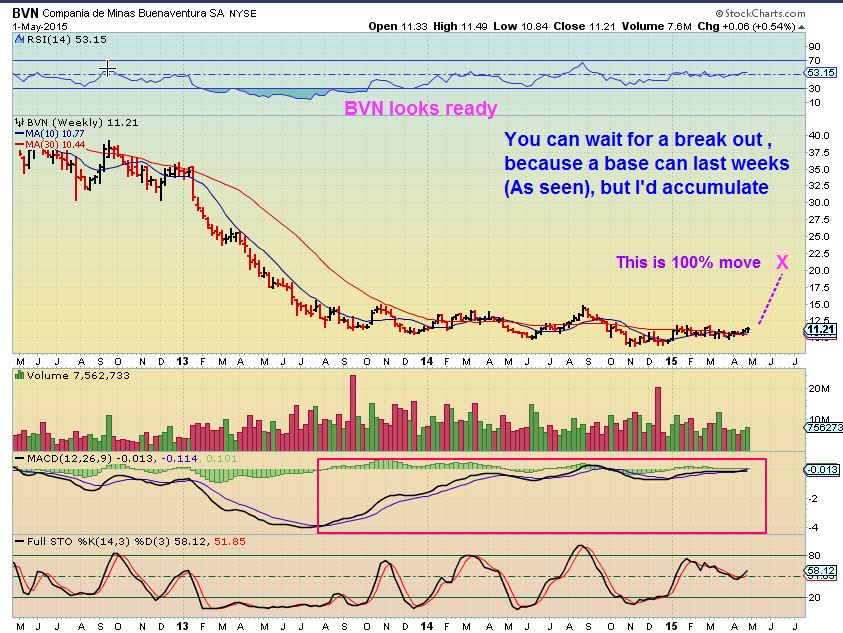
It has now POPPED
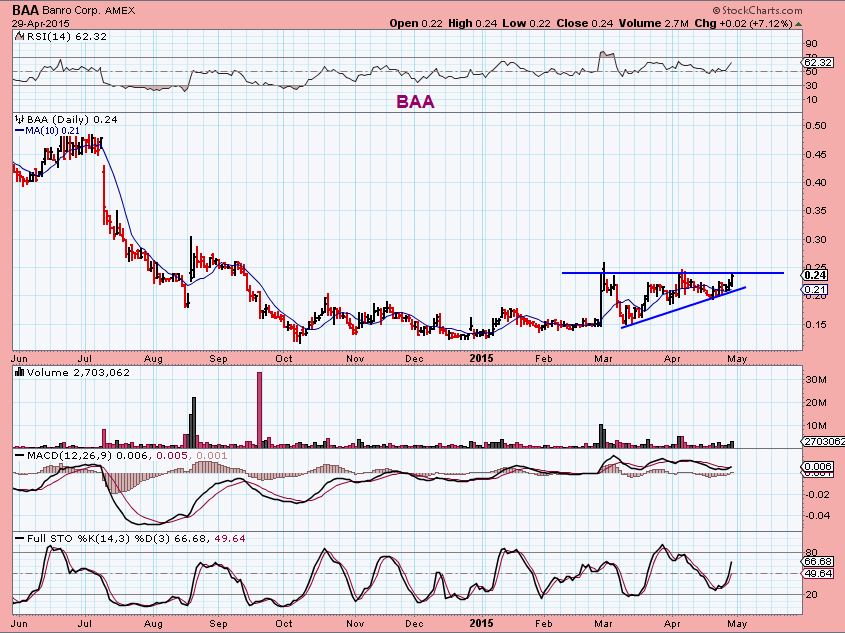
Close up I showed this daily on MAY 1, readying for a break.
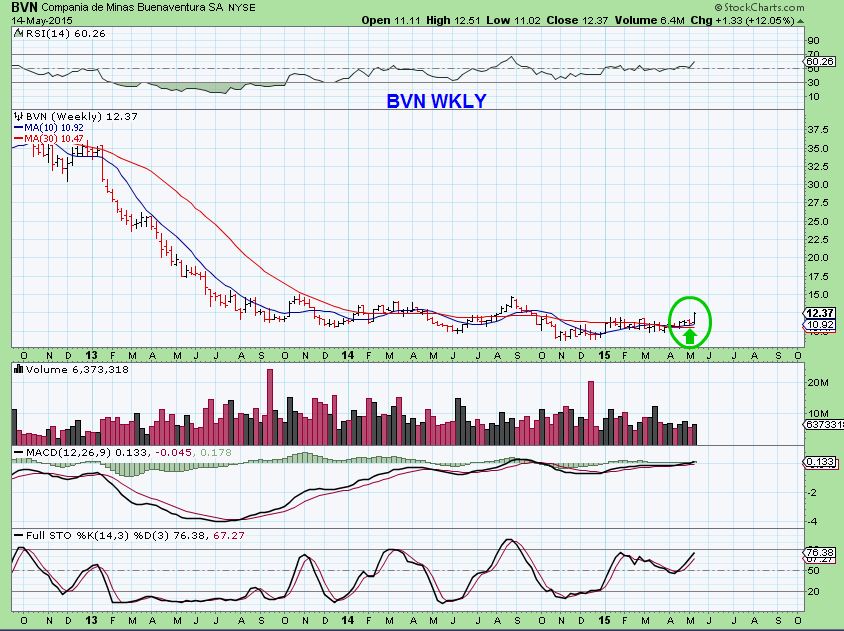
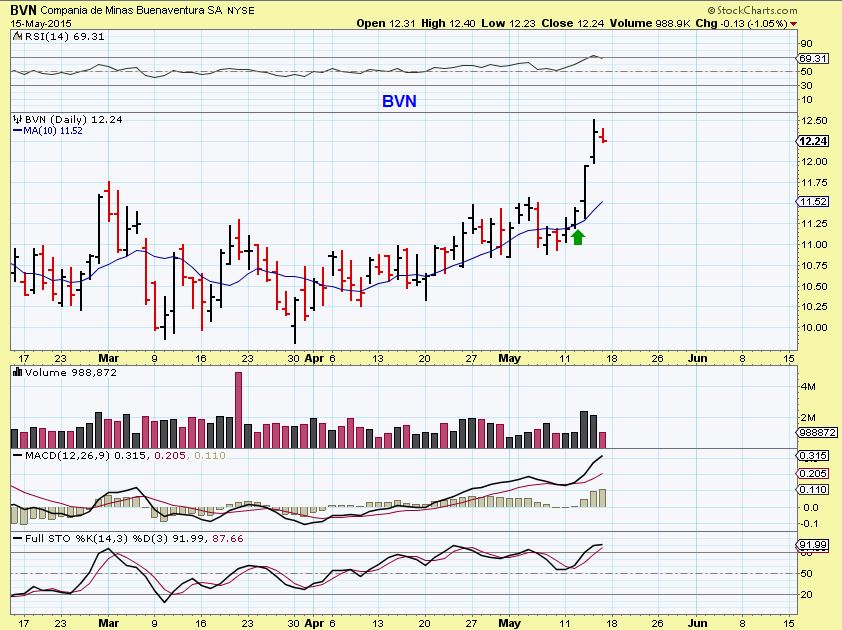
BVN now. Watching how this pulls back may provide an entry.
BAA WKLY– I was really loving this base and said I was accumulating it before a POP that I expected.
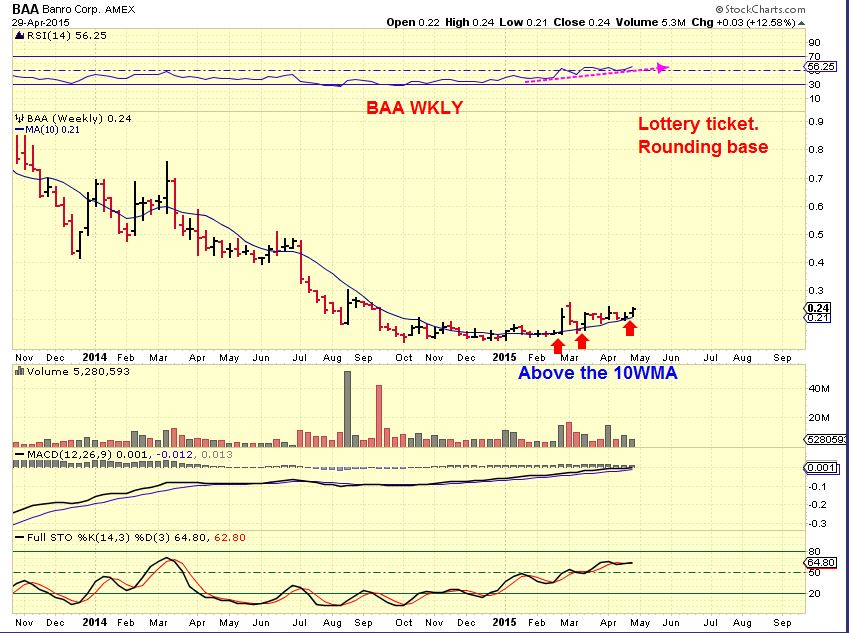
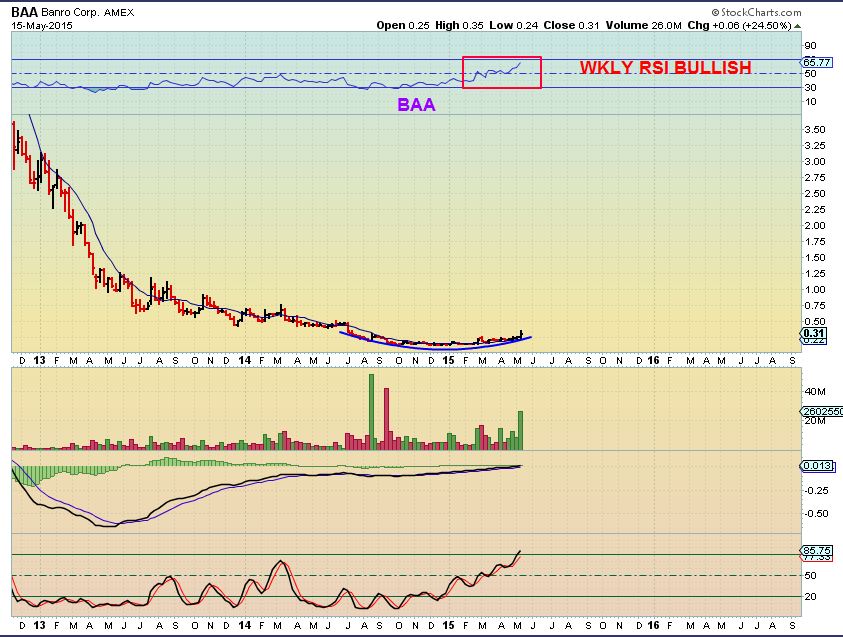
It popped to $0.35 on the daily, but hardly looks like much on the weekly. I think this could be a great % Gainer “OVER TIME”
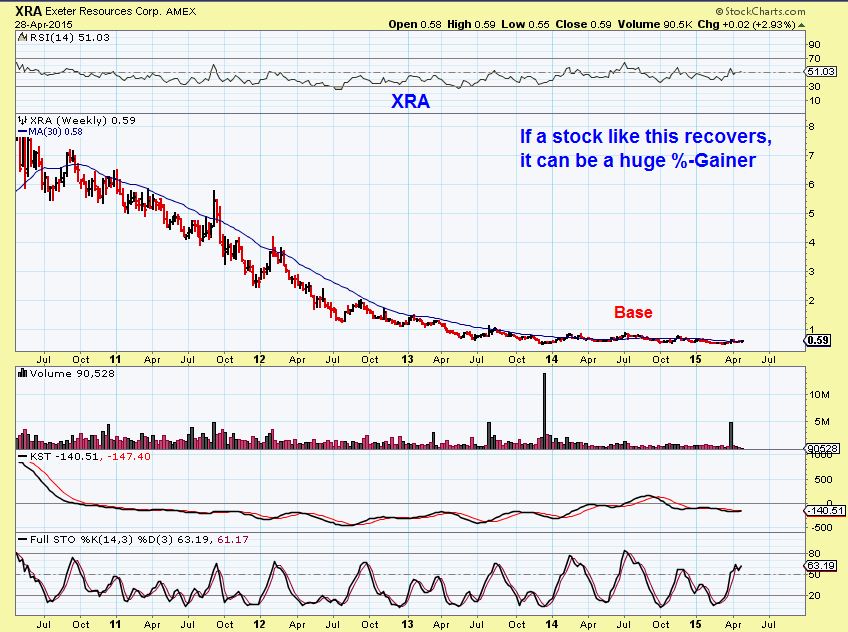
I pointed out XRA as one of those tight bases to keep an eye on. I do not own it, and I have a hard time getting its earnings.
TRQ– Popped from $2.65 to $4.45 and is holding up in that price area. These are examples of what I have been discussing.
.
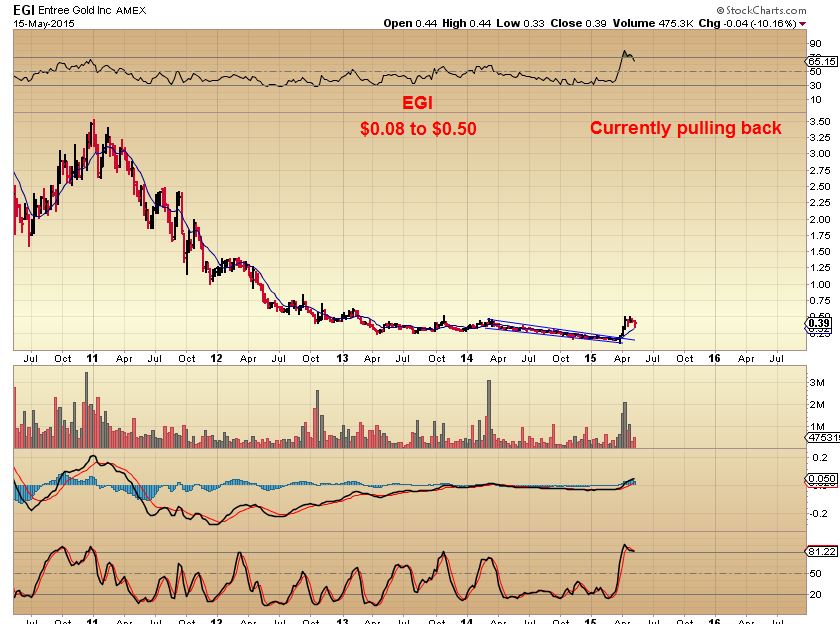
EGI popped and is pulling back now. I am keeping an eye on it.
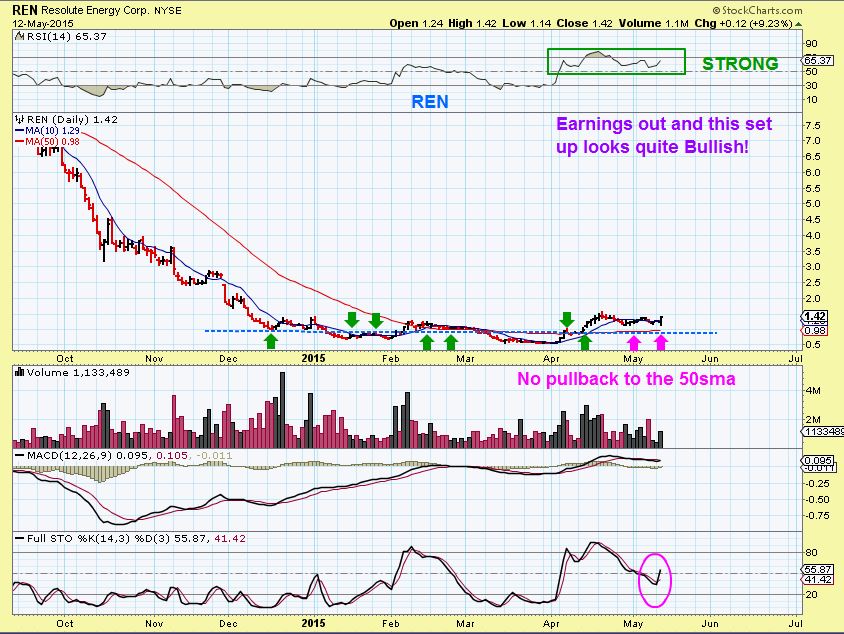
I like REN for it’s base ( Its an Energy stock, earnings are out and I own it)
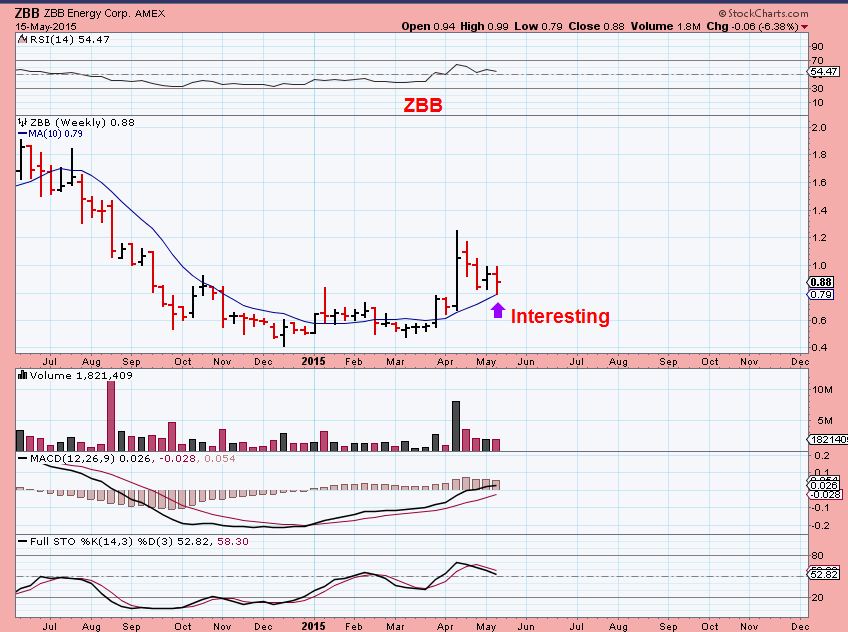
I pointed out the base & pop in ZBB . Expected a pullback to the 10WMA??
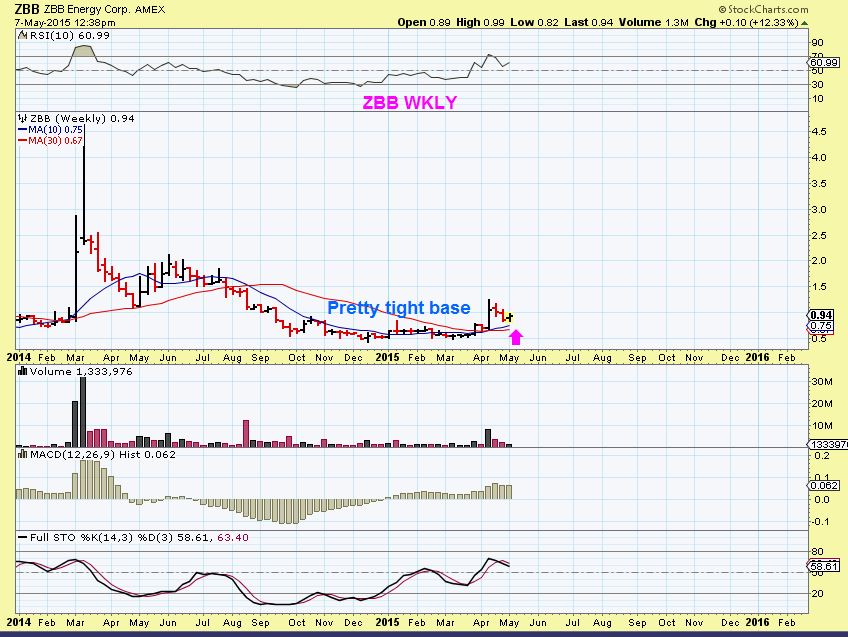
It became a buy last week at $.079 on the 10 WMA. It may offer another entry this week, the stop is just below that 10WMA, maybe 70 cents.
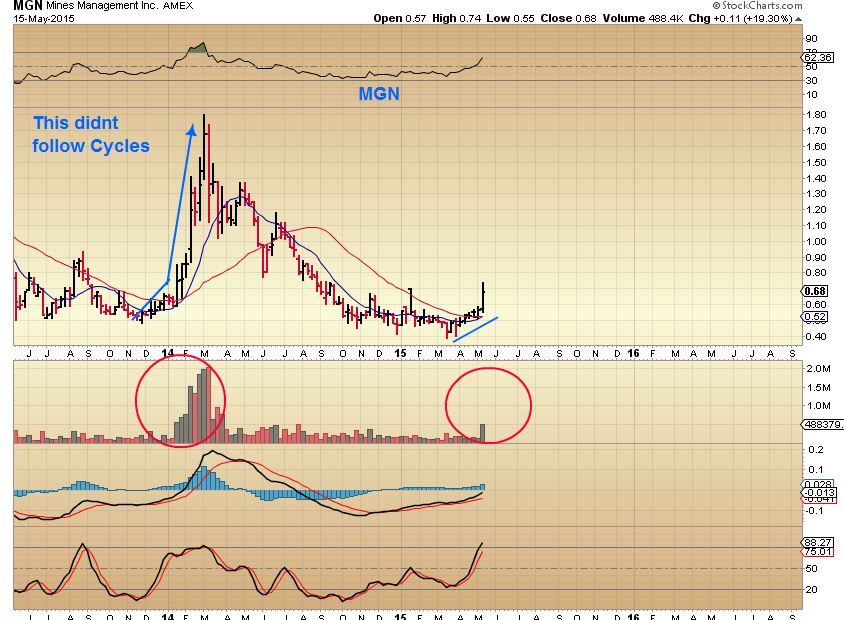
MGN popped , but didnt have the super long base. The last time it did this, it ran strongly.
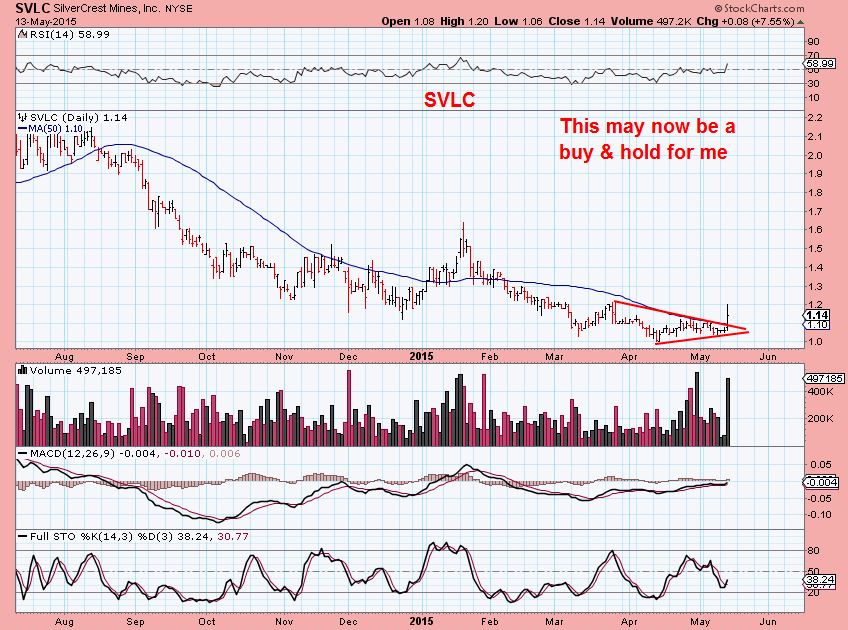
SVLC – I bought this as it and Silver popped. It is currently only $1.17, I like the volume pops.
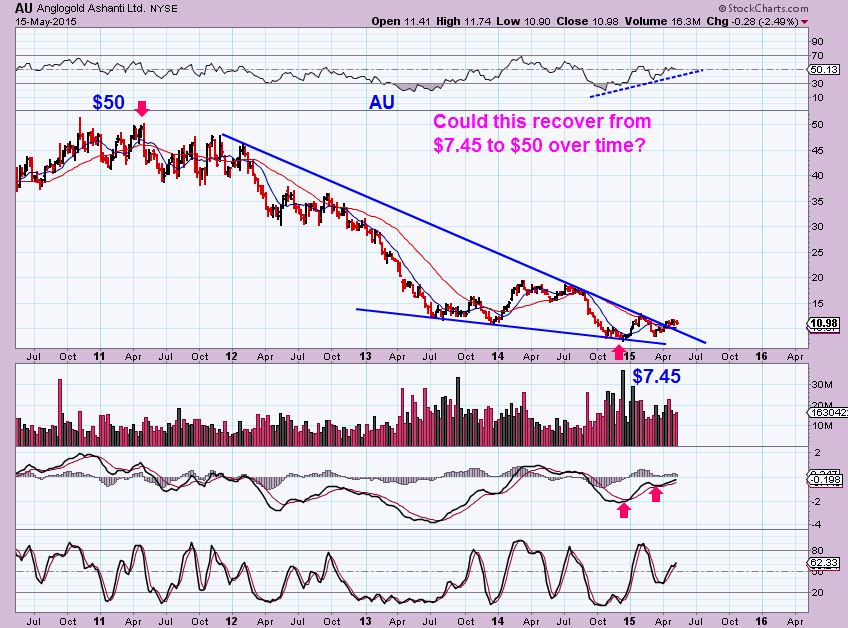
AU – is a good example of a Miner that was thrown away and may make a great recover over time. $50 down to $7.45. It looks to have bottomed in Nov.
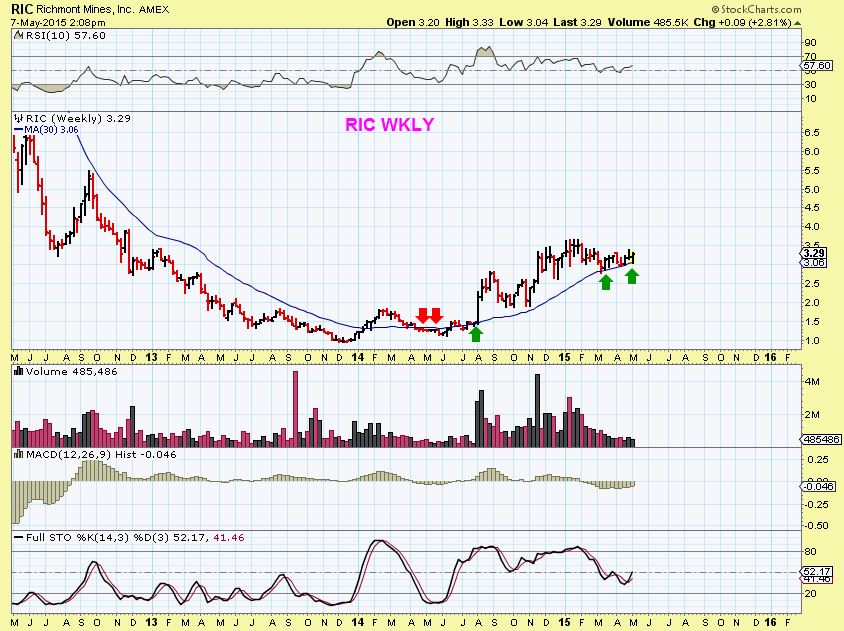
RIC and LSG are strong and almost ignore the price of the metals .
I have pointed out a few Silver stocks that I liked. I posted charts of SSRI, HL, EXK and a few more. They are all doing well.
EXK- I pointed out this buy and expect more upside.
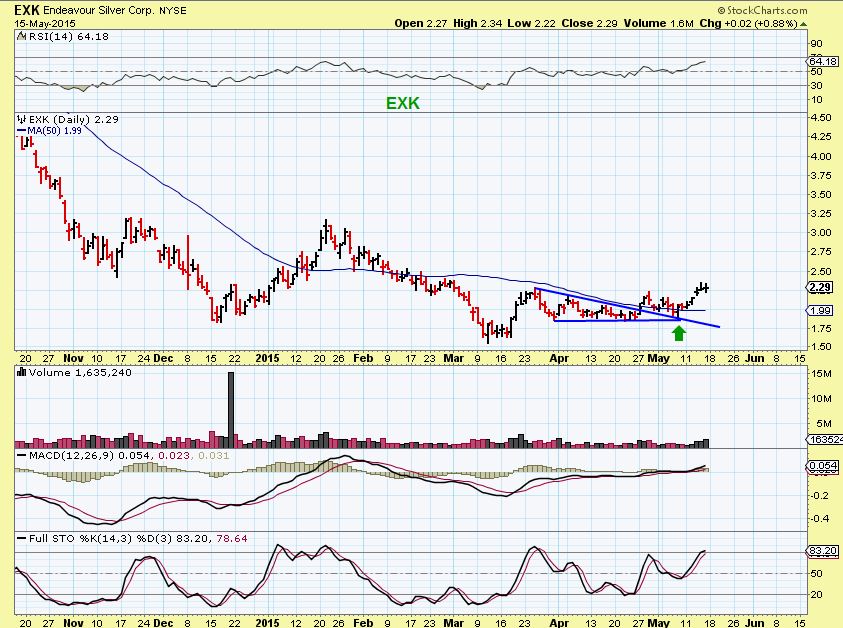
FSM, HL, EXK, SSRI, SVLC, AKG, MVG, SVM, AG etc are silver stocks that I like .
URANIUM stocks really look good again. On the daily they are pulling back, but the weekly charts look good.
Rare Earth are good for trades
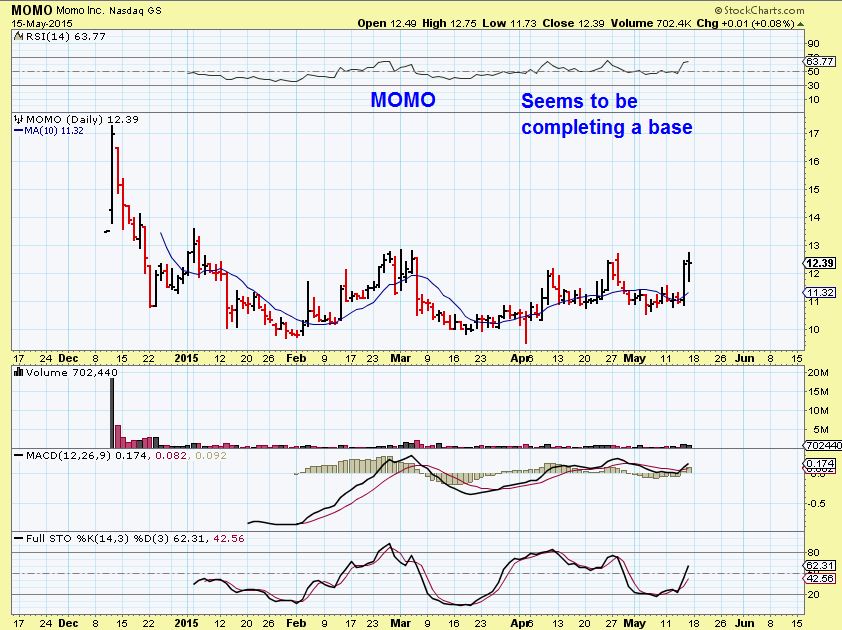
Many TECH STOCKS look good .
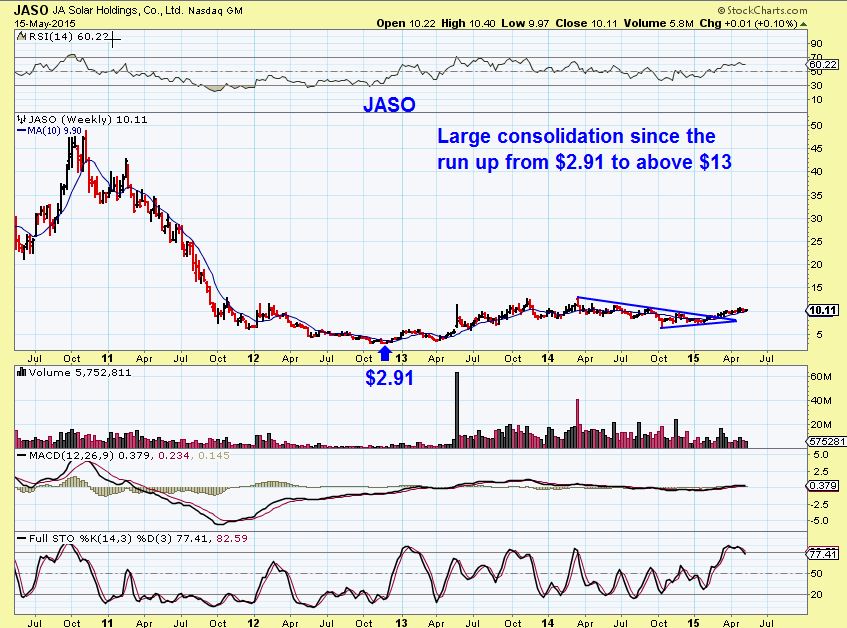
Some of the weekly charts in Solars are interesting, but they are difficult to trade at times.
This is JASO for example. $2.91 to above $13, currently near $10.
I want to release this report well before 8 a.m. since it is a long one , so For Experienced Traders I’m just going to throw a few names out there for you to be able to look at the charts .
TECH STOCKS that look interesting can be
MOMO,
See Bullish Charts : AMBA, ZAGG, BONA, RVNC ( Some like RVNC need a pullback first) ,
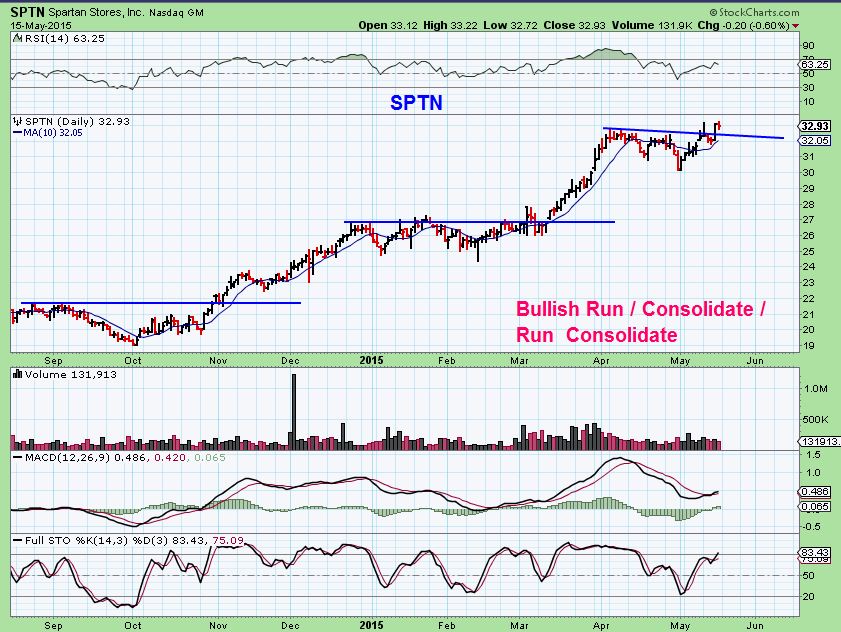
SPTN
SOME SHIPPERS look very interesting. See TNK, FRO both trending higher & moved back above the 50sma , SALT, NAT, SB (Base)
So there are a lot of trades out there , but I am personally focused on ENERGY & METALS for their current moves higher. Some have been making very good % gains already after consolidating. Please be aware that earnings on some may not have been released yet. Many of the Miners have been releasing earnings and popping higher. I also feel that most should continue to run with this second daily cycle, and I plan on covering this area as the move in Gold, Silver, and the miners unfolds.
I hope you all had a great weekend and welcome back to trading & investing! Many set ups look great.


wow.. interesting stuff there CF.. looking forward to studying some of those charts -luv the lessons/looking back & studying the moves :o) Great variety to choose from as well… saves me TONS of time researching sectors so thank u thank u :o) have a great week everyone….fill your pockets! :o)
+1 CF
: )
Thx Maria
I look back often to try to see how things have played out in the past, and yes it can be tedious and time consuming. Glad it helps.
CF?
First time she wrote it I thought she meant the ticker- then I realized it was Chart Freak
yeah… that darn Maria.. what to do… what to do … ;o)
Yes, someone here said it best , ” How do you solve a problem like Maria?” THATS a tough one
😉
ChartFreak ;o)
Pretty obvious, can’t believe I didn’t get it! Thanks M
Thanks Alex. What are your thougts on CENX? I think we better hold the 20ma or a drop to a double bottom can be expected. Setting my stop @$13.64
I agree.
I had drawn a chart for CENX , but it was a long term chart showing that in the past it had bumped around in the base process as it tried to gain the 50sma. We may do that here, I think it looks good ( except that shorter term it lost the 50sma). I will attach it below
Alex, looks like best move for miners is try to find a small pullback? I sold my JNUG way too early, looking to get back in and and add another silver miner (have EXK). Sometimes, in 2nd daily good pullback are hard to find, and when you do it could be rolling over instead (have to stay frosty with these). Thought we might get a pull back this morning but so far it’s a no.
Yes Cason, It is difficult to say when or how big any pllback could be on this next run up. looking back at past 2nd daily cycles , they can be mostly up & sideways type moves
Yep, when the bull’s running you’ve got to get on and ride it or it’ll leave you behind. Trite, but true. And usually easier said than done, but that’s where good TA comes in.
Yeah, maybe the past 3 days have done enough – consolidation instead of the usual -20% correction. Especially with many juniors looking strong as well as silver – up almost one percent against a +1% in DXY!
I think EWZ is forming a nice little consolidation here to launch thru the 38 resistance and the 200 DMA. Found support at the 20 DMA and 36 pivot the other day. Looks great. BRZU is the 3x ETF if that’s your game.
And NBG has pulled back and is finding support at the 20 DMA so far today. It’s been bumping its head on the 100 DMA lately but I think it’s coiling for a jump thru that soon.
There’s talk of matters coming to a head this week. The fact it’s off the front pages suggests this is bona fide. May be clarity subsequently. #Bullish
Bueno! or I should say, καλός!
That looks like a bullish move (Engulfing so far) on NBG
Yeah, nice timing, eh? 🙂
Quite a bounce from this morning -5% in Athens to +2% NY…
Bounce off 21SMA on Stockcharts
The steel stocks look good. ( X, AKS, SCHN) SCHN really moved up today
The BBs on MPO have narrowed down to a very tight range. Could be a big move coming; hopefully up!
Alex, does your TA provide any target for silver upside?
Hi Rube,
For this set up the first target was only $17.75 because the pullback was so deep in April ( almost back to March lows again) , however I wouldnt be surprised to see the Jan highs tested in the $18.50 area next . Then I have to see how that area is approached.
I was getting a bit worried about HIMX but it’s bouncing back nicely here.
FWIW:
Testing the waters again in the Energy sector.
Filled: PKD, PQ, RES, and REP. Tight stops = recent lows.
Alex, any comments or concerns on these ?
Also filled: SZYM and TGA
Sorry….RES
RES looks good sitting on support & 50 sma. PQ could be double bottom. PKD is just below the 50sma,but volume is light & may be fine . REP?
I added to KEG as well as added REXX and USO, so hoping we keep moving up here. Giving it a little bit of room as it’s been bullish so not smothering this one with tight stops (yet).
AXU, AAU, SVM look like they’re attracting attention
Nice to see the coal stocks such as ACI, ANR and BTU back to what they do best. Lose investor money.
LOL! I like the Weekly wedges
It’s probably early Alex, but I think EXXI, SD and SFY seem to be trying to carve out a short-term bottom. Obviously, all bets are off if oil corrects down to the mid-50’s as a respectable number of market watchers seem to think it will. We will have some nice oil sector opportunities soon, IMO. Those three may be worth watching. I did buy a little BTE and ERF last week after they corrected about 15% from their top. Hoping that I wasn’t too early.
Wow, I hadnt seen hat SD went right back to lows.
That has heavy volume so its either a capitulation type low now, or it could break down further. It might have been a perfect buy , quite oversold & some nice divergence (but watch it).
Yeah the coals sure look poor. Stopped out of BTU at a small loss last week. Down at least 10% since then.
I was waiting for the mid may dip as shown on my other chart. I am actually looking at buying it here, but I want to see a reversal. See my chart attached here for the reason. Even If the top line just skims across all of the highs, the lower one seems to be right here.
Its SO Sketchy though. Coal stocks have been horrid. I dont recommend this at this point, it would be a quick trade if I took it , with a tight stop.
.
Not real optimistic about the miners (GDX) here. AUY looks good, but some of the others unsure. Be careful, we need a higher high to break the harmonic pattern. Something higher than $21.20
I think many SILVER stocks look good, using 6 month charts
You dont like the looks of SVM, AXU, SSRI, PAAS ? They could be leading , and AG, HL, SVLC , EXK seem to have started too.
BVN might be a buy soon.
Sorry Bill, thought you meant “miners” in general not looking good, because you mentioned AUY , I didnt see your GDX chart until I refreshed.
The JUNIORS seem to be getting some attention.
BTG, AAU, PPP, TGD
BAA : )
omg.. i was JUSST going to post.. that looks like its headed to .50 for a second then 70…pdq ..
i also ‘think’ nugt is about 2 blast off.. looks like its jussst finishing C2 & about 2 enter C3 blastoff zone.. lol
Maria, Post a chart? I want to see what your talking about with NUGT
Hi Bill
I’m working FYI – but here is my GDX chart…remember i am just learn EW soooo – I could be ‘off’ in my counts-it’s extremely difficult.. I believe we are in C2 [C has 5 waves] and are correcting for a big move up with C3 – the third wave is generally 1.61% of 1 – which is how I get the projection for C3. I tried to separate & label the waves to make it easier to identify them. I will check back when i can if u have questions.. ORRR if you can see if/where I am off on my counts.. ;o) feedback MOST welcome…actually I’m not afraid to beg for it either… lol
https://www.tradingview.com/x/uxYRTtyA/
here is nugt fyi https://www.tradingview.com/x/PSVFVWgl/
i also like AUMN..u?
I m watching AUMN & VGZ tick by tick : )
I posted that REN chart in this report again, said I own it because it is one of those long bases that I like.
Its taking off again now.
ren..,,,,w o w. nice job congrats — baa too.
Alex- I am struggling to see Gdx as bullish and the last time i used cycles in jan/feb thinking we would make a higher high it didn’t happen so I tend to focus more on charts and how things behave than cycles (u did warn about a pullback and I stayed way to aggressive giving back all my profits 🙁 Anyway my feeling is Gdx lacks power and refuses to break out.. If anything it feels like with fed mins on the way we are about to get smoked which seems to be a high percentage bet around anything fed related..