WKEND REPORT- GOLD & OTHER “STUFF”
In this weekend report I wanted to briefly review various sectors as we usually do. We have been quite focused on Energy and recently I was calling for the double bottom lows in NATGAS. We have seen these ideas play out perfectly. Now, in this weekend report, we’re mostly going to focus on GOLD/SILVER/MINERS. I have about 40 charts and this will be my longest wkend report to date, enjoy!
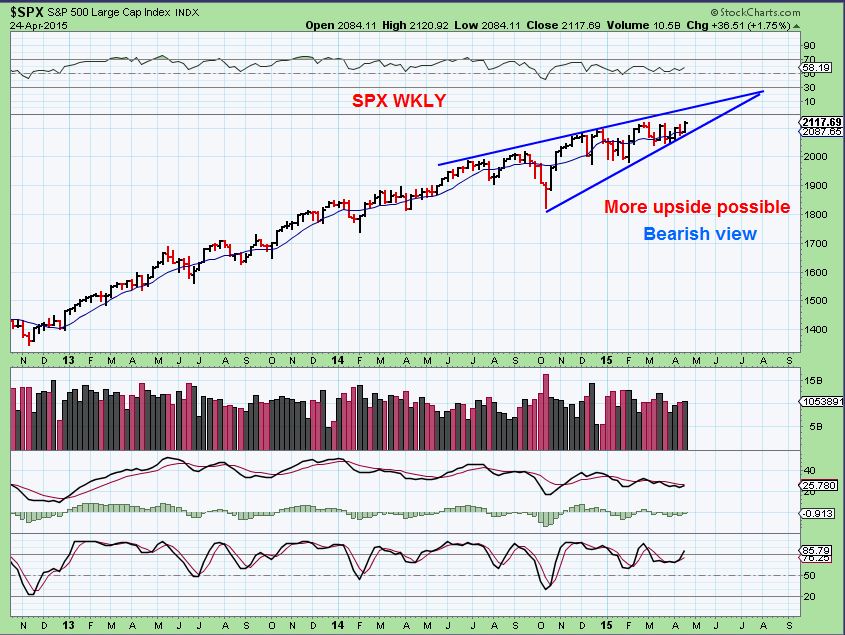
SPX & NASDAQ – I have pointed this out for many weeks now. Very trade-able lately, buying dips, selling rips.
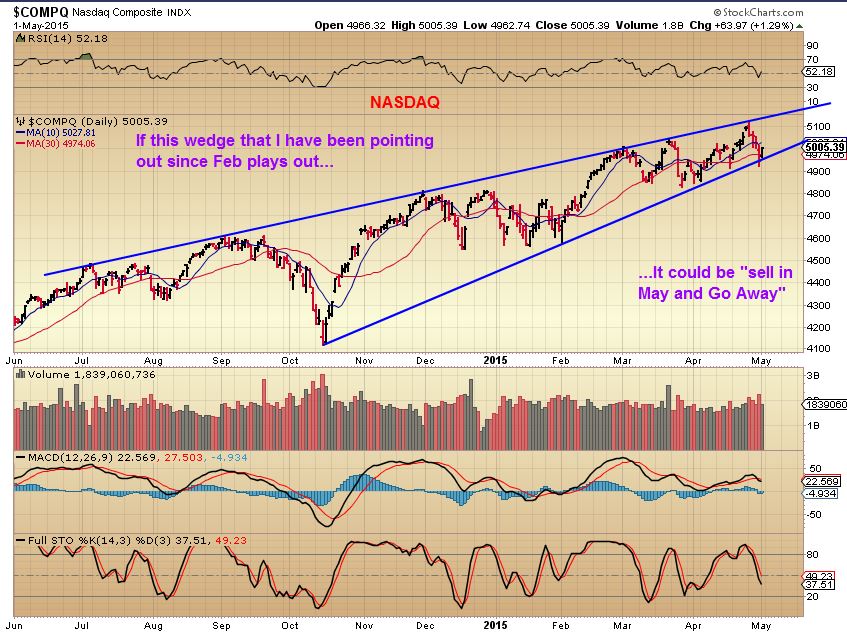
Here is the NASDAQ…
NASDAQ WEEKLY April 24
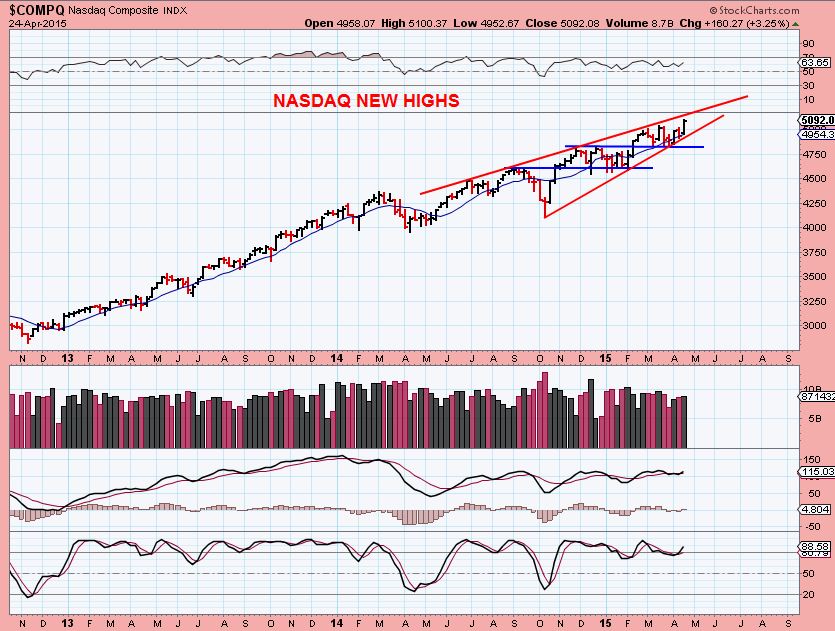
You can see that it is still playing out with a reversal Friday.
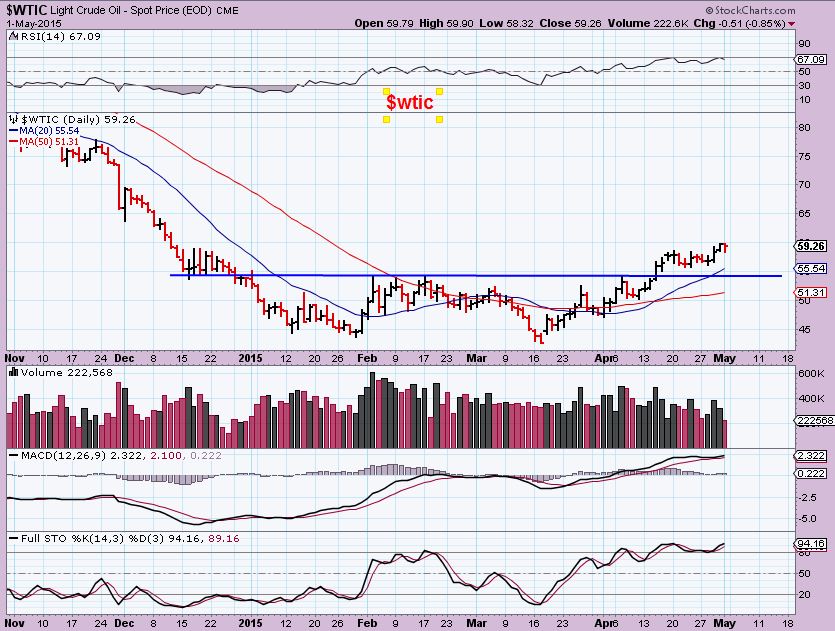
OIL – Has been doing very well since it double bottomed. OIL has higher highs, I expect a higher low on any larger pullbacks. Back test the break out area?
PLEASE NOTE that OIL’s Double bottom low came on JAN , then March 17 … for reference later.
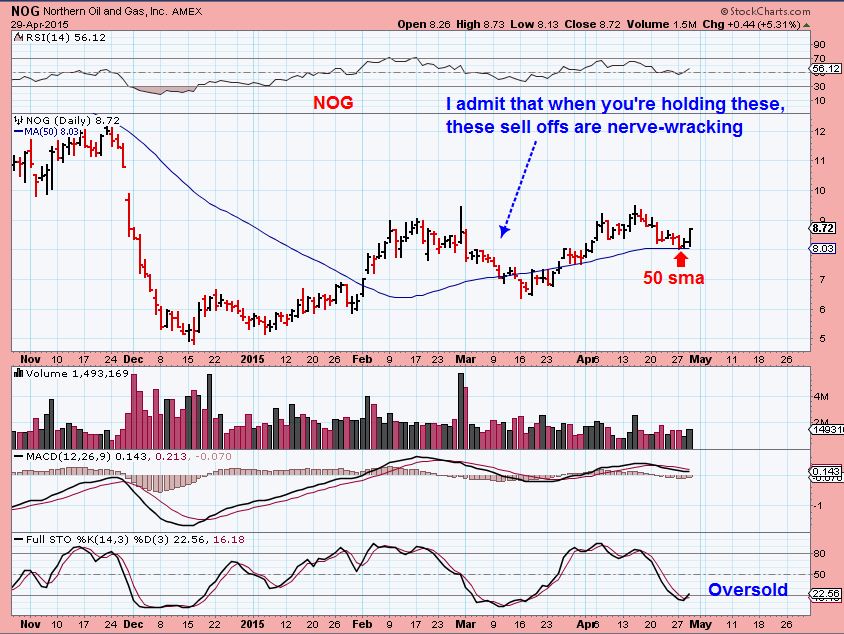
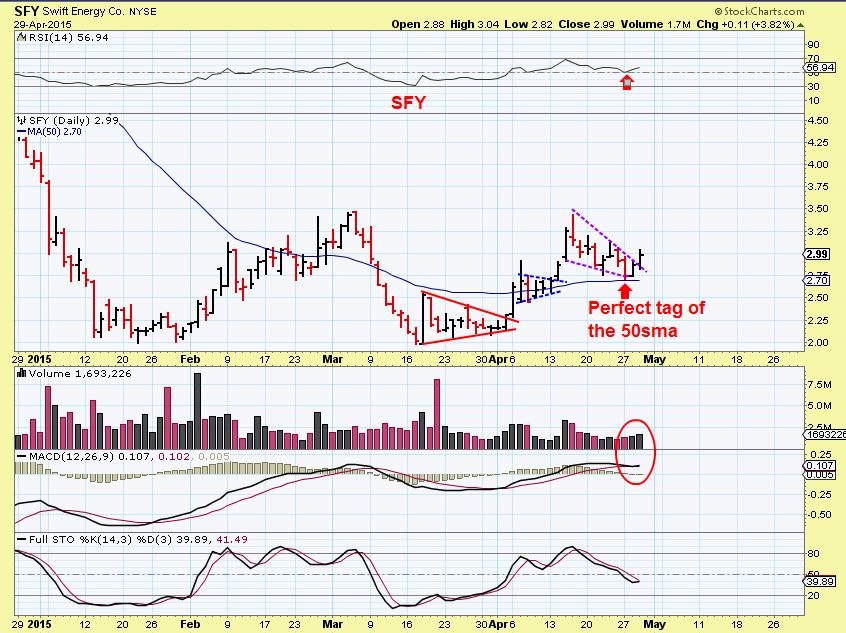
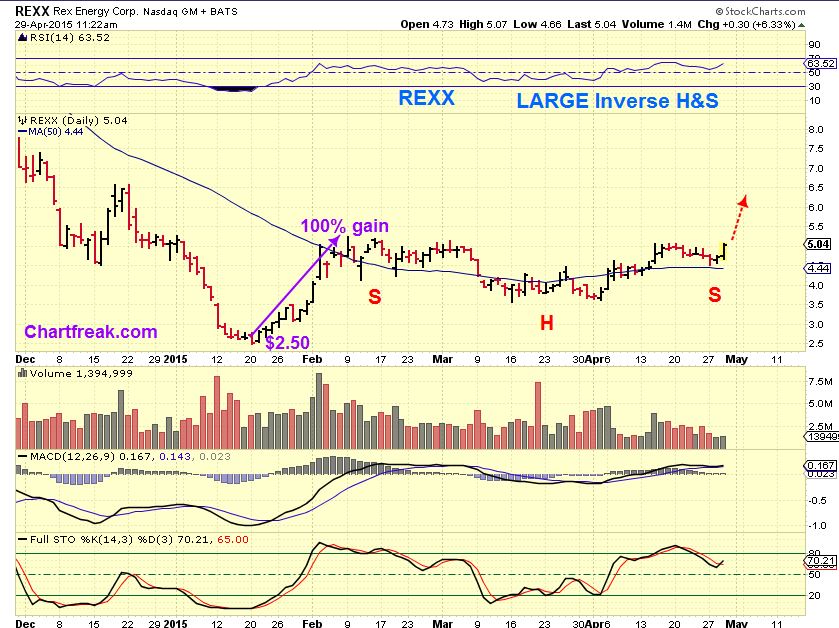
Our MANY ENERGY STOCKS are doing very well. BAS, REXX, LGCY, LPI,SFY, EXXI, etc etc . Look at HERO below . I recently re-bought the flag pattern, so got stopped out on the break down and it just tagged the 50sma & Up it went. It looks beautiful again, really.
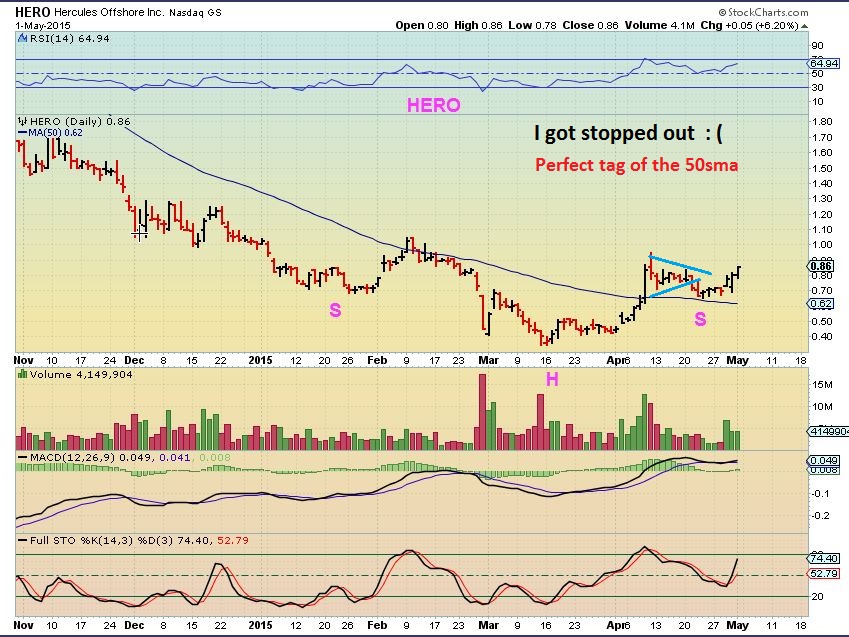
MANY just tagged their 50sma and turned up. They look bullish again.
I pointed out LPI as trending higher above its 50sma, and it looks great still.
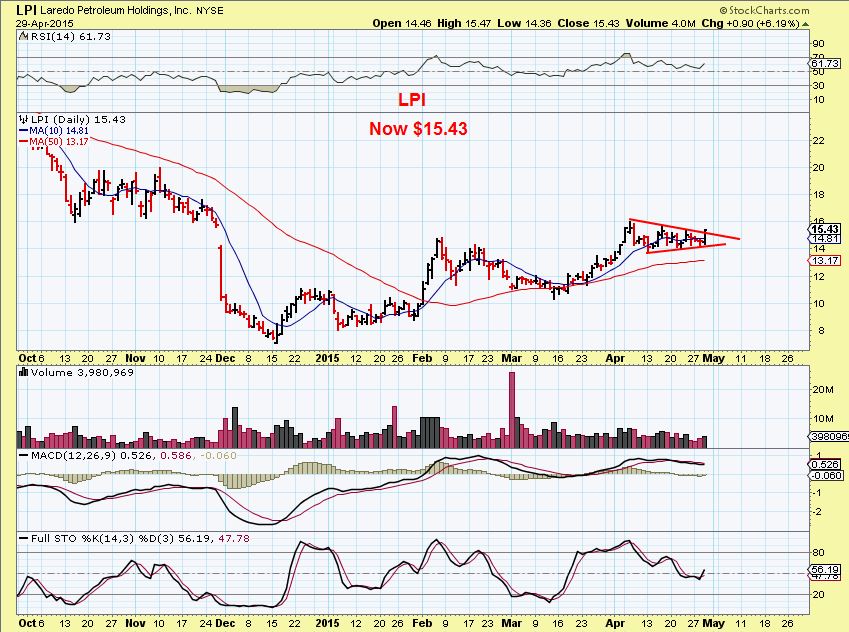
I think set ups like this ( for the patient ones) will be very rewarding over time.
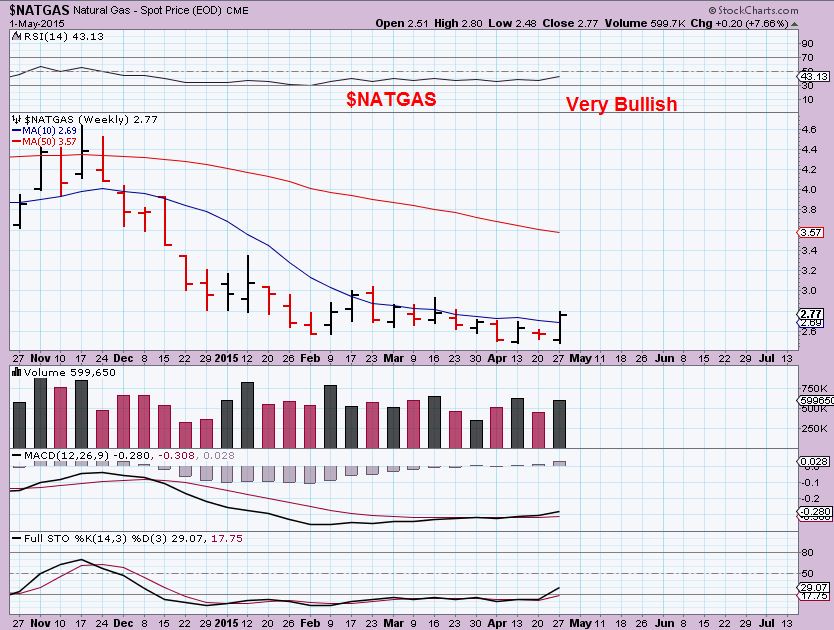
NATGAS WEEKLY – We got our double bottom shake out type low that I was expecting and a burst higher. I expect more upside, since this is just starting to take off. Shorts will be forced to cover if they havent yet, and buyers can step in and push it higher too. I recommended CHK, EXO, UPL and a few others as NATGAS stocks. UGAZ at ur own risk : ) AS ALWAYS, it may or may not be a stair step vs Straight shot on the daily . NOTE: NATGAS lows are APRIL for future reference.
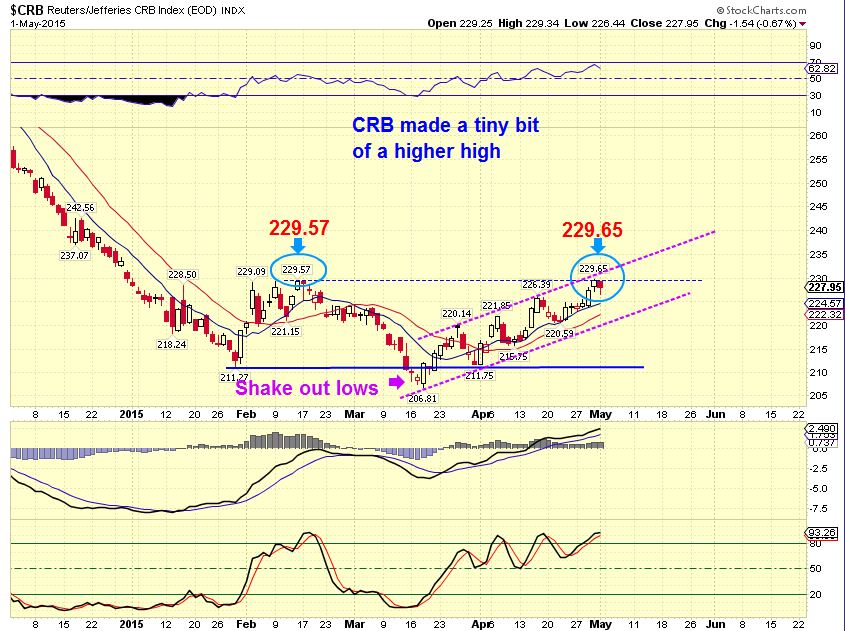
CRB WEEKLY– Double Bottom too and a BEAUTIFUL break out.
Please note for future reference that the CRB lows are also JANUARY , then March 18.
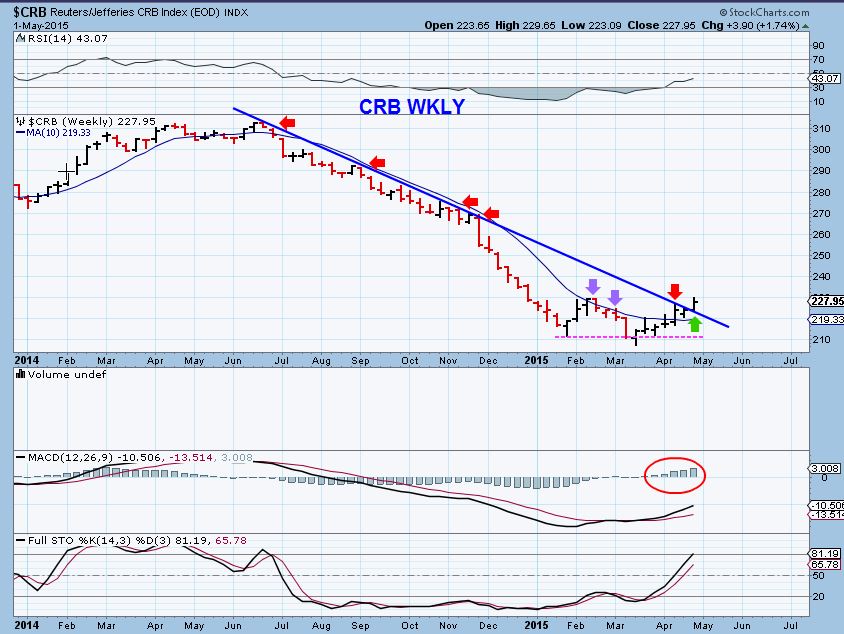
The CRB did something a little special, they made a NEW HIGH this year (Slightly) . Higher highs and higher lows start Up-trends. 
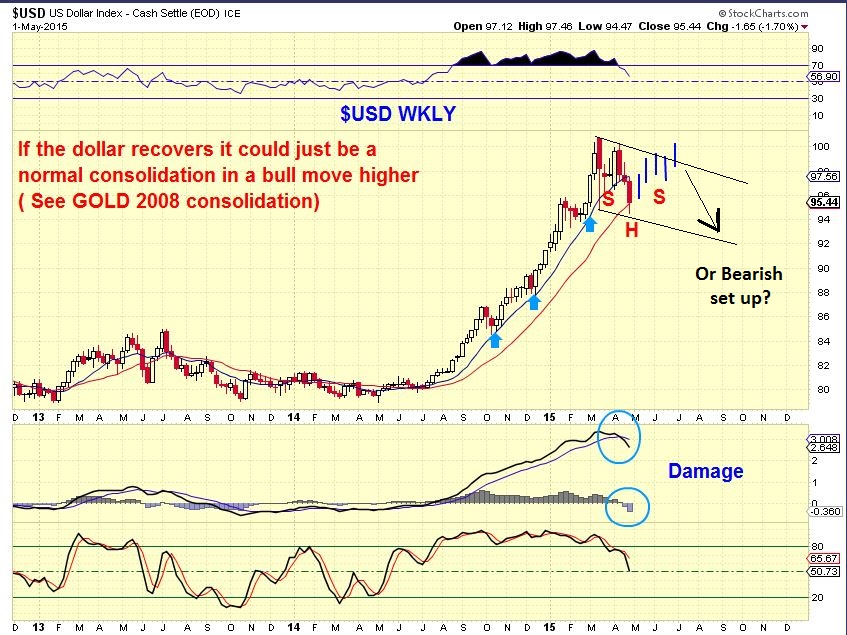
Looking at the USD WKLY– You can see the first signs of damage in a long time. This still could resolve bullishly, or we may start a down trend in the Dollar.
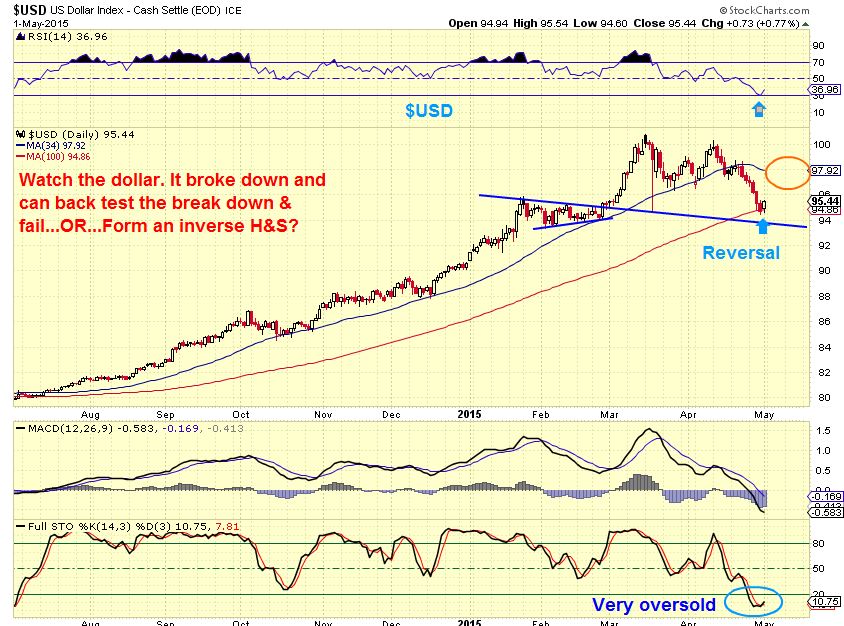
USD DAILY- It looks like a reversal Friday at the 100SMA, but it might just back test the break down of the 34sma that it never broke on the way up. Very oversold. NOTE: This bounce could affect GOLD/OIL/CRB/etc.
GOLD/SILVER/MINERS – I have a million thoughts on this subject, some BULLISH, some bearish, others Mixed.
WHERE DO I START! I will start with the idea that how can I not be mostly Bullish? I am seeing bullish ‘things’ and want to share those ideas and charts here with you now.
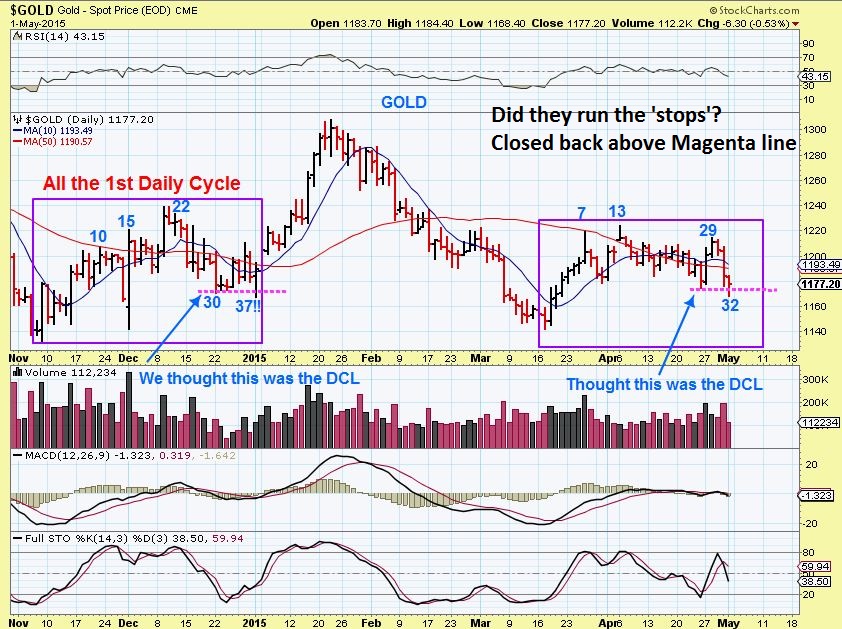
I pointed out in Thursday or Fridays report that GOLD was selling off fast (But Miners didnt). I have been looking back at the crazy moves in GOLD last NOV-DEC. They just kept shaking people out, so I pointed this out too. In cycles, many thought a break of the recent lows is a failure. IS IT? Was it in DEC on day 36!?? It shook longs out & turned and ran straight up, so I just pointed that out on the April 30 chart for Friday.
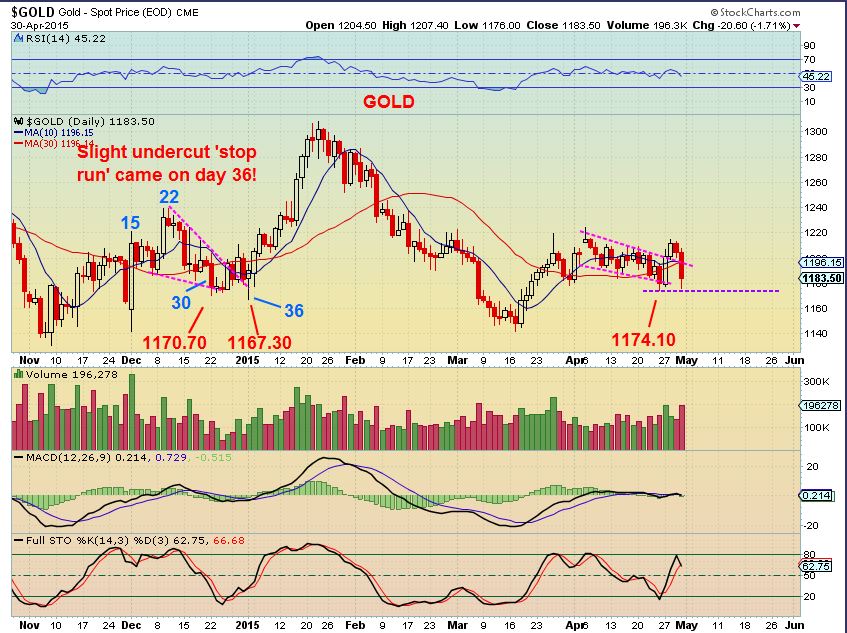
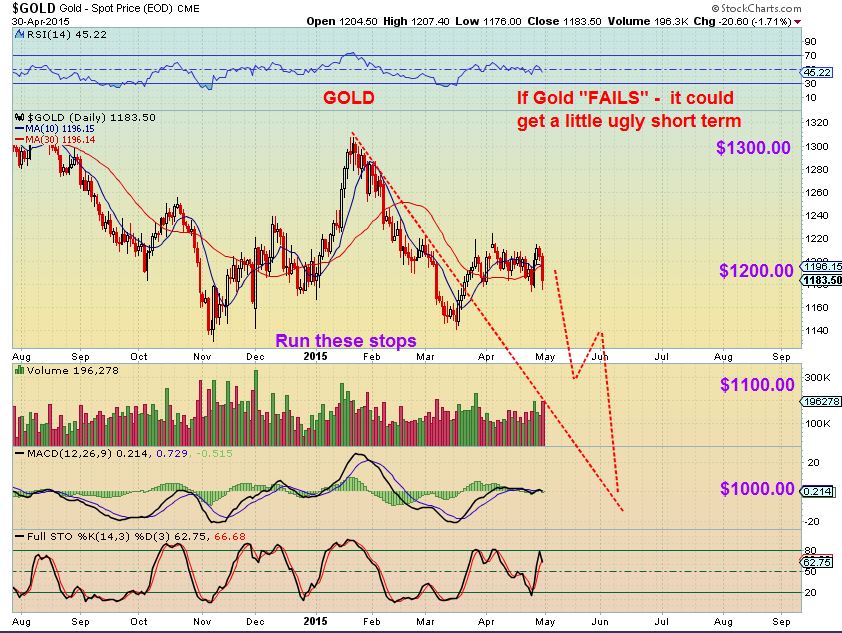
GOLD May 1 – we just broke the day 27 lows and recovered Friday. Is THAT the daily Cycle low at day 32? Time will tell, but even if it was….cycles say that is Left Translated, therefore the next daily cycle would be weak. Cycles call it bearish.
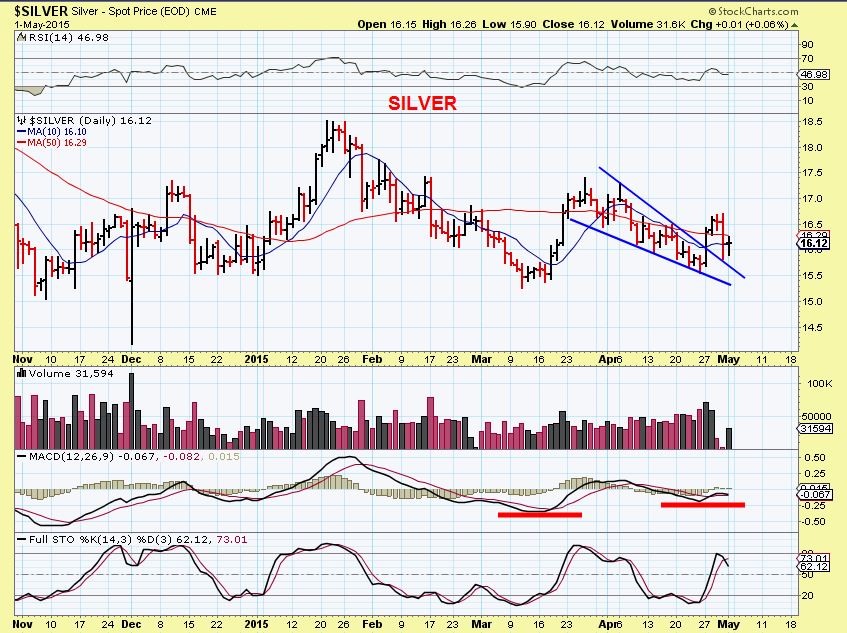
What did SILVER do Friday. Crash?
SILVER 5-1 – oh, it closed green. Bullish for now.
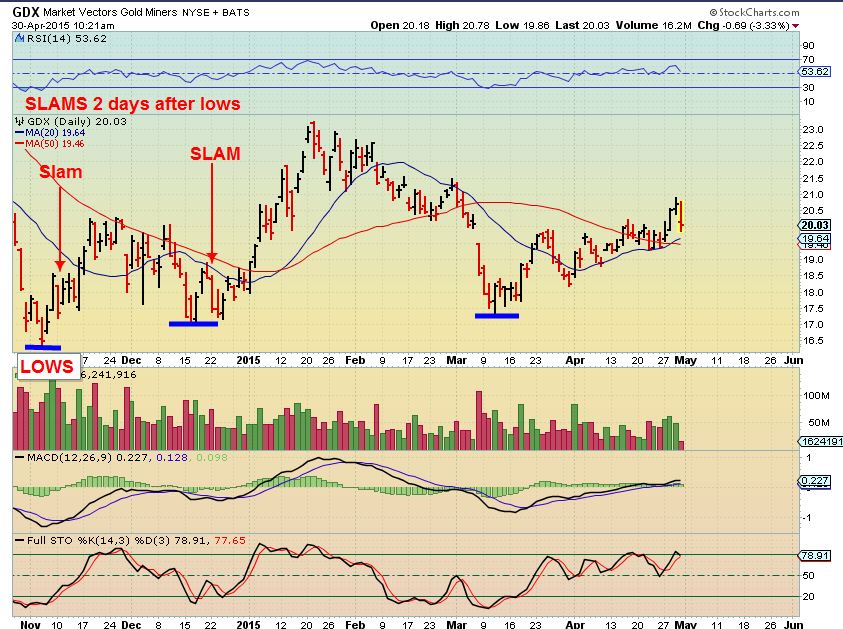
We had a SLAM down day Thursday, the day after the FED. Many in the forums/blogs I read sold off their Miners quickly. I pointed out here that 1 day slams have happened in the past , even near lows and DCL’s. I drew this at 10:21 a.m. to point that out.
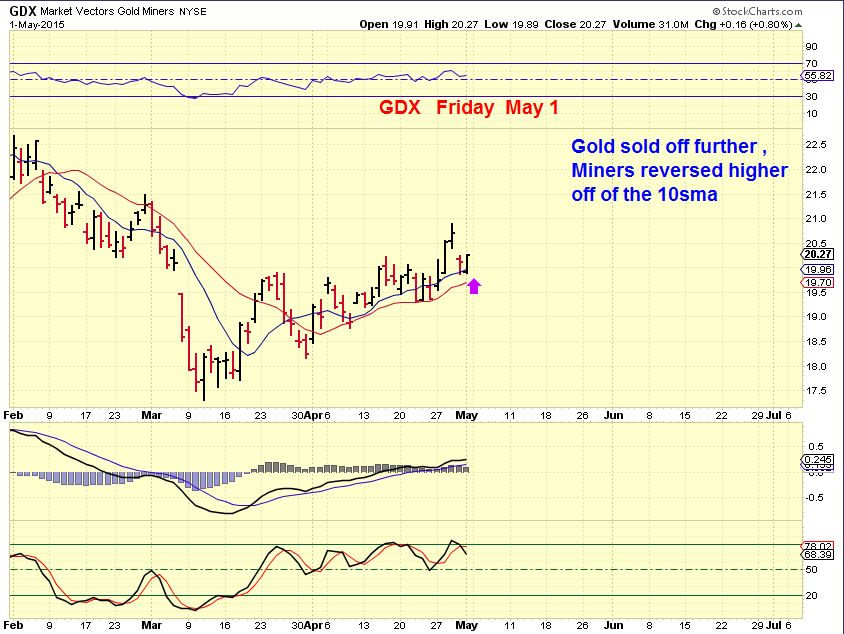
GDX 5-1- GDX did not follow through downside. Even while Gold fell $15 more at one point Friday, GDX closed GREEN. To me, thats Bullish.
RECAP-
– GOLD FELL 3 DAYS IN A ROW , from Highs $1214.90 to $1168.40. DOWN ALMOST $50.oo .
– SILVER fell from $16.70 to $15.82 only on Thursday, bounced higher Friday to close at $16.12. DOWN about 50cents
– Miners fell from their High Wed $20.90 to $19.87 , then reversed higher & closed at $20.27. Down 63cents
Gold down $50 and Miners down .63 cents?? Is that what YOU are used to?? THAT sounds pretty bullish, doesnt it? 
BIGGER PICTURE
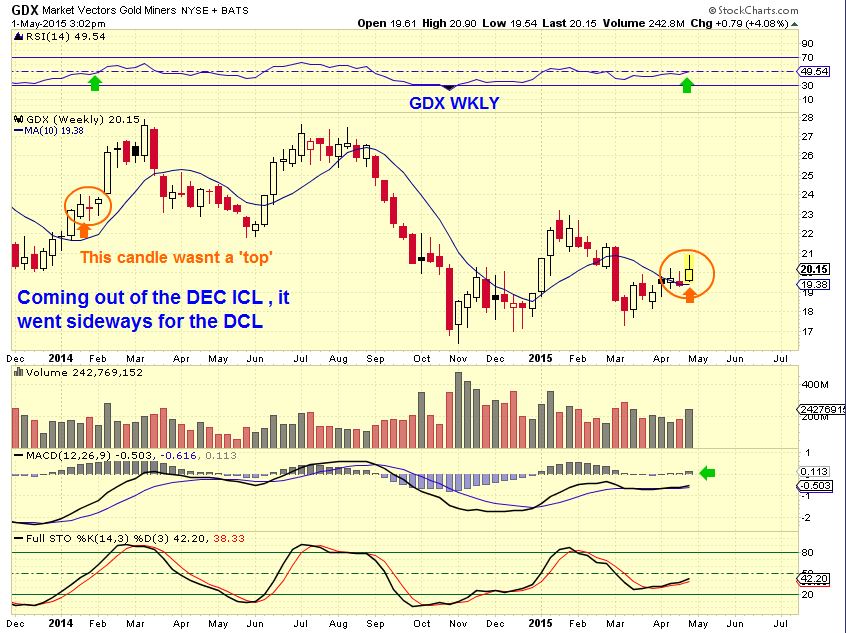
The GDX WKLY chart is overall bullish (so far). look at the MACD HIST/ RSI , etc. Was that a topping candle? After a long run up, it often is, but here? Yes, there was a wick on the top, so GDX hit a high and gave it up, BUT in the past this happened and it went sideways. See Jan 2014
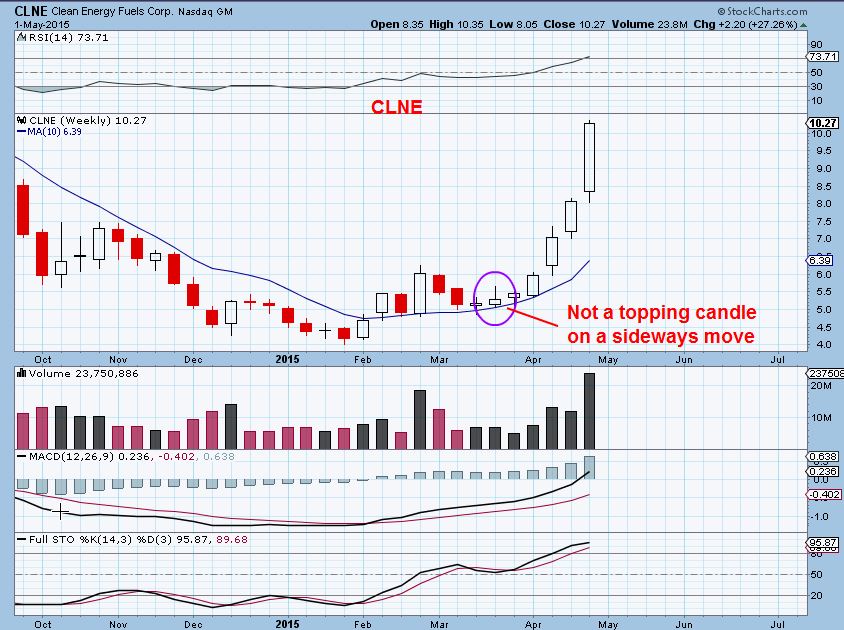
CLNE WKLY – was that a topping candle then, when it shot higher and gave it up by end of the week? See the GDX candle above again compared to this.
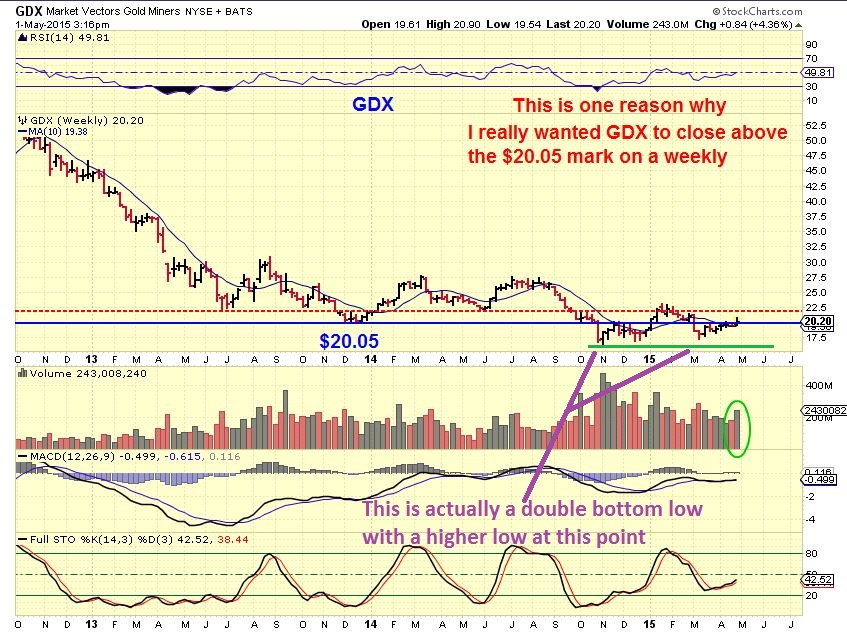
GDX WKLY 2 – I’d call this neutral to “O.K.”
CLUE:
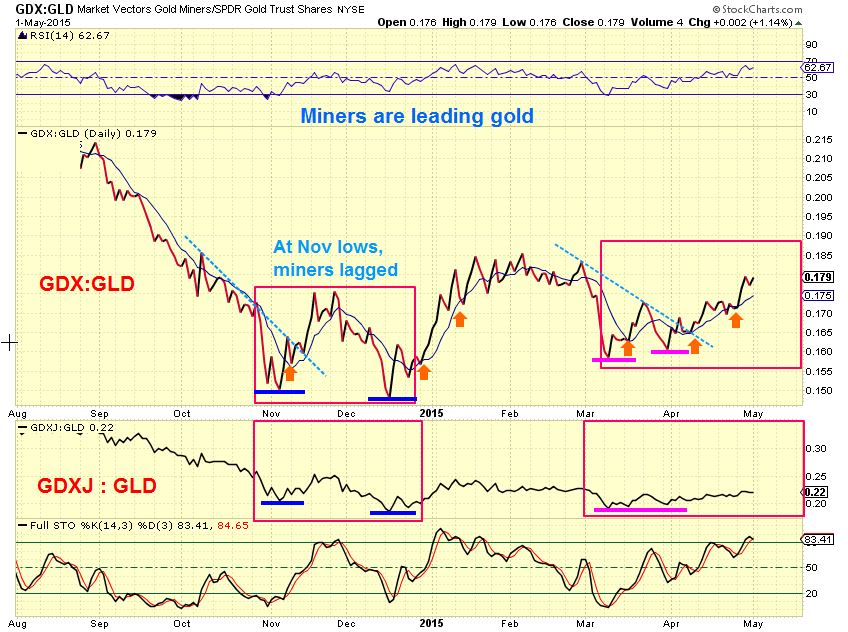
GDX :GLD & GDXJ : GLD– Miners are very much leading Gold. Bullish.
This leads me to something else that I looked into this weekend. I wanted to dig deeper, look at things from another angle.
Remember that I pointed out above ( when I said to take note) that-
1. OIL double bottomed in JANUARY , then MARCH.
2. The CRB double bottomed in JANUARY , then MARCH.
3. NATGAS just double bottomed.
What about GOLD?
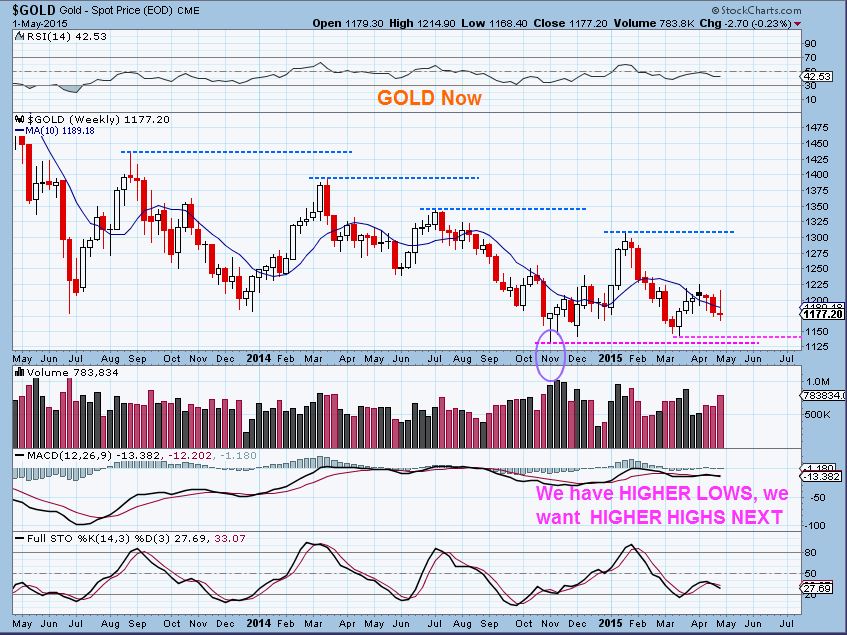
GOLD has made Higher lows (So far) and that means that if GOLD doesnt break those lows, it may have double bottomed FIRST . Initially in Nov and now with a higher low in March . Is that a big deal?
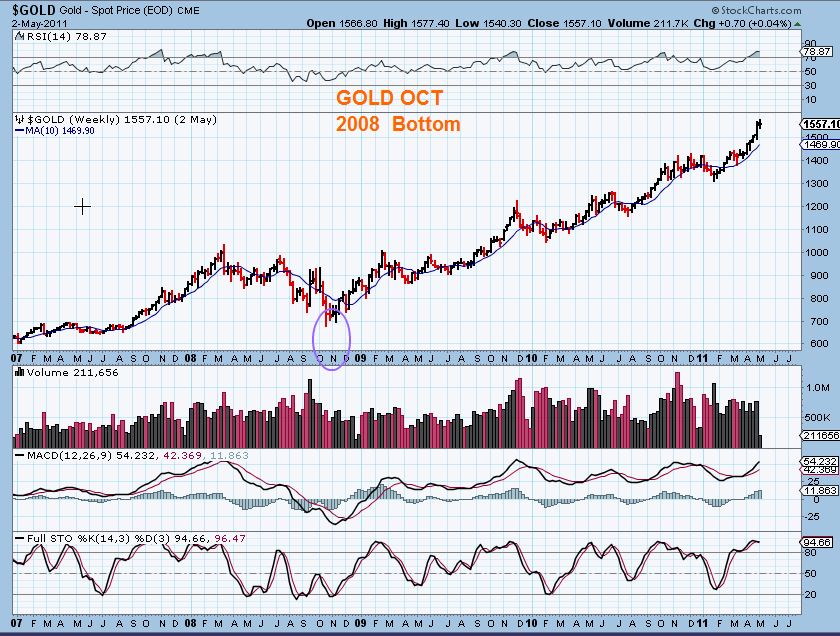
Well check out what I found in my research. In the 2008 Sell off OIL, The CRB, and of course GOLD/SILVER/MINERS were thrown out like trash . What bottomed first? GOLD did.
Then months later the CRB & OIL Bottomed. JUST LIKE NOW?
GOLD Bottomed first on OCT 2008
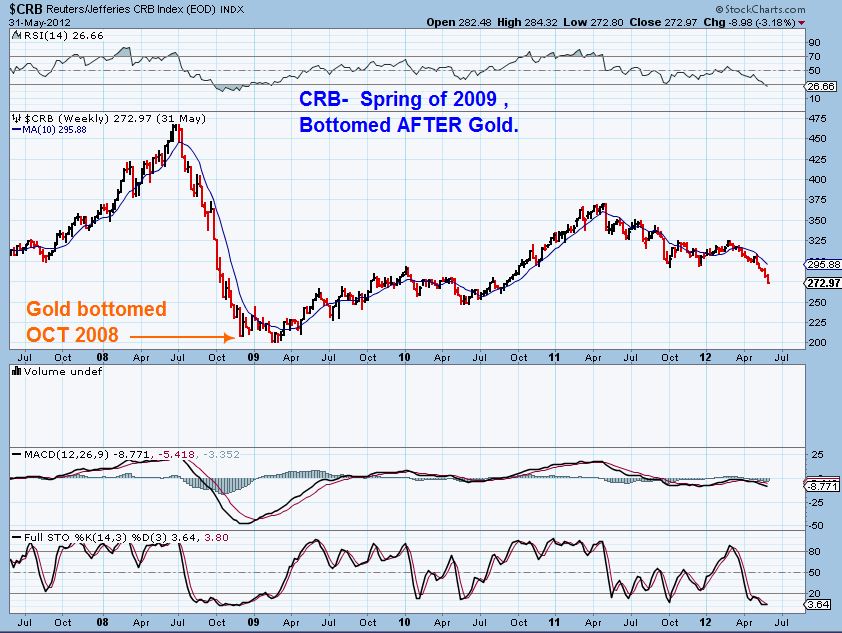
CRB LOWS were MARCH 2009 – months after Gold (like now?).
OIL Double bottom lows, Final lows were FEB 2009 ( after Gold like now?)
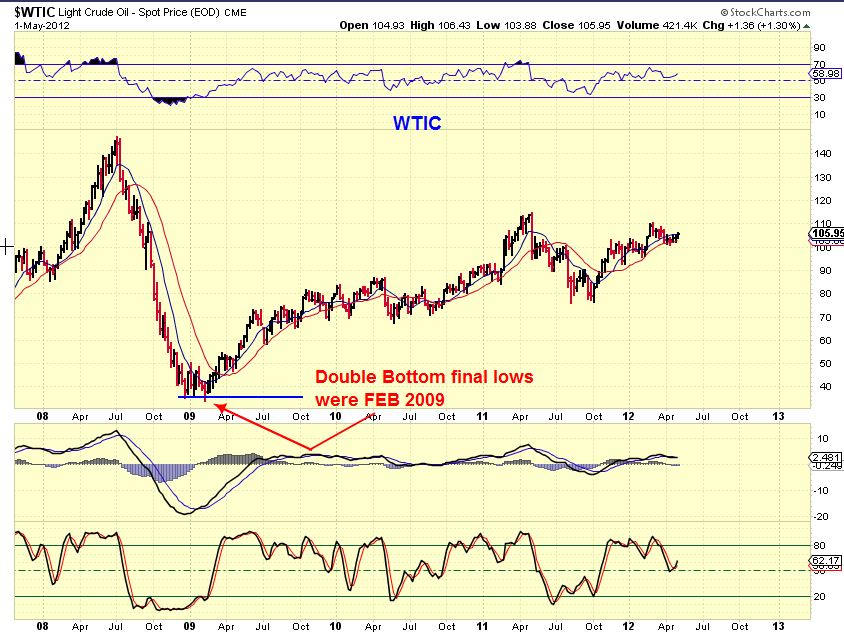
RECAP: So in the 2008 sell off GOLD Bottomed First in OCT 2008 , Then OIL & The CRB Bottomed early 2009 . So far we have GOLD bottomed in NOV 2014, OIL, CRB, NATGAS 2015.
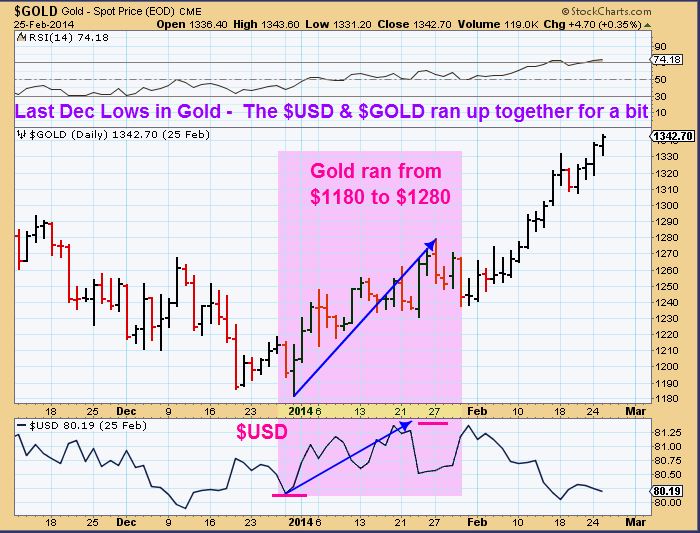
NEXT- ALEX, I thought you said the DOLLAR might bounce? Wont that hurt commodities? Often it does, at other times when they are showing strength or accumulation, they can resist or go sideways. If the dollar is just back testing the recent break down…They can resist. This is a chart of GOLD running higher with the dollar (Purple box, JAN 2014)
1. You can see strong reason to believe that if OIL bottomed and the CRB and NATGAS bottomed, DAG bottomed , and so on…GOLD just might have bottomed first, like in 2008-9. We have a higher low in place on a weekly chart. There are other Bullish factors, but time eludes me.
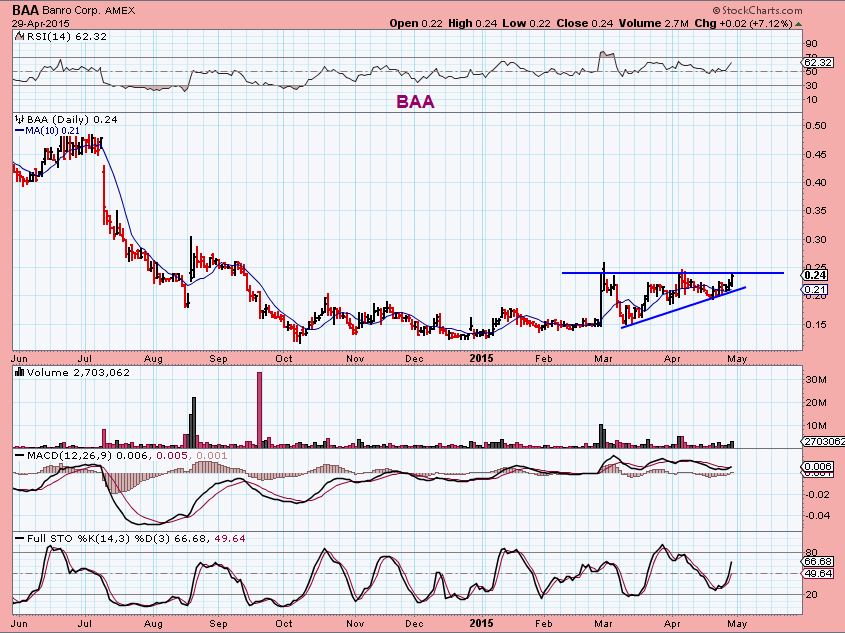
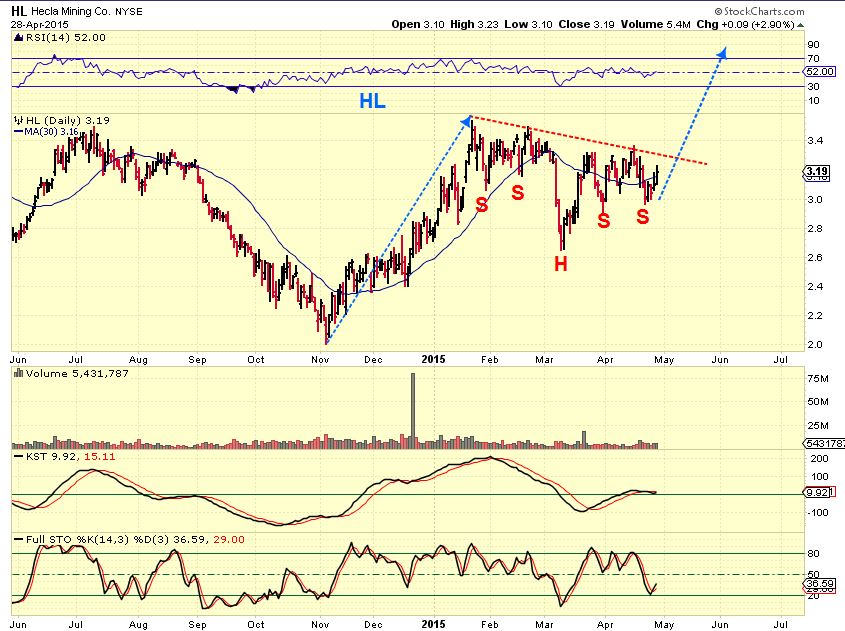
2. MINERS- I have seen and posted many bullish charts on Miners, and GDX is holding strong through EARNINGS for Miners. LOOK AT NEM. Strong. And I have posted these set ups & more recently, holding up while GOLD sold off.
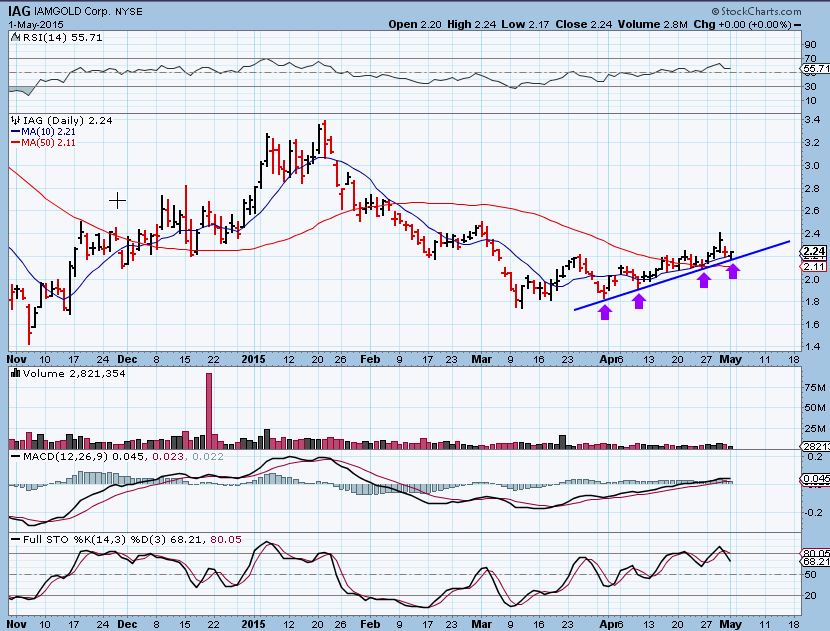
IAG Friday – recovered right on the trend line
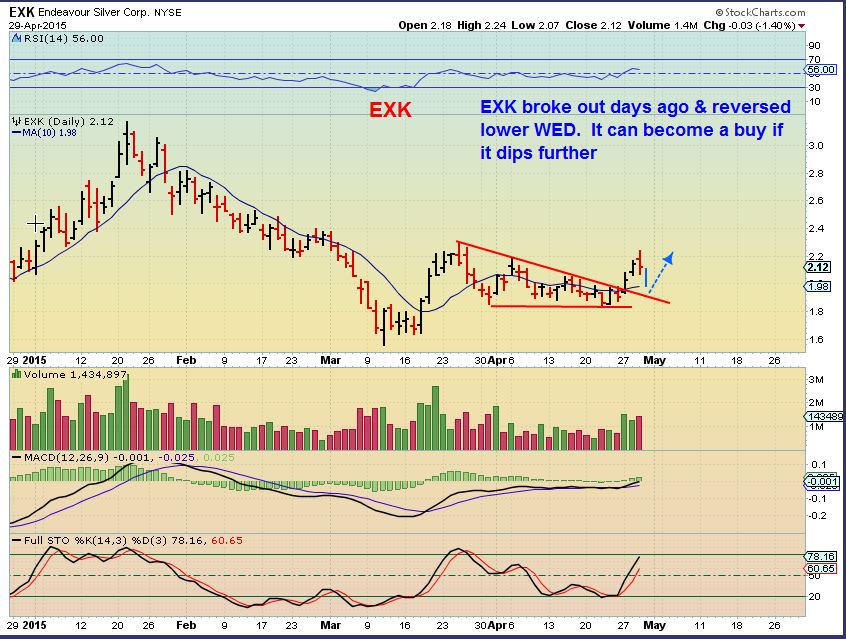
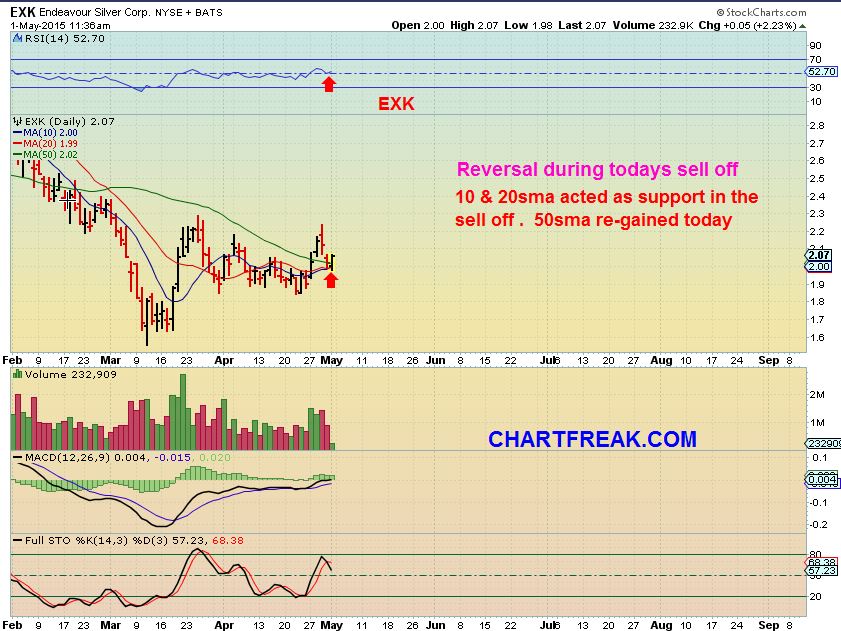
EXK FRIDAY – at 11:36 a.m.
Well, now we have to take the bearish side too , so we have reached …
-The “WHAT IF” part of our report-
WHAT IF GOLD plunges to $1000? I posted this rendition . Think about GOLD losing $200 points. Wow, it could even do that in 4-5 days capitulation, right? Down $40, then $50, then $50, then $60. Certainly that would kill any bull! ( Reminder: I still feel that GOLD might have bottomed ahead of OIL, CRB, etc., but I have to post this side too).
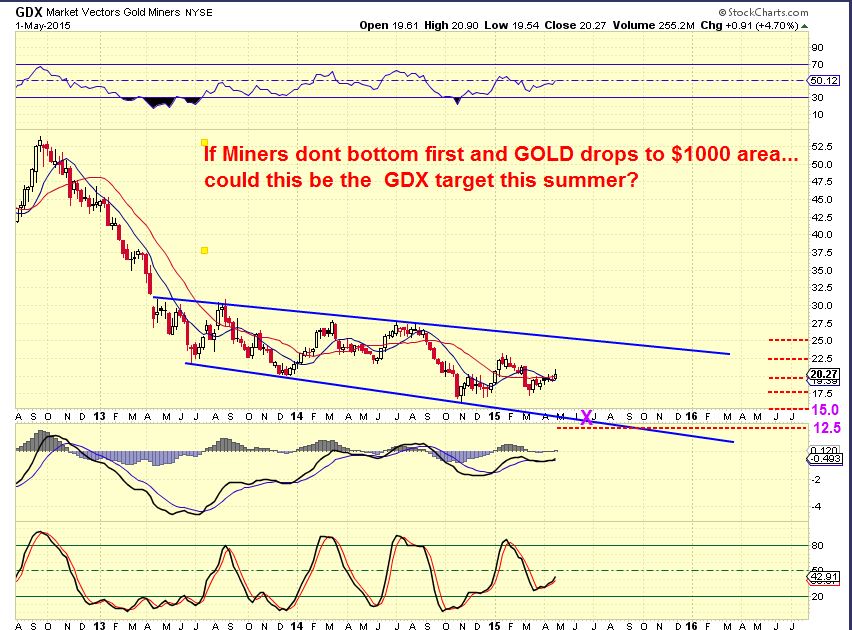
IF MINERS SELL OFF AND GOLD DROPS TO $1000, MAYBE we see this, X marks the spot. It’d be better to step aside and watch for the lows.
Let me show you something else interesting. Let me bring it back to the BULLISH SIDE. It pertains to SMART MONEY. What if you could slam Gold down like we saw the past 3 days …and then move in and accumulate positions in Miners while others are watching the METAL with fear and panic, maybe even continually coughing up their miners so you can scoop them up? Accumulation. If you could drive it to $1000, is it possible that Miners would still hold up, being accumulated? I think so,something similar happened before that way.
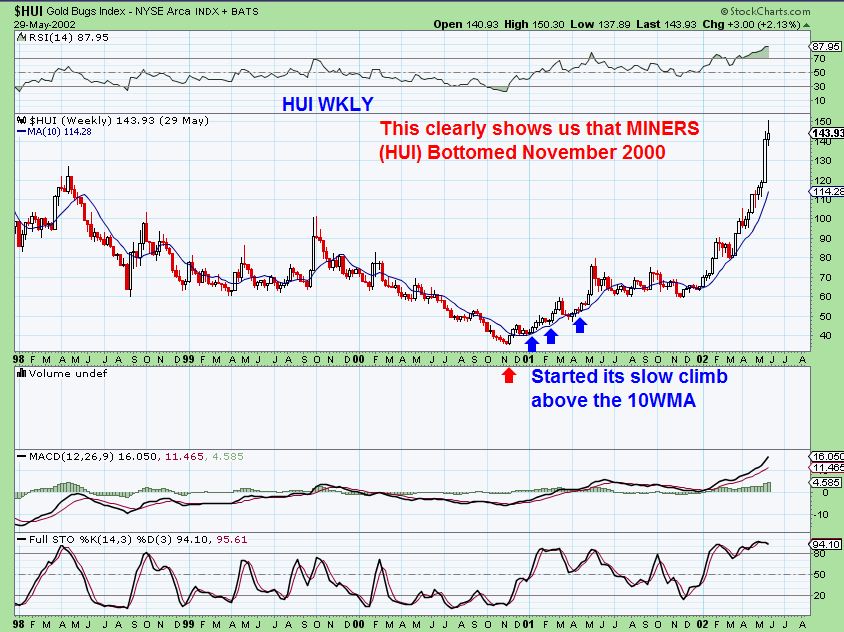
Check out MINERS ( HUI ) at the start of the Bull Market in Gold 2000.
HUI Bottomed in NOVEMBER 2000 – climbed the 10WMA & held up
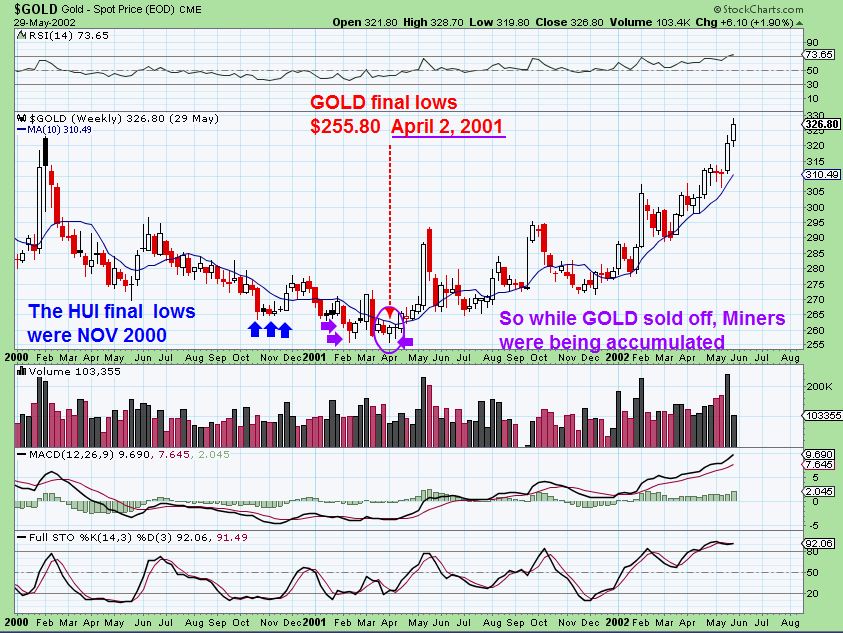
GOLD lows were not in until APRIL 2001. Gold bounced in Nov 2000 with Miners, but GOLD SOLD OFF further in Feb and again to new lows in April 2009. Miners went higher Jan & FEB (See above chart). Miners are currently not selling off with Gold now .
Am I saying , “Go all in…THE LOWS are in in Precious Metals !!!” No, but I am trying to point out the many things that are happening that are really bullish in the commodities sectors. GOLD/SILVER/MINERS are included. Some of the set ups in MINERS are as good if not better than the energy stocks we looked at in Jan – now. Likely, I’ll post a report like this and Gold drops $20 the next day though. The markets like to laugh at us from time to time.  I dont care, I think Miners , at this point, are Bullish.
So there you have it friends. Something to think about, something to recognize about past moves in the precious metals markets, and most of all…FACTS to steady the emotions. We all have them, but they can be trained. I honestly am bothered when I read write ups that get all emotional. They spread fear when selling occurs, and then if it changes, they blame XXXXX for doing it. Seriously, Markets Ebb & Flow like the ocean. They practically live and breath through human intervention and interaction. Accept it, study it, and learn to benefit from it if possible. Always be ready for anything, because anything can happen, thus we use stops.
What you see or what you focus on can affect your trading outlook . I hope this pointed out some really bullish possibilities lining up in Miners. Bases and consolidations occur and take time, look at our past ENERGY trades . Straight up? No, but we learned a lot about how they can move and still remain bullish from Jan to today . Lets watch the Metals & Miners a little closer now and see if we can either buy the dips or enter at other low risk set ups , such as the ones I have recently been pointing out lately.
Best wishes and I’ll be looking for trades to share in Tuesdays report if anything catches my eye
~ALEX
Now that you have read my report ( it is important to READ it , it is far more detailed), for those who want a brief audio recap- Please …
LINK: Right Click this link / then click “open in a new tab” / CLICK where it says “Download” and then ‘OPEN’ / When you here my voice , Pause it and come back to this report and scroll up to where it says CLUE: about 1/2 way up at the yellow chart for GDX:GLD. then start the recording & follow along.
* This above link may be time sensitive. It may expire in a day or two.
P.S. For newer readers, I want to welcome everyone here and mention that there is a comments section below each report where some have shared ideas , asked questions , etc . Feel free to join in or just check in there for added info. We have a good group of traders on board. Thanks for being here.


Alex, I concur with Your points on the metals/miners. You always bring up items I have not thought about. You have a gift of noticing things missed by others. If we can sell off in the metals and miners continue to hold up by mid week ( stay above 1142 ) I am looking to buy if the signals are there. Have a good week.
Hi Shermo, Thanks. I love to dig into the details and see if there is anything that I may have missed. After digging in this weekend, I just felt that things are lining up bullishly in Miners, despite the weekness that seems to be in Gold.
Now I’m watching everything for more clues.
From a purely cyclical view if the intermediate cycle has topped and the bearish view were to play out it would probably do so in a very gradual and whipsawing pattern over several months rather than a big whoosh down immediately, as the intermediate cycle is still very young. Presumably the whoosh would come at the very end if the 1130 support gets broken.
It might look something like this. And if the miners could stay in a consolidation and not lose too much that would be a very bullish sign IMO.
I agree that Miners holding up (as they have lately ) while Gold is weak (like I pointed out in 2000) would be bullish.
In 2000, the Miners rose very nicely from Nov to March, while gold hit new lows.
It just seems so VERY early for The Intermediate cycle to top and yet Miners look so bullish.
Cycle counts were messed up in NOV-DEC , maybe were getting more of the same. I have other ideas how this could play out, but the report had enough for now : )
Keep in mind that the miners can be effected negatively if the general market sells off, even with gold going higher.
SUPERB report!!!! Thank u. 🙂
Thanks Maria – appreciate it
Alex, Great Reports as always 🙂 Is Twitter close to a buy yet..any price point I should watch for ? Thanks.happy trading !!!
Hi Ash, (refresh for a chart)
TWTR looks like it wants to bounce from here, but I personally wouldn’t buy it. You can if you define your risk, it may make a lower low..
I want you to at least recognize that even a good company can come out with bad earnings and get clocked like this….and then rise and drop repeatedly forming a base again before recovering.
I bought ULTA after the crash in Dec 2013. It was a great company, they released earnings and got clocked, so I bought some. It is up 100% now 1 1/2 yrs later, but please look at how that bottom formed. It bounced and then made a lower low. Scary. It was grueling for me to hang on in that 9 month base. You may do the same with TWTR
Thanks Alex , I will continue to wait out Untill strong base is formed to go Long on Twitter, i have an eye on BTU for a swing trade..does it look like a double bottom.? Let me know when you get a chance to view charts.
I see ACI as a double bottom on a 1 yr chart. BTU looks like a bullish descending wedge though.
AMCC starting to look real good. Jumped up above the 50 DMA on real good vol for several days. No position yet.
I agree…That looks really good with that volume.
Good Morning,
I have Harvested additional profits this morning on many of my Oil stock positions that have Earnings coming out this week…..I do not want see my double digit profits eroded because of those reports……I will reload again in the near future. 🙂
Excellent job. Nothing like “double digit profits” to make one feel good about the trades 🙂
Thanks Alex…..but I have give credit where due, You opened that door ! Thank you for that.
Now just watch those Earnings will be Fantastic ! 🙂
My example of that was BAS had good earnings and I was on the sidelines for that. CLNE was also on my radar and missed it.
I Still made great gains on Bass (And it will almost NEVER be selling at the exact top) , but it does hurt a bit to watch it run upside with out us. Then again you see ome get smashed after earnings and your glad you cashed in. I think you did the right thing, as you said, you can re-enter later.
Yea….TEX got me last week, probably why I am a bit gun shy….lol.
Not to mention USO is right at the Trend Line…..if broken Oil might be starting wave 4 Down in a A B C correction.
Just my 2 cents worth. 🙂
Of course therein lies the question of whether to analyze an ETF that’s derivative of the underlying, or the underlying itself; i.e. $WTIC in this case. I think the latter, but admittedly have not done long term analysis on which is more effective, so I’m open.
I think it’s analogous to analyzing a leveraged ETF vs. the underlying index (or at least an unleveraged ETF e.g. SPY)
You definitely have a point Onlooker…..and I think Alex will agree with you ?
But……In this case USO, in my eyes, is a much Cleaner look when looking at it EW wave wise. I caught most of the 3rd wave and now “maybe” most of the 5th wave…..my count “seems” to be working so far.
If it wasnt for the Earnings coming out this week I would most likely be holding a bit longer but that is not the case.
FIVN looks interesting. I’m watching it.
ALEX…. hi, I’m thinking to sell FNV because I have some 1000 dollar profit, but I don’t know if this is a wise decision, where is resistance on FNV ?
FNV broke above the 200sma and prior short term resistance Friday. It can run to January highs , but it could also test the break out at the 200sma Friday first too.
For anyone interested in CLNE, getting hit on profit taking. 10DMA is at $8.74
If it gets down there and shows signs of life, night be a solid buy, will add that to watchlist, thanks!
P appears to be bouncing off of the 20 DMA nicely today. Could be a very nice entry point here.
Miners underperforming versus metals today after strong open. Probably b/c they ran ahead some on Friday?
Solid day for KEG here with oil down moderately.Way out ahead of all moving averages, may add 1/2 back in in event of controlled pullback.
10DMA is at $2.27. Looks like it’s been riding that on its upmove. Might be a good spot to add at about $2.30 if it gets there.
I have a limit buy down at 20 day, but will re-assess this week, thanks for the input!
Alex, what do you make of this action in miners today? Not much follow through but I guess that’s to be expected after many popped higher last week. I think we can expect another dip in gold overnight, however.
Sorry, There isnt much to make of it yet. As I mentioned in the report, GOLD was down $50 Wed-Fri, GDX wasnt down much.
GDX gapped open and dipped down and filled todays gap. Its still above the 50sma by quite a bit, so I just look at it as normal consolidation so far. If it breaks down…Or breaks out higher is when I’ll know more.
Thanks.