
Things Are Popping
As expected , the Fed Mtg Wednesday caused several areas of the market to really start popping. There is so much to cover this weekend, so lets get right to the (29!) charts…
Starting with IWC – As pointed out over the past several weeks, This is a bullish looking set up
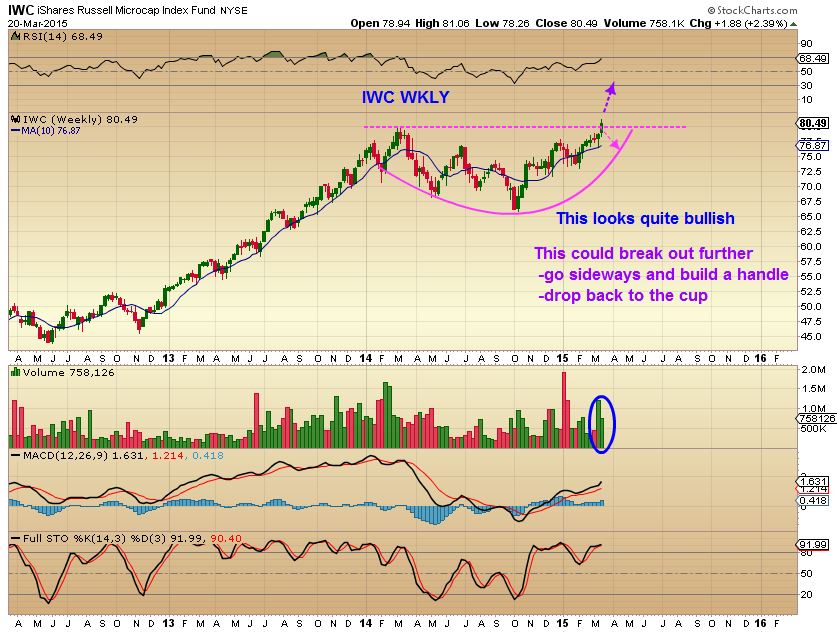
Another Bullish looking set up is he following chart…
IWM – So small caps and Micro-caps that were dropping & going sideways while the SPX, NASDAQ, and DOW were running higher in 2014 , have shown some nice strength out of that consolidation lately.
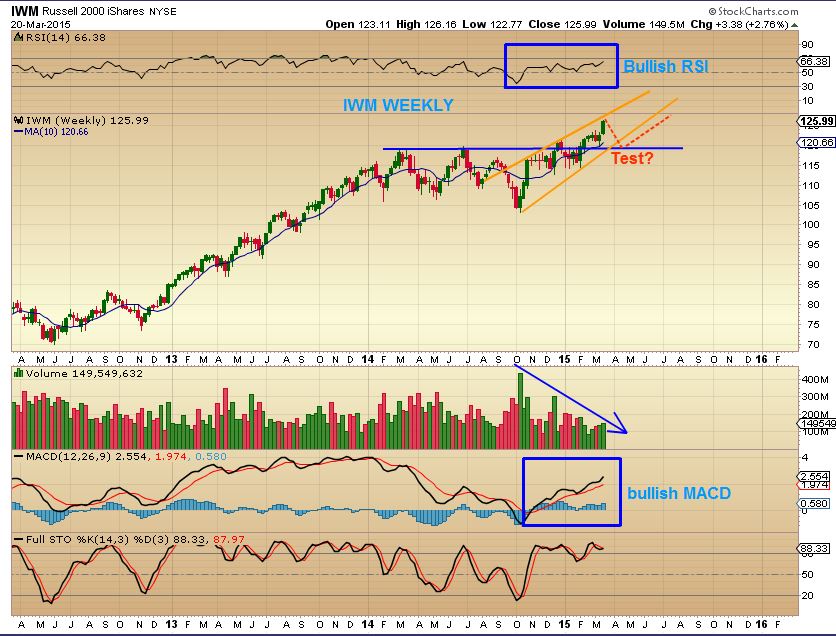
IWC, RUT, IWM …Looking like they’re ready to break out & run higher. I am trying to reconcile that with the fact that he regular markets look like they may pullback soon. So do these break out & Back test the break out as The Dow, SPX, and NAZ pullback a bit? Or do they run while these other markets consolidate, since they consolidated while the others ran in 2014? Time will have to feed me some more clues.
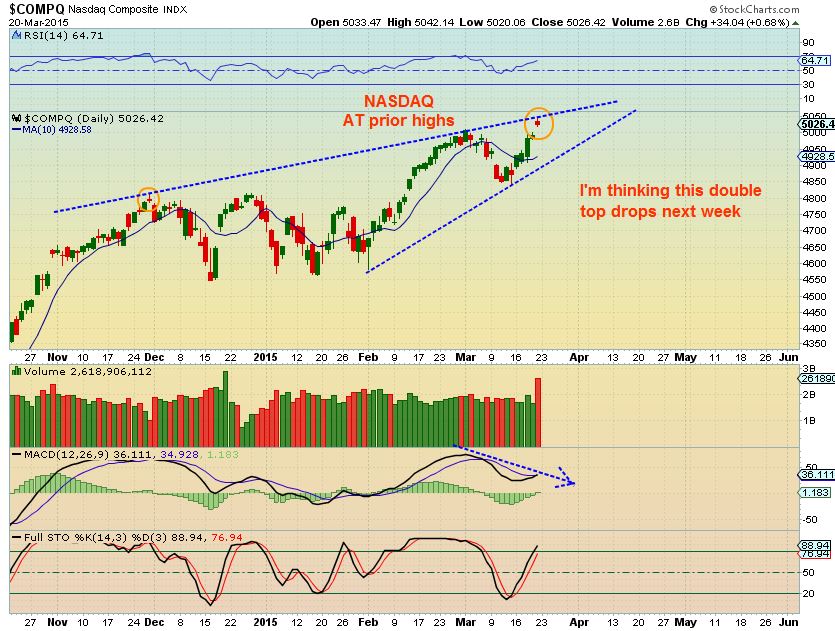
Here is why I am thinking we see a pullback soon in the DOW, SPX, NAZ-
NAZ daily looks like a temporary top
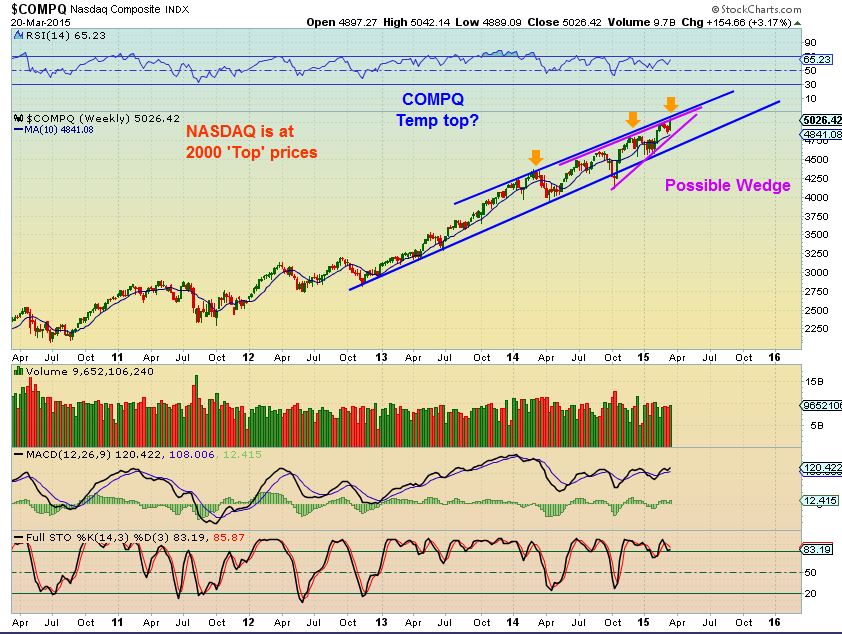
NAZ WKLY – Purple Bearish WEDGE? Top of the trend line?
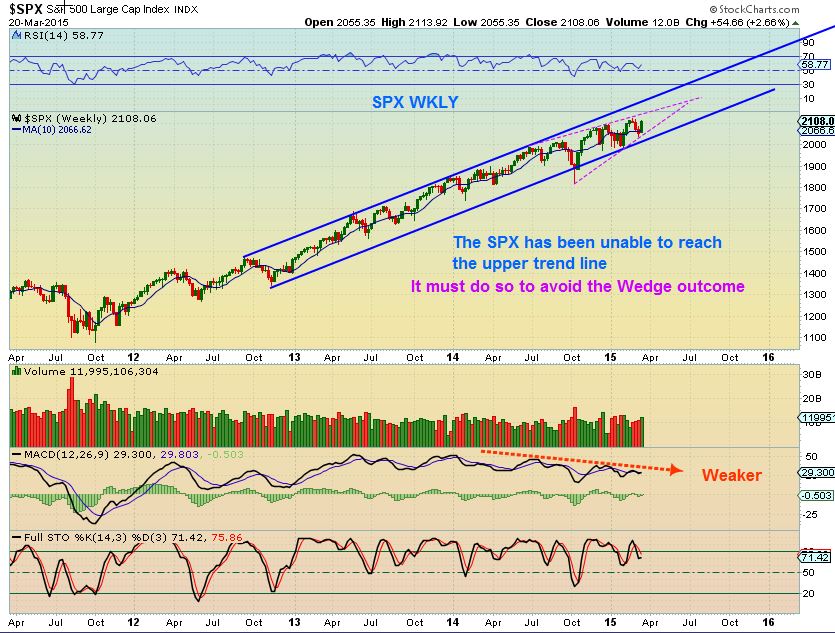
SPX – WEEKLY WEDGE almost complete
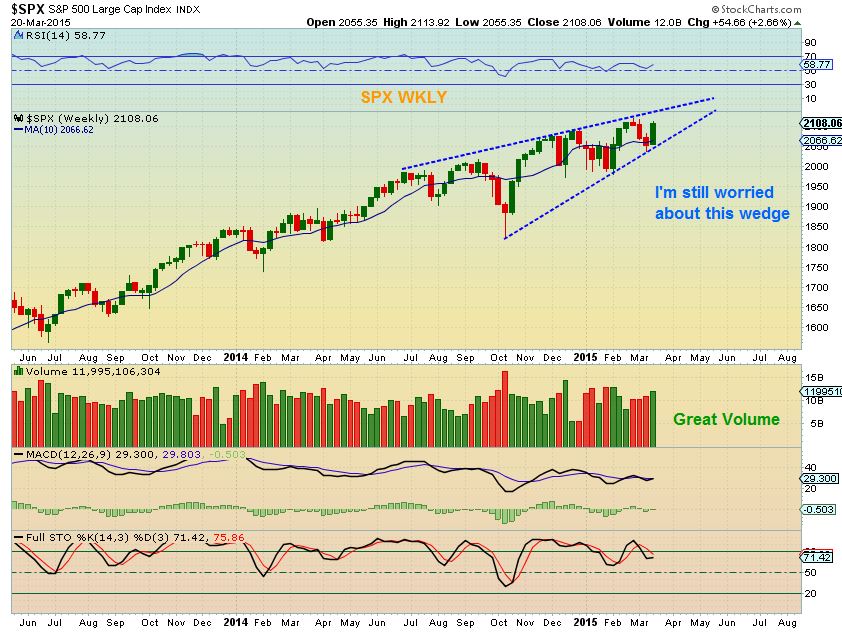
This look at the SPX PURPLE WEDGE shows that
A RAPID break higher would negate this wedge pattern, but it’s less likely. The Wkly MACD seems weak.
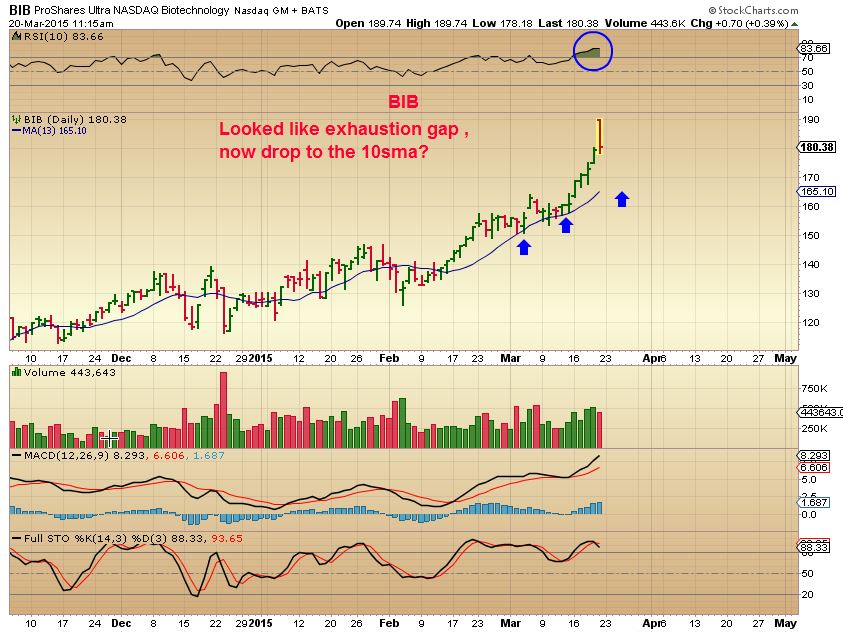
BIB– Also the Uber Bullish Bio Techs looked like an exhaustion type top ( can be temporary, but a top for now). Might be a buy at the 13 sma.
SO EXPERIENCED TRADERS – those able to 1. watch positions 2. Look at their own charts with out my help ( To see the wedge pattern as it tops) 3. Change quickly in case it pulls back for 2 days and bursts higher ( less in My Opinion) – may want to look at SQQQ, TZA, SDS, DXD as short positions when the WEDGE fulfills.
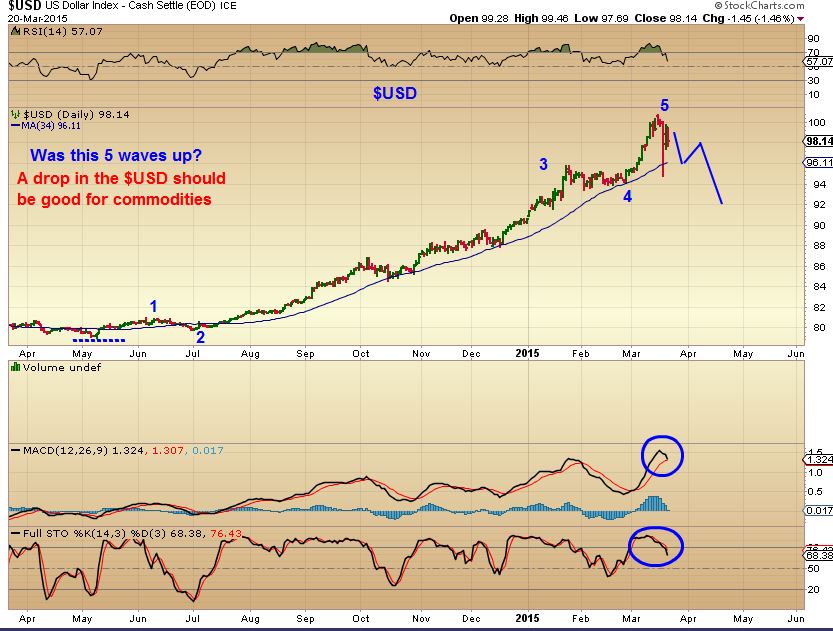
The $USD went crazy with the FED announcement, leaving this crazy wkly candle. Was that 5 waves up? Very strong move , It looks due for a pullback . ( I know, I’ve said this before  – I admit that the $USD has been tough to call a top).
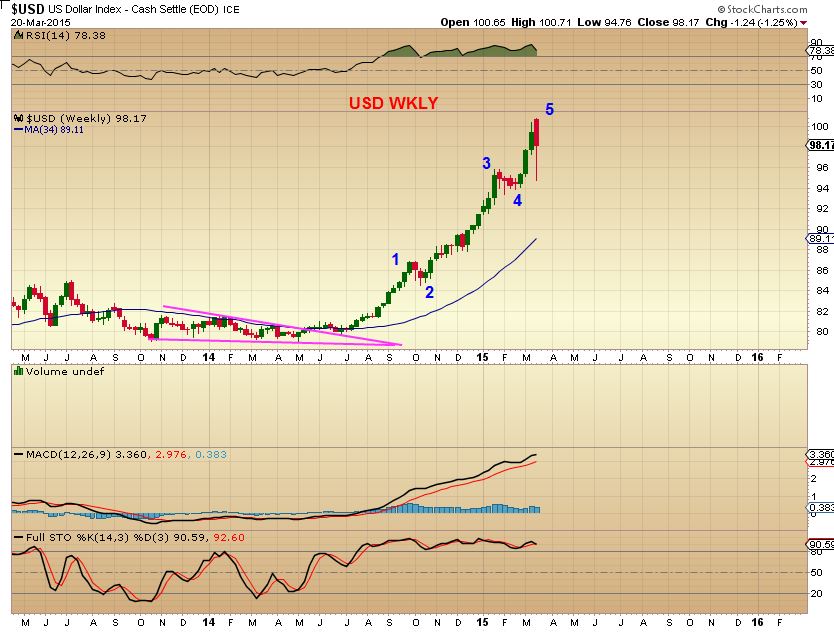
$USD DAILY – That wave 3 looks like a stretch ( pun intended) , so is the $USD finally going to drop? I think this would help commodities and I must say…. as mentioned in my prior report, Commodities are really looking good as far as possible bottoming action goes.
I have reported ‘bottoming’ evident in various areas (Commodities – $CRB, NATGAS, OIL, GOLD/MINERS , even CORN, WHEAT,DBA, JO ETC) Again, Bottoming is a tricky process, and all bottoms do not look alike, but various characteristics can be seen by the watchful eye. Again- Lets look at some charts.
NATGAS – Still Ok, but just wont get going as fast as we’d like, because now it’s reaching overbought on the stochastics . Do you recall the OIL dip to a ‘stop run’ new lows ? HMMMM? Could this ride down that trend line to new lows and then be a buy. I cant tell for sure.
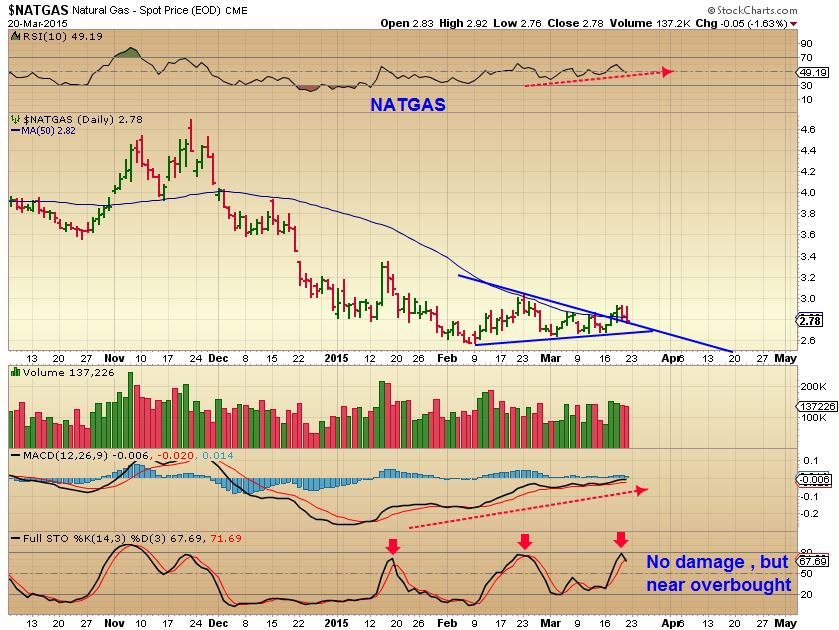
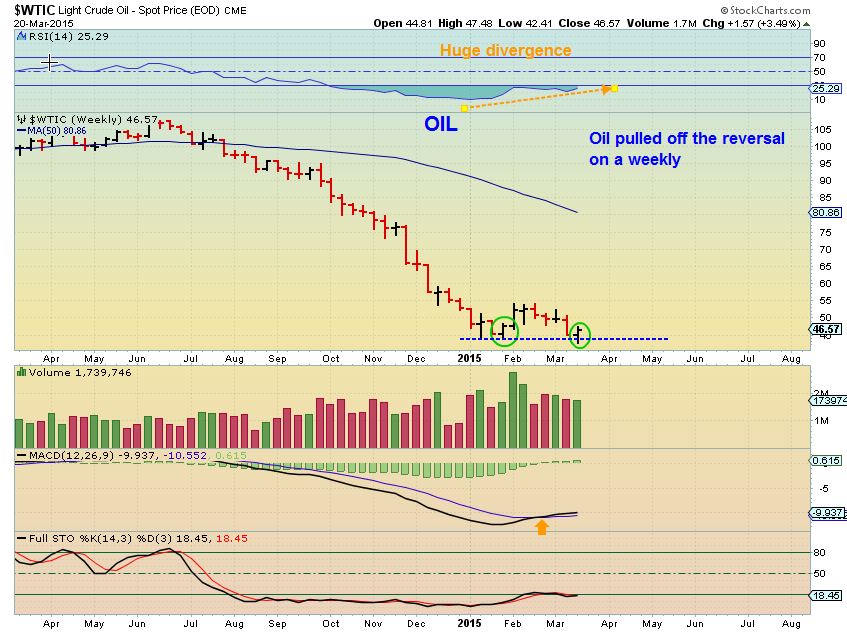
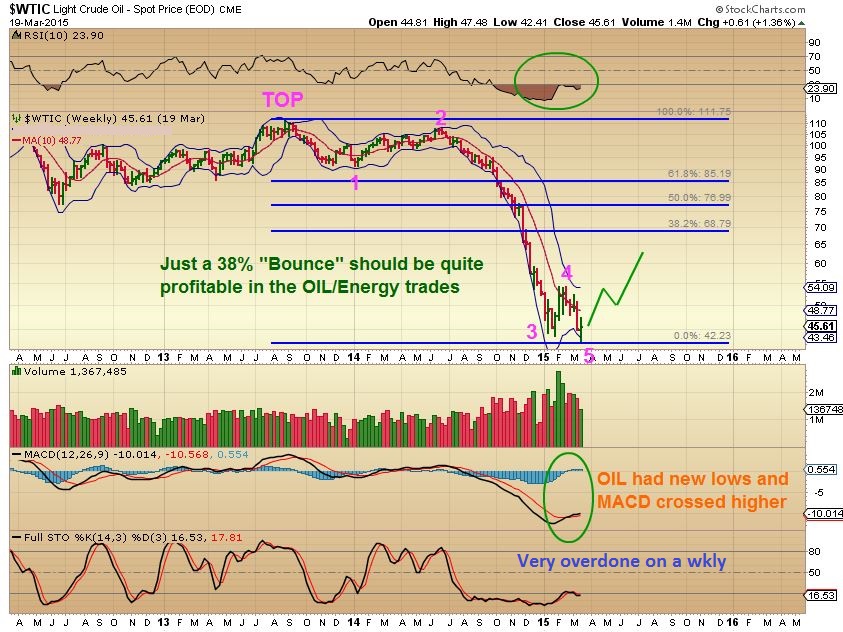
Speaking of that, here is OIL’s stop run on a wkly. ( Will $Natgas do this next? I honestly thought lows were in for Natgas)
OIL DAILY
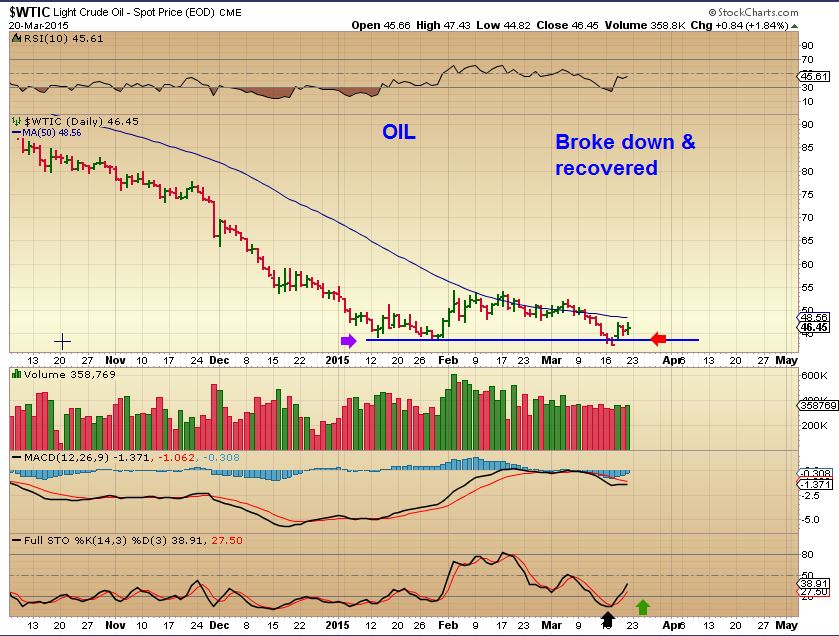
LET ME WARN anyone in UCO,USO, UWTI or bought calls in OIL thinking that we just go straight up from here. We dont always do so. We can if we get a burst of short covering, but I have seen many bottoms form this way if this acts like other Stop run lows…it can be very tricky. I’ll just show you the GDXJ lows , as GDXJ did a similar dip to new lows / recovery .
– Please note: Broke down to new lows on DEC 15 , then recovered, and dipped for 4 more days ( Yup, that’d be all next week) 
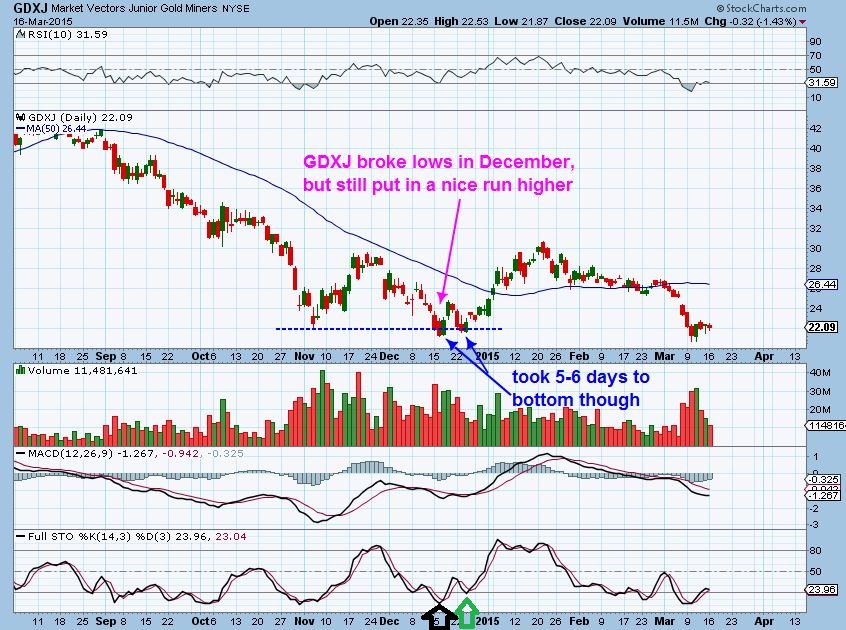
DO NOT GET DISCOURAGED… this looked like 5 waves down now and a simple bounce in OIL could be HUGE %-Gain
This chart ( from Thursday) also shows that XLE looks to be bottoming
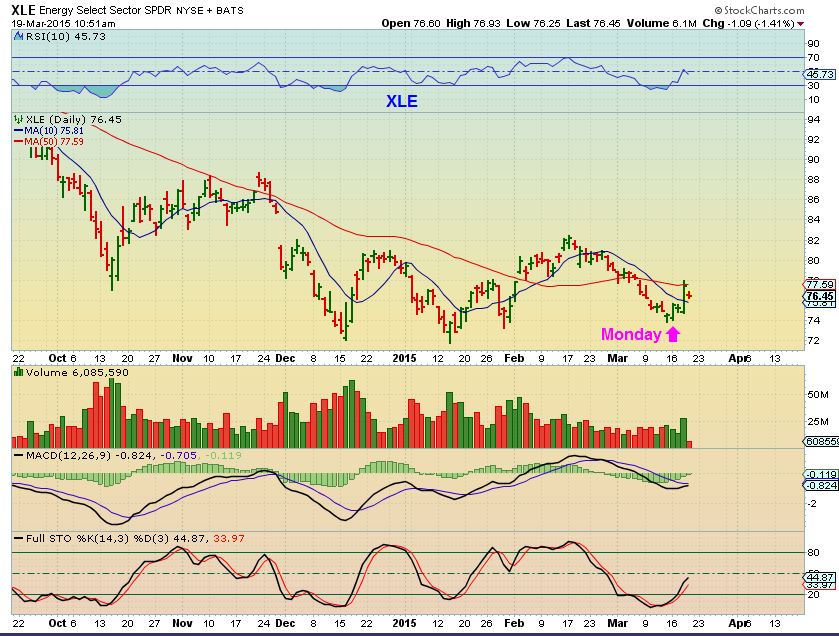
Each individual Stock in the Energy sector will likely do its own thing, just as the MINERS did in the gold run Nov to Jan . Remember how CDE, GFI, HMY , etc etc did great ( 100%) yet others seemed slower? I cant say why other than “demand” & maybe some short covering. I will also say that some of the best fundamental Miners underperformed by far CDE , GFI, etc I mention this because some were asking about EXXI rallying with OIL Friday , but REXX , SFY not etc. I own and was disappointed in REXX too. I think if OIL rallies, they will do good, but I’d say You’ll have to manage our positions based on individual performance as time goes on.
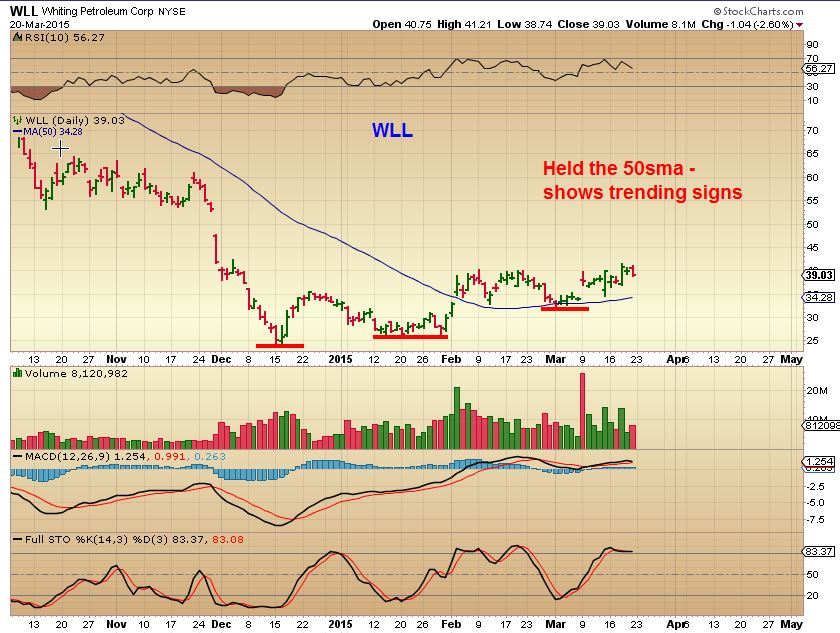
Look at WLL & PXD– These are acting nicely, because they’re just trending higher. You may want to find & buy those on pullbacks. please look up PXD.
Also I look at PACD & WPX ( & SZYM) – they haven’t done much more than base out so far , but look ready Now.
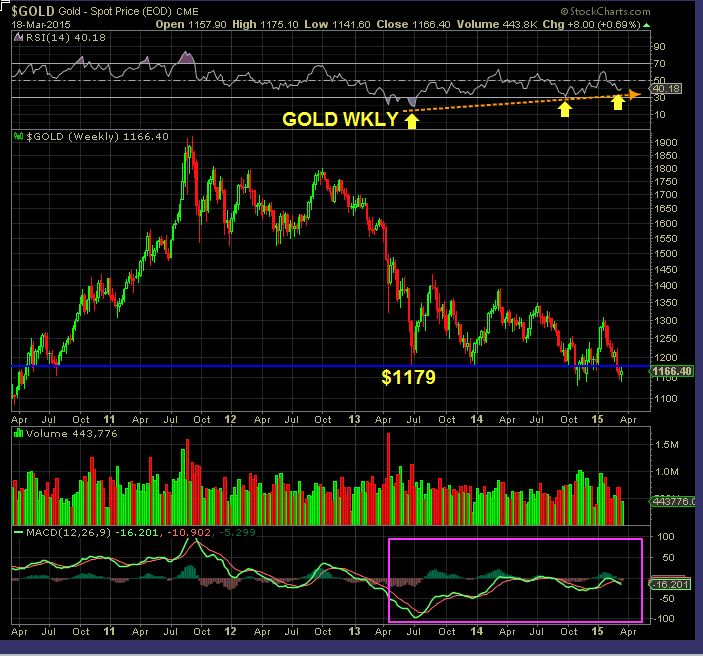
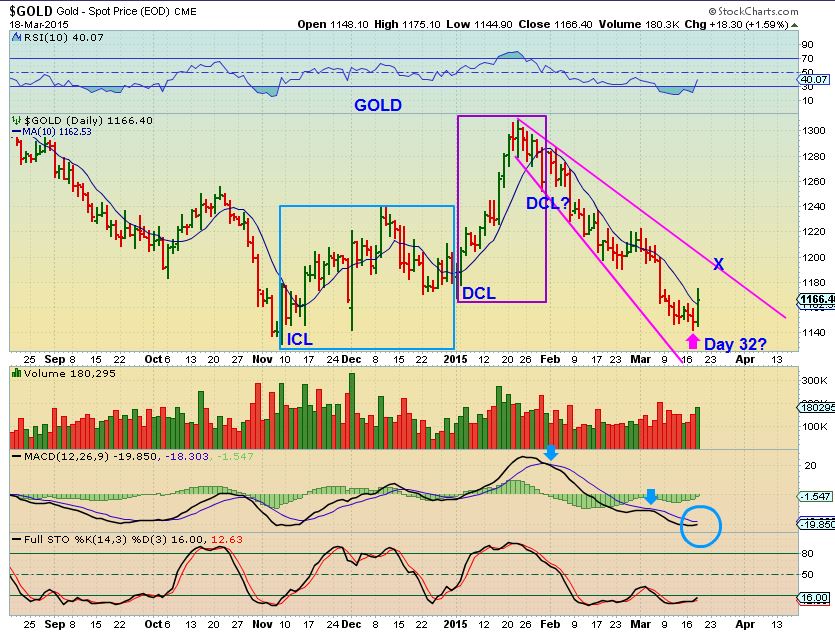
GOLD – On MARCH 18 I was pointing out that we really needed a rally in GOLD WEEKLY is to get back above that $1179 June 2013 lows. These shake outs need to recover.
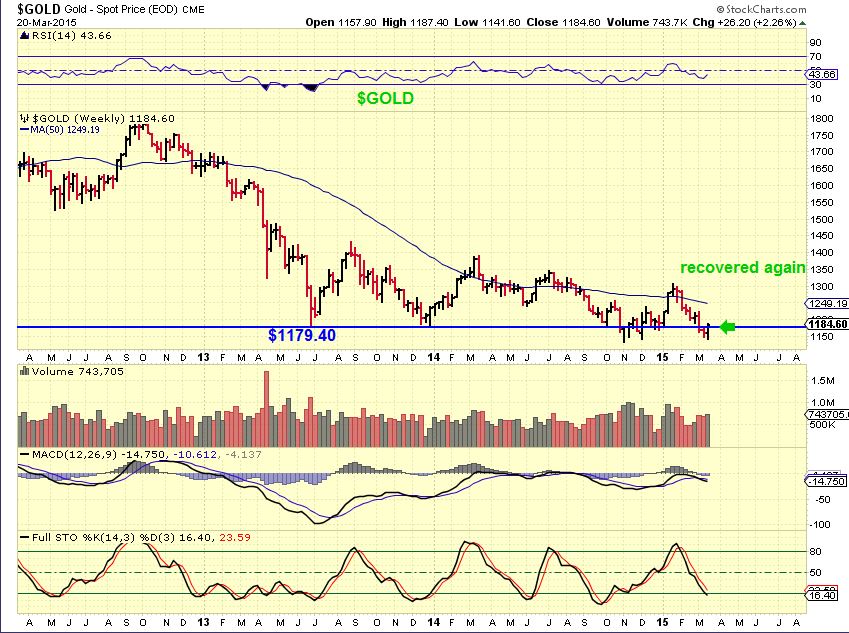
GOLD WKLY recovery !
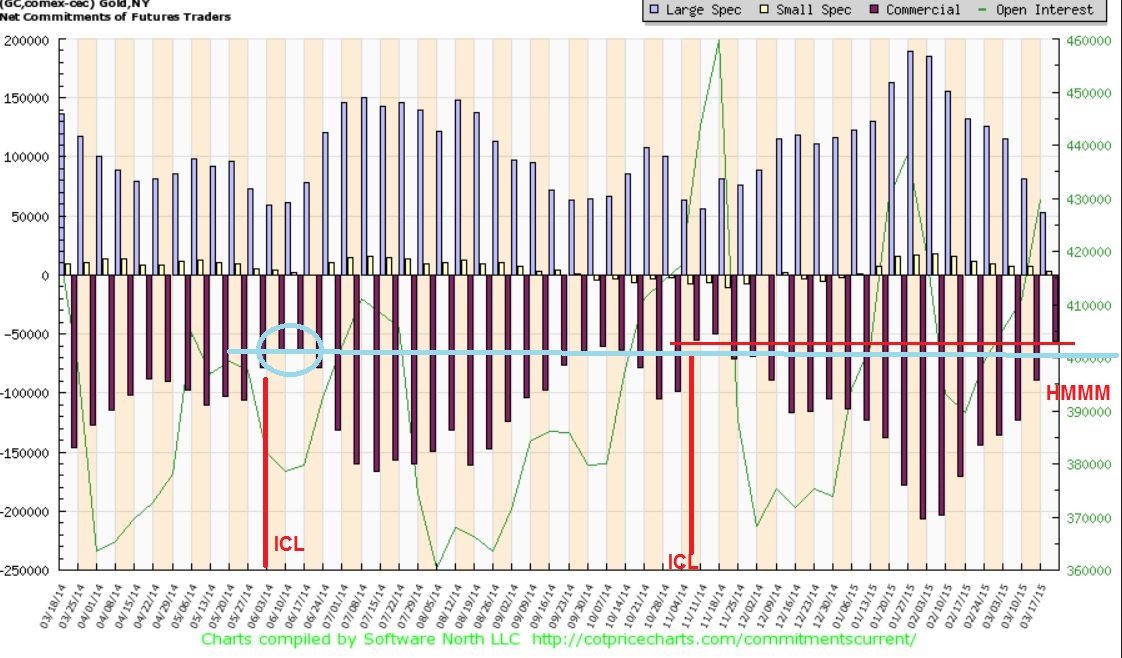
I am actually a tad torn about this being a new daily cycle or… those deep meaningful lows called an ICL? There are a few reasons, but I want to play cautious vs All in. There will be time for that later as we watch this unfold. Whats Bullish?
This C.O.T. as of last Tuesday has Commercials where prior ICL’s happened. WOW.
Let me show you more BULLISHNESS for GOLD
March 11- I was looking at about $1180 -$1190 area as a target before we roll over if this is just a Daily Cycle low
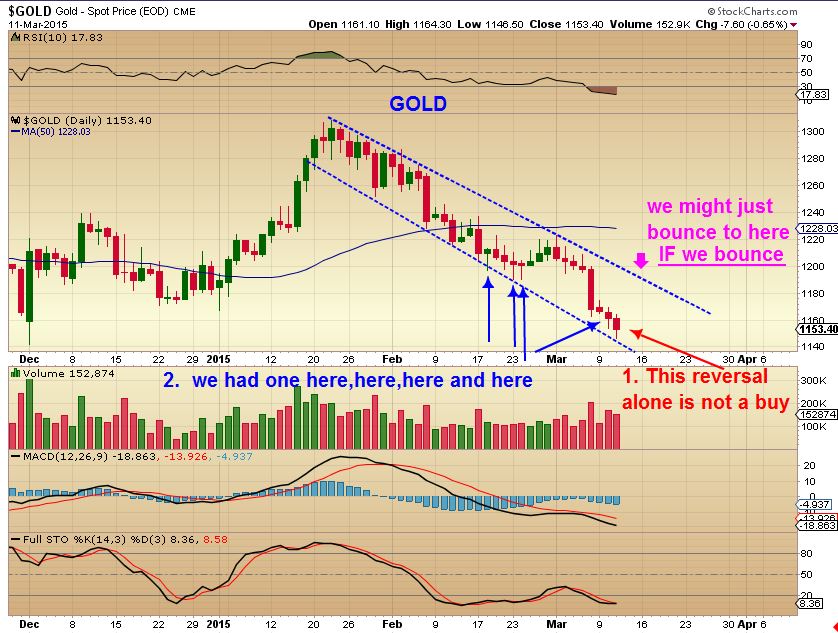
MARCH 18 – I said it again, and didnt expect a MACD cross.
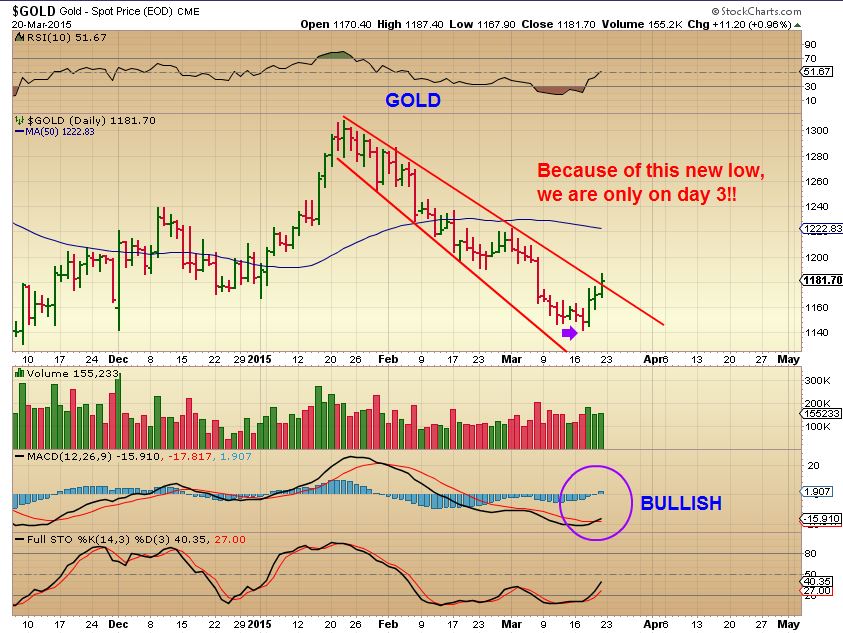
GOLD NOW – This is a Bullish looking chart , and only day 3, MACD crossed.
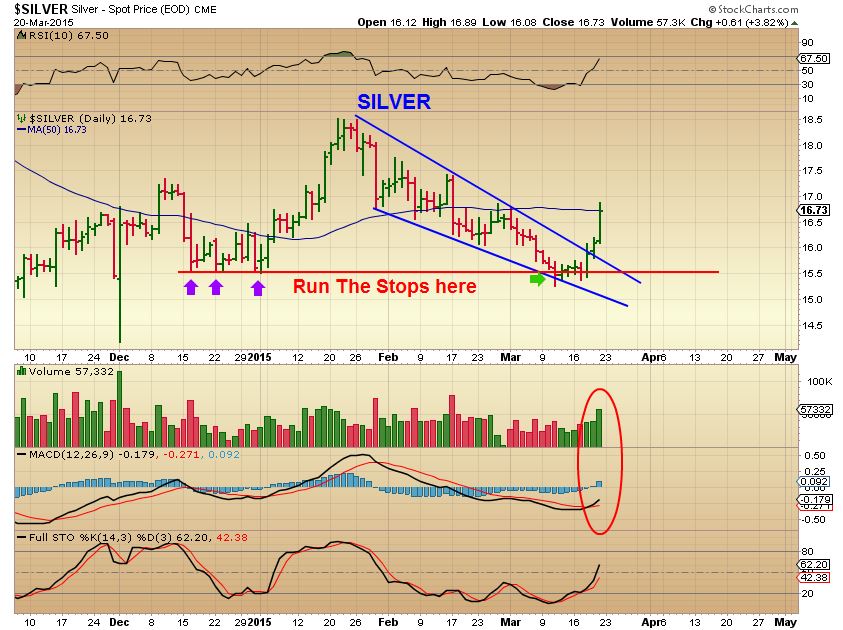
SILVER – March 11 I mentioned that they ran the stops, could be the lows.
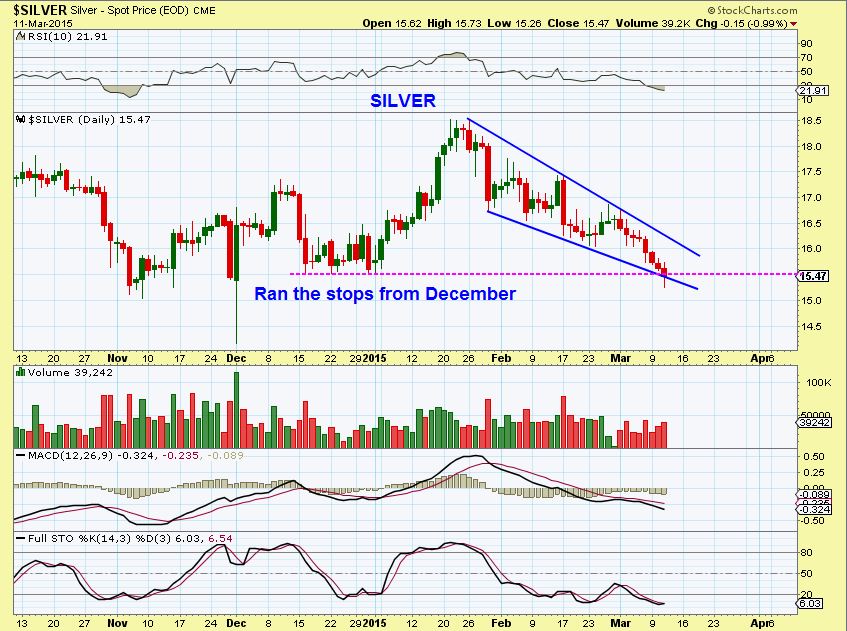
It was the lows , but I’ll admit that that sideways move was tricky.
Looked like a possible bear flag until the FED MTG – Very strong POP Friday.
GDX – I posted this on Twitter Friday & our comments section as an area of interest. GDX bottomed first ( before Gold) so it is on day 7 . It should top at the gap or trendline if this is going to roll over. IF you see this pause, run up & break out on lets say day 12? This isnt likely a weak 3rd or 4th daily cycle.
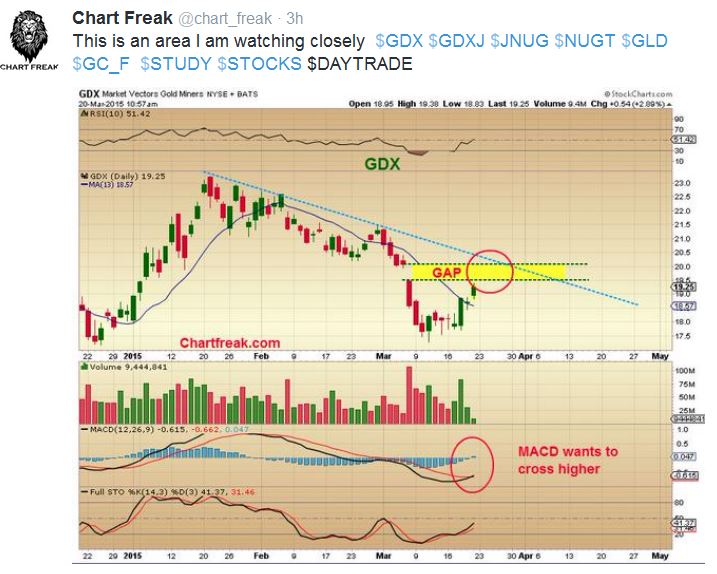
I bought & sold my NUGT position – holding from End of the day Wed to Friday , but I have to wonder if we get something more from this.
For instructional purposes only :
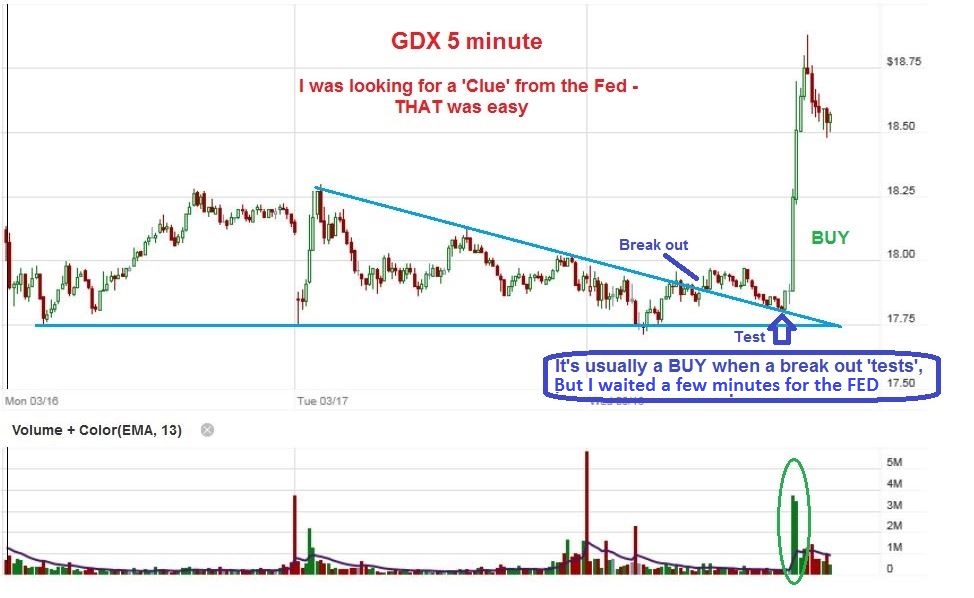
GDX/NUGT was too risky & moves way too fast for me to trade & post here real time on a FED DAY. As a Trader, I bought NUGT on the FED day break out & SOLD IT Friday for a trade using these 3 charts. I copied them real time to share as an instructional on how I trade using smaller time frames ( 5 minute / 15 minute), so maybe you can do the same someday if you dont already. I watched the break out & Test before the fed.
Break out from this wedge / triangle – then it starts a pullback. Enter as it shoots higher.
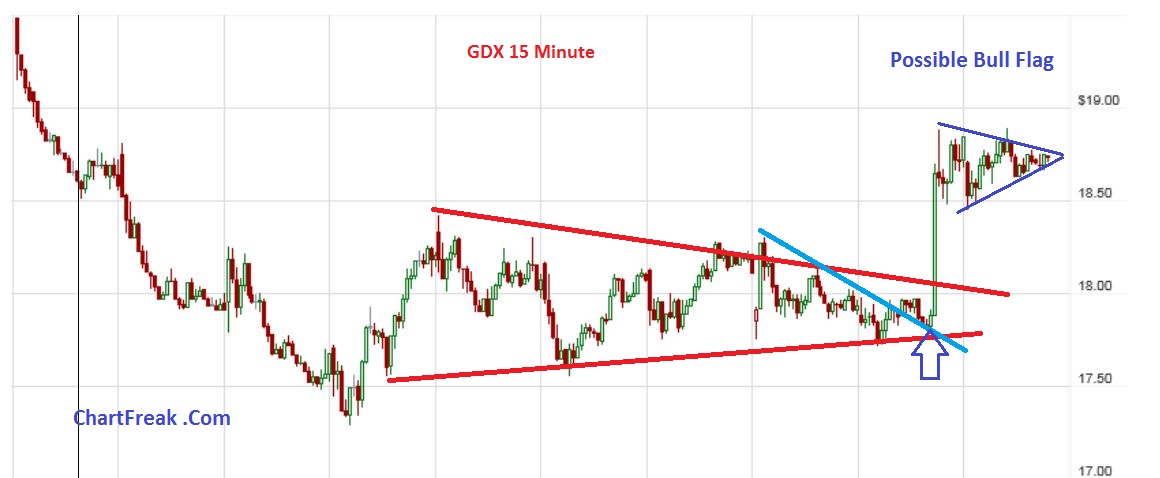
No worries, I saw a bullflag, Tweeted this Thursday as a buy ( and added)
I sold higher as the measured move was almost reached near $11.50 ( below the gap on the above GDX chart. )
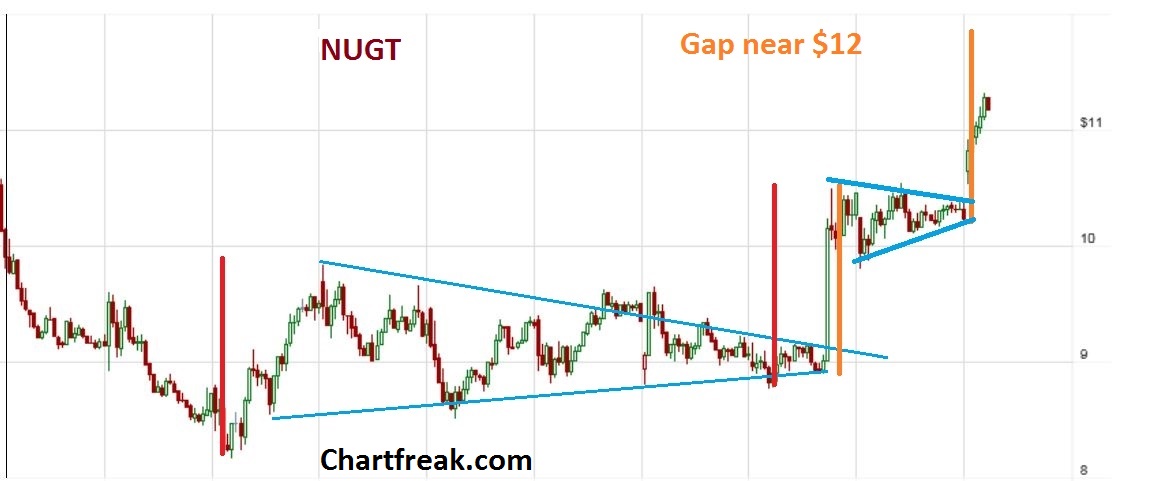
I wanted that to be a quick trade of a couple days in case we roll over in a 3rd or 4th daily cycle.
Finally : THIS MARCH 16 CHART IS ETCHED ON MY MIND -and I should post it in every report from now until we know what GOLD is doing . Why? It is the best thing that I can do as a reminder of how devious these rallies can be ( for you and for me) . We just broke out ( Green Arrow)
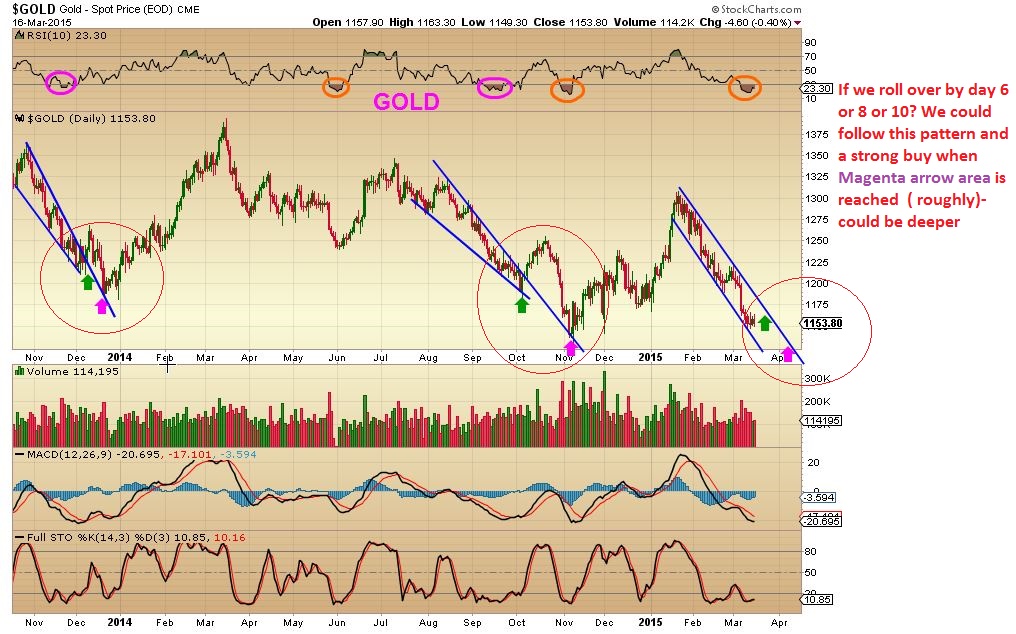
I will look things over next week and try to gain insight on the events moving forward. If you are in a Miners trade, I’d raise stops for protection.
Along with the bottoming theme, I want to repeat SOLAR STOCKS LOOK GREAT. Did you see SOL & YGE Friday?
Please look at 4 month charts of TSL, JKS, CSIQ, then look at the bases on SOL, YGE, HQCL & RGSE. Look at HQCL now .
Thats the weekend wrap up – If we are seeing a bottoming process in many commodities , these can really do well %-Wise and I want to be able to capture some of these moves. Thanks for being a chartfreak reader!
~ALEX
.
P.S. FOR EXPERIENCED TRADERS: I was asked by a reader for just a list of charts that are bullish set ups / stocks that I think look good. Some of my “Traders Watchlist”.
I have found that in the past this is difficult, because it is only meant for those who know how to trade. So let me be clear, this list is for those who know what they are looking for and can manage their own positions . I do not know all of their fundamentals. Due diligence means that you should check & see if earnings are out before buying. These charts look great for various reasons.
If you see some in more than 1 category, it is not a mistake (KITE & SNSS for ex) …they belong in both .
Again- Experienced traders- trade these with your own Experience & Knowledge
–PSUN- HD- HYH – KITE – SNSS – BLCM – Buy right here
–SSNI – SNSS – JMEI very interesting
–ULTA & UA ( ULTA . UA , HD , I like long term too ) … IMNP – KITE – PVA – JUNO – SNSS – JMEI – SFS – VSTM Buy the pullback to the trendline or support
–Watchlist type – BEAT -BLCM – consolidating , could break out
End with Solars- I Like SOL, YGE, JASO, TSL, JKS, etc as bottomed and starting to trend . They are acting correctly now ( so far)


Excellent update, Alex. Especially appreciated your posting of a “watchlist”. Keep it up!
Thanks SuperOcean9.
I would actually love to just post 6-10 charts of set ups that are looking bullish / maybe ready to buy / etc – but in the past I have found that it confuses some, so I stopped.
For example I would try to show an entry and a stop if the trade goes against us-
but within a week or so I get might get 3 or 4 emails about the trades
and am asked to manage other peoples positions . Then it just becomes
too much for me to manage with my own positions and trying to watch their positions , along with the
mkts, etc
This time I decided to write: “For experienced traders” , because I know they can manage the trades.
Maybe this is a happy medium? : )
nice…sounds like a much more efficient plan… keep them coming ;o)
Agree, Alex. Like the “happy medium” idea. Thx 4 providing for “experienced traders” for I’ve been trading since the late 80’s & now trade “full time”.
wow… lot’s of exciting action… luv the addition of the watchlist…:) Thanks!
Thx Maria – I love watchlists too actually, I have keep a running list at all times for trading
Superb report, Alex. Just to clarify, are you still in the energy trades? I’m currently holding REXX, EXXI, GDP and BAS. I added to them a little too late so now I’m red on all positions.
Hi Ryan,
I am in Energy , as shown in the charts of this report, OIL did what I was hoping it would do and that is break down & recover the lows. This type reversal is often a “Stop run” and then OIL can run higher. I would expect these energy stocks to make another leg up when oil does. I’m thinking that once again ( like the first run up) Some will perform better than others, as pointed out too. That remains to be seen.
Sidenote:
I really liked the charts of the Solar stocks though, and other set ups , so I may personally bounce around a bit , as a trader. If you look at 4 month charts of YGE & SOL ( And see HQCL ) these look ready to join TSL, JKS, CSIQ, etc which are stair stepping higher.
CSUN, maybe the biggest solar lagger. Most upside from here? What do you think Alex?
CSUN is sitting on the 50sma, so can be a low risk entry if you keep a semi -tight stop, but…
RGSE is a bigger lagger. Had a HUGE pop, but pulled all the way back. Some dont like the stocks under $1 though.
Disclaimer: I own neither yet
What do you think about FSLR? Looks to be consolidating its previous move up.
CHECK OUT REE & AVL ( MCP also, but the chart isnt as good).
You buying?
No, but I like that
1. REE dropped to the 50sma and it held,
2. It had a 50% pullback.
3. Triangle not draw, but it broke out from a wedge / triangle. looks good. Refresh for the chart.
hhmm Hmmmm…. right here CF (me pointing back & forth w/ two fingers from my brain to ur brain) ;o)
Like the “I’m watching U ” from a Gangstah movie?
lol..noooo… like we r on the same wavelength… thinking alike :o)
MCP up 40% already, but looks like it has lots of room to run!
Alex, looks like GEVO basing for another move, it just passed the 50 day MA. Thoughts?
looks it, but I’d like to see it gain in volume as it rises. Seems a tad light.
Held onto my REE on its decline. That sector is limited in choices so if it actually turns around it can really run.
I have played the Rare Earth runs during good times, and it’s almost hard to find better %-Gainers. Solars are good contenders, and shippers used to be. And Oh Yes, Miners were in that category too : )
Bought RES
I like that set up a lot above the 50sma ( here isnt bad either really). And of course I’m hoping that REXX crosses that 50sma today. Its trying too : )
I like RES, I was filled last week.
I bght. KEG this morning at the 50 dma.
Watching ERF, Limit order in at the 50 dma’ sh.
Just picked up a little UGAZ. Seems like it’s bouncing up and down every other day. Maybe ready for a little bounce back up?
That was almost perfect timing Carl : )
Just a,small position. I’m out at my buy point.
I really like PEIX here. Dropped about 50% off its earnings move. Now looks ready to run again. If it gets past it’s recent high not much resistance until 15$.
PEIX and PACD look real strong, above all the MAs
Take profit in oil yet ?- uwti target was 2.40 when I picked up at 1.90 last week Thursday! Thoughts Any?
I took 1/2 just because its a 3x ETF and I also got in under $2