If you were watching the markets yesterday, then you may have seen something quite interesting from about 2 P.M. onward as the FED information was released. It looked like this at a casual glance….
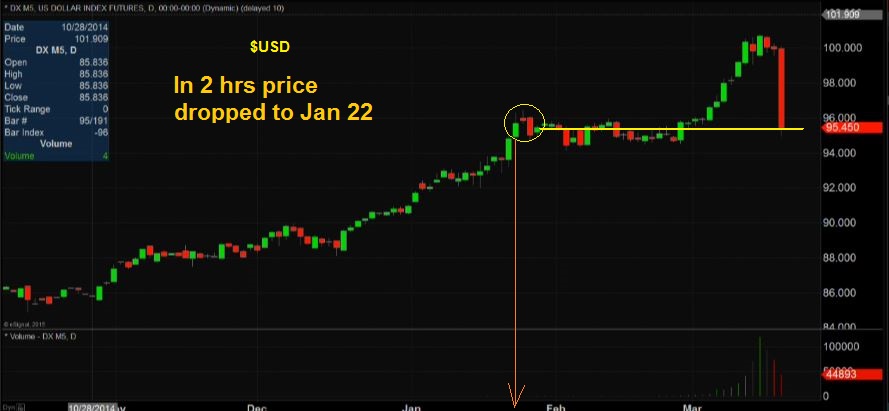
The $USD completely wiped out any gains from Jan 22 onward in very short order. Oh these fickle markets …
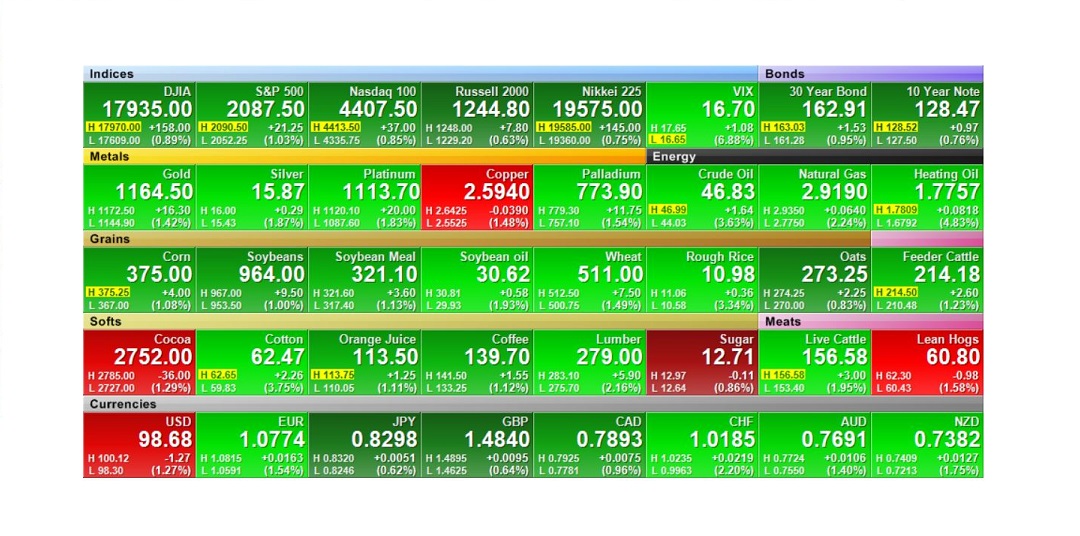
As the Dollar roared higher over the past couple of years, Commodities have been experiencing a beat down . They enjoyed the hit that the Dollar took, as you can see on this mostly bright green chart. The Equity Markets also shot higher.
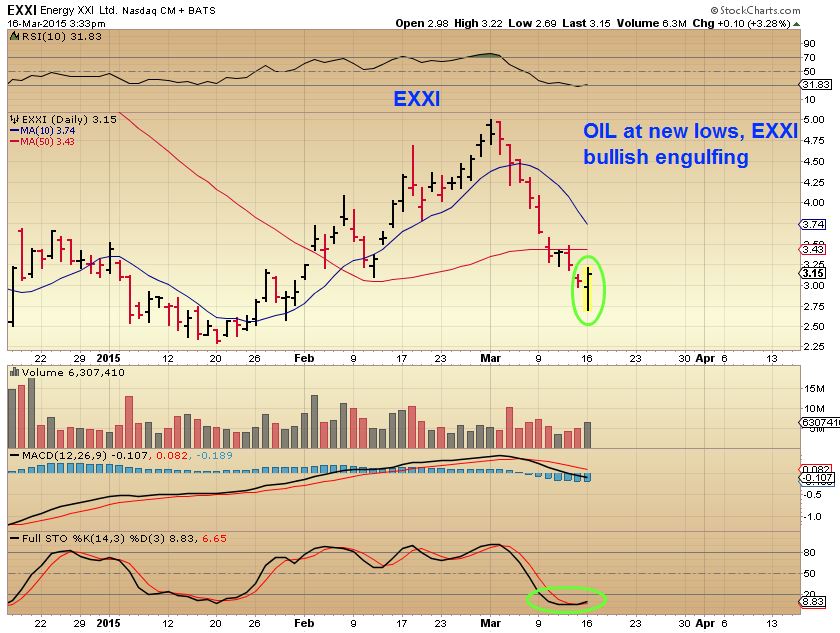
 I was focused on METALS and OIL going into the fed. You may recall that I pointed out in Mondays Intra-day Alert that ENERGY STOCKS were reversing as OIL hit new lows. That was a strong tell to me, so I posted to alert others to a possible bottoming process in Energy again. I posted these chart Monday for example, and mentioned that many Energy Stocks were acting bullishly, while OIL was making new lows.
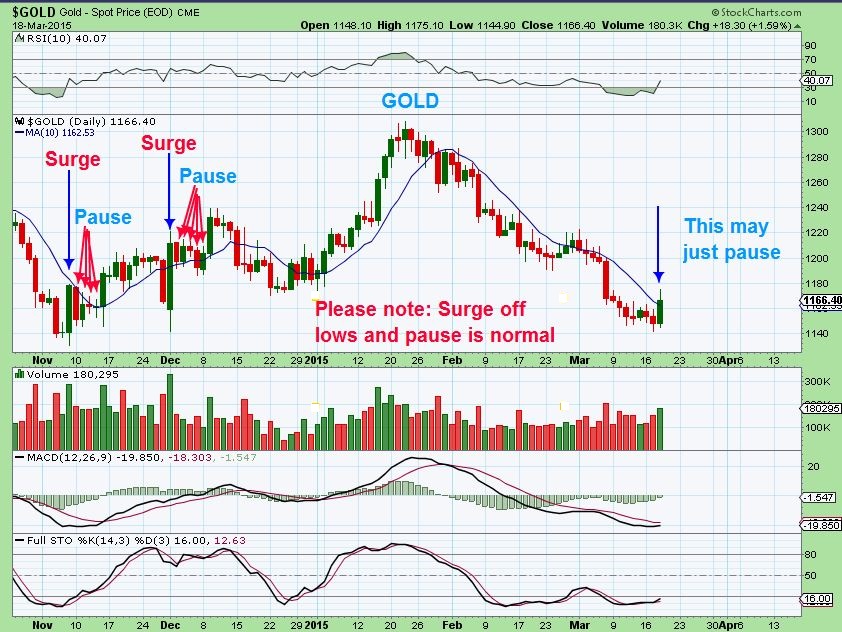
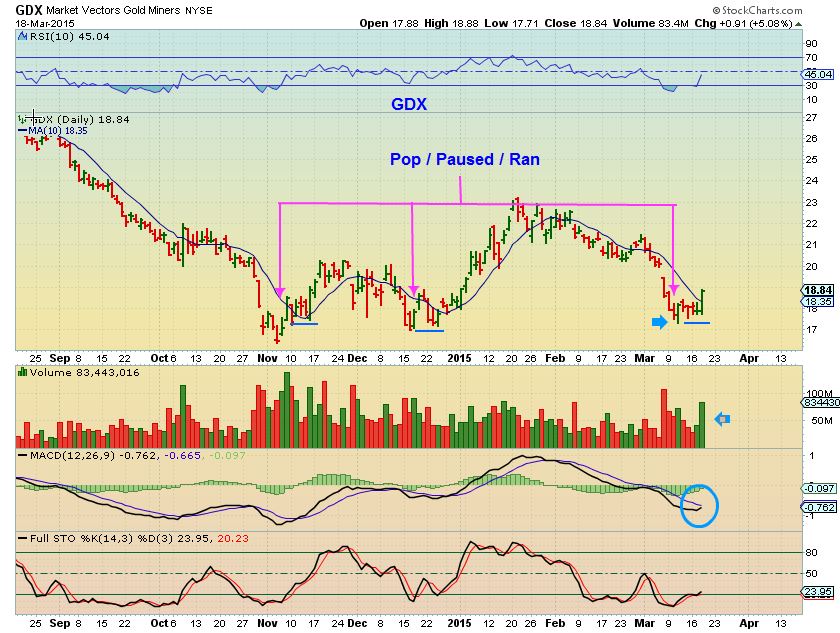
ONE NOTE ABOUT STRONG BLASTS OFF THE LOWS: They can sell off or pause for days after the initial blast. Emotionally, THAT drives people crazy. Emotionally people want immediate follow through to tell them they saw a bottom, any pause makes them wonder , doubt , and even start going short. The charts say that a pause often happens , so we don’t get emotional, we just pay attention.
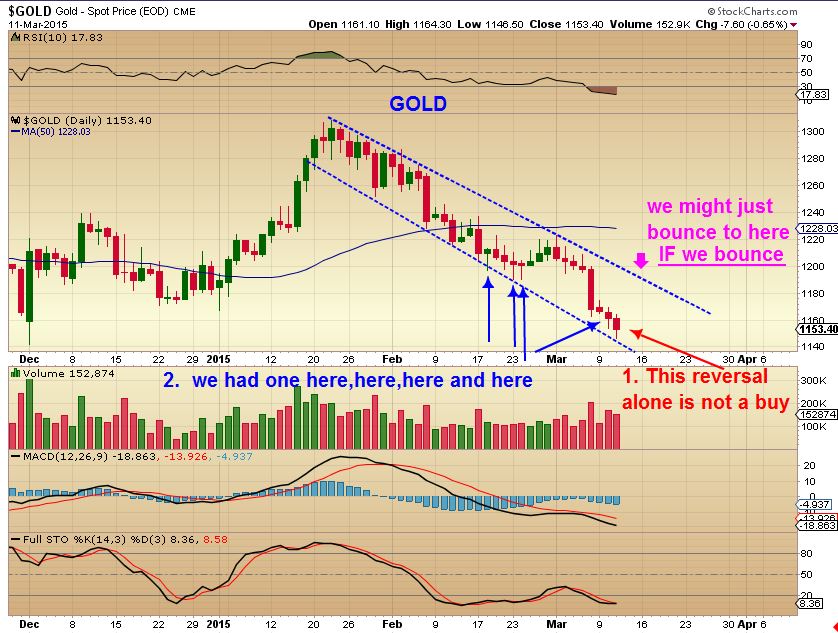
GOLD – surge off of lows for 1 day & pauses 4 or 5 days.
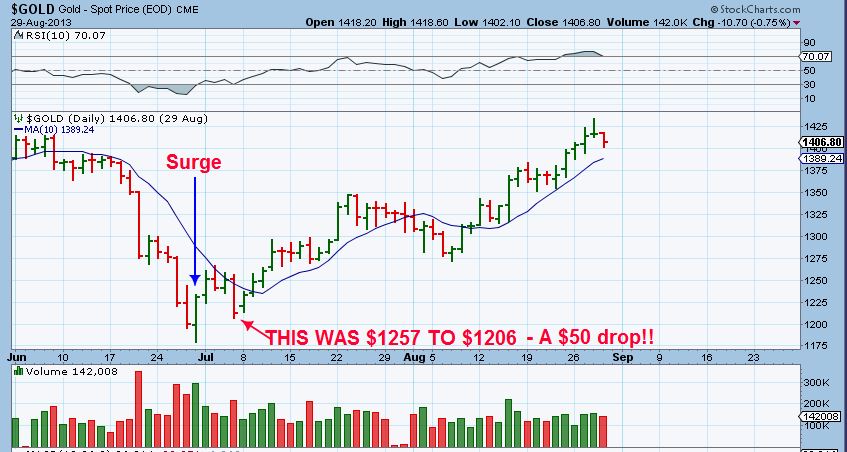
GOLD -June 2013 dropped $50 after popping from lows. Emotional people went short.Its best to be patient.
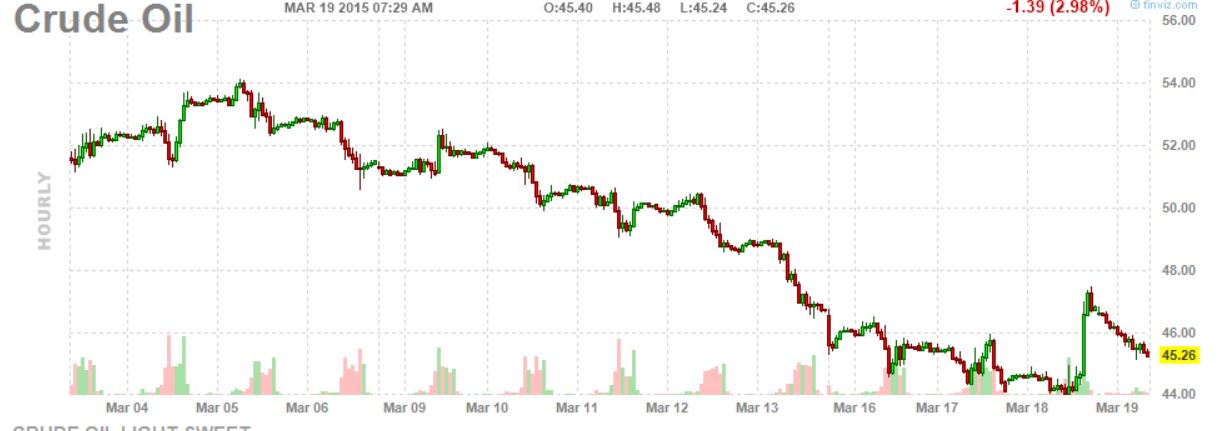
CRUDE THIS MORNING – Surge & dropping
If you go back to yesterdays report, one of my last notes was about after the FED. I said something to the idea that you get a SPIKE after , and often reversals, but the following day …the various markets go in whatever direction they want. I said that for a reason: That is what we see pre-market. Yesterdays POP had many chasing it, and now they will be in the red & doubt, fear, and worry about whether they got sucked into a false move. For others, it will be an opportunity to watch for set ups and buy.
Important Note for Newer Readers: I have stated in the past , when I say a sector is “Bottoming” , I mean that it is in a ‘bottoming process’. It can take some time with rallies and sell offs that form that bottom. And I always mention that NOT ALL BOTTOMS LOOK THE SAME ( as seen below) . So a bottom in OIL may not look like a bottom in Miners, and that may not look like a bottom in Uranium, etc.

I mention that because I am getting a strong feeling that Commodities as a whole may actually be bottoming. Its a “process” and I’ll likely discuss that further in the weekend report. Temporary or lasting? I cant tell yet, but things seem to be lining up nicely. From these lows, good money can be made when a sector has been beaten down and recovers.
Let me just show you some quick charts from Wed to back that statement about various commodities with nice set ups .
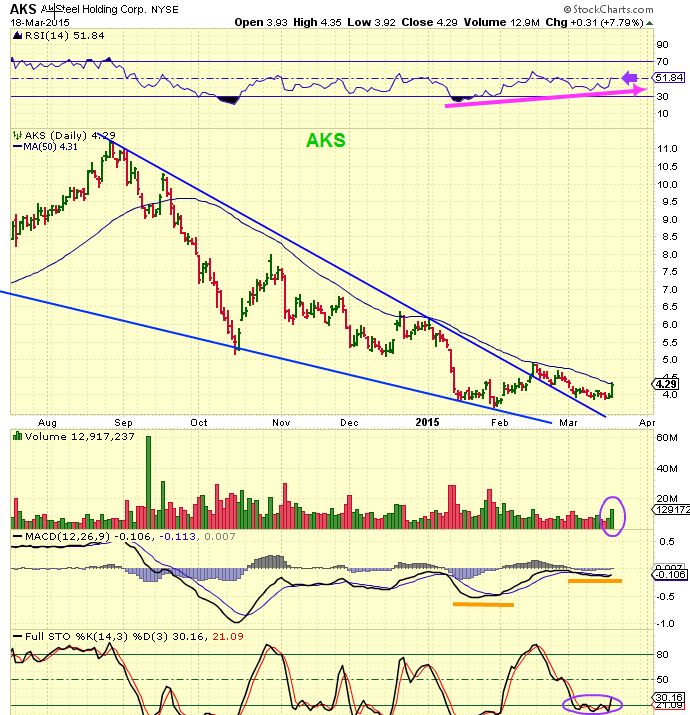
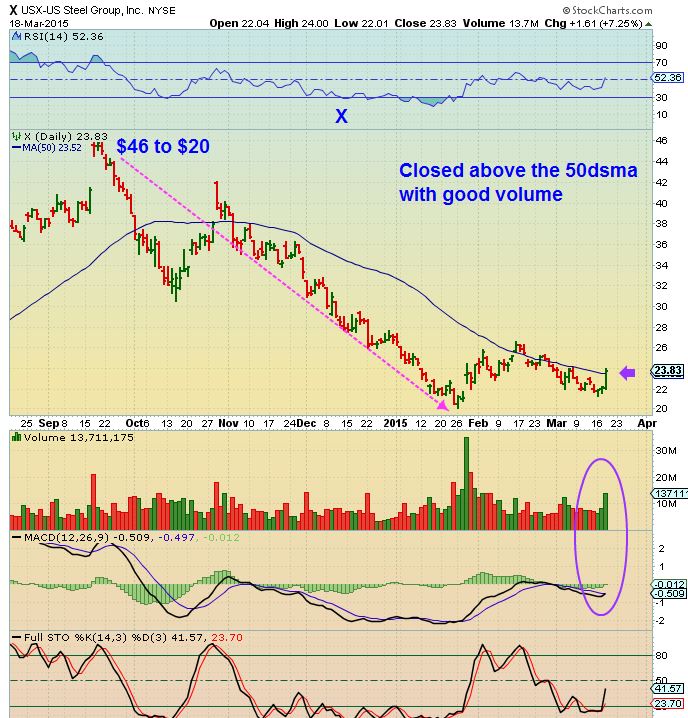
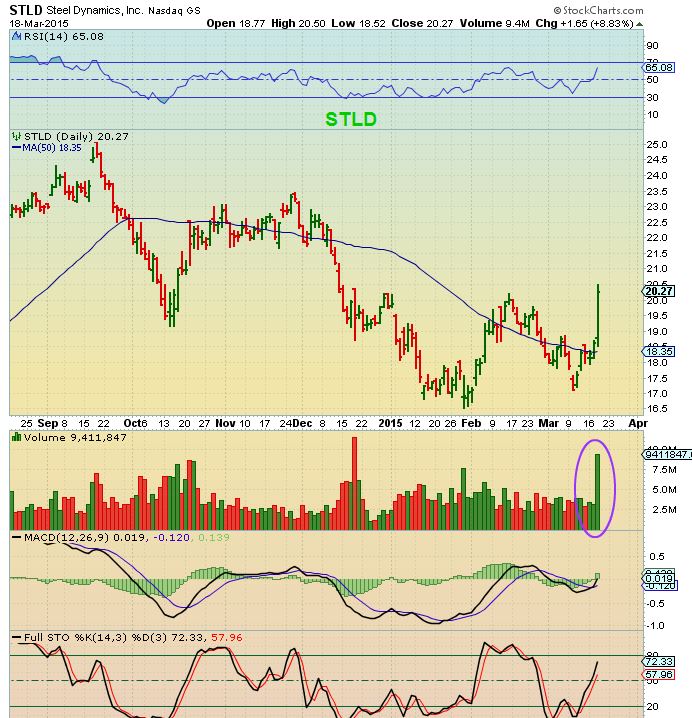
STEEL stocks- ( See AKS, X, STLN, SCHN) looks like a Trade-able bottom
AKS- Bottoming?
 X – Bottoming?
 STLD- Bottoming?
– COAL – Stocks like ANR, ACI, BTU, etc popped yesterday and have new lows with strong divergence. They look as though they want to run too.
– SOLARS– I have already mentioned TSL, JKS, CSIQ, SOL, YGE, as good set ups, and bottoming
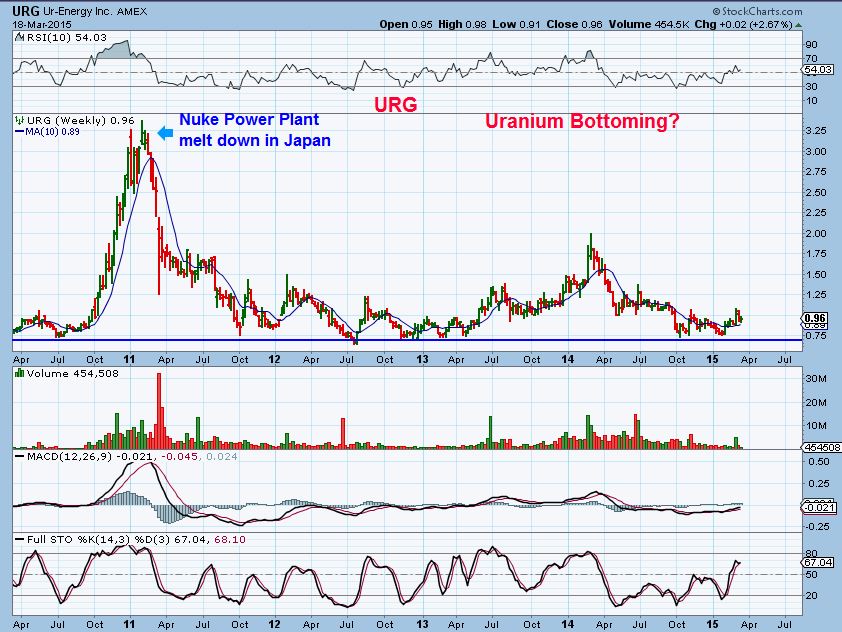
– URANIUMS sold off and have been bottoming for yrs! Look at URG for example
So lets discus ENERGY – are these lows?
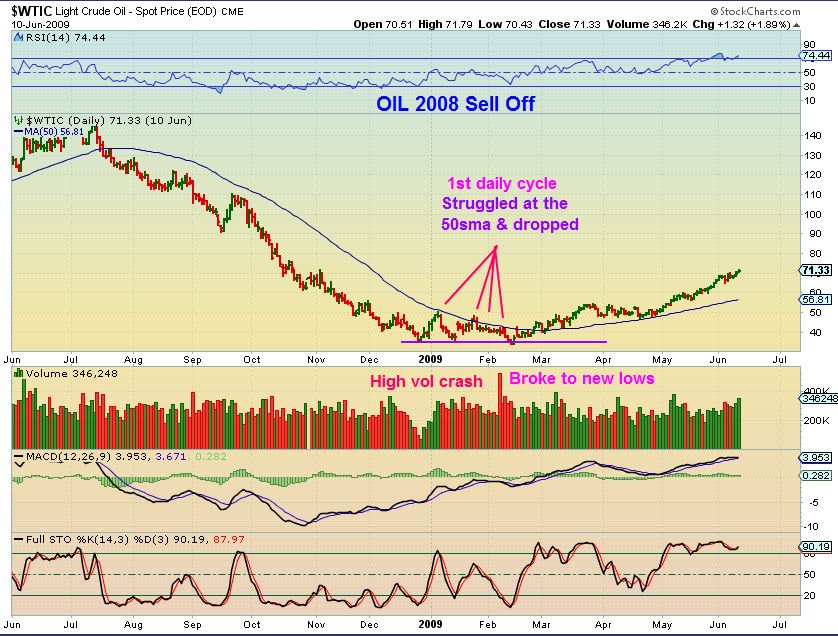
Quick Review- I saw way too many watch OIL start selling down and started calling for Low $30’s in OIL. I posted this OIL 2008 bottoming process and said that we are in the “Timing’ for a low in OIL .
OIL 2008-2009 lows. Double bottom in 33 days
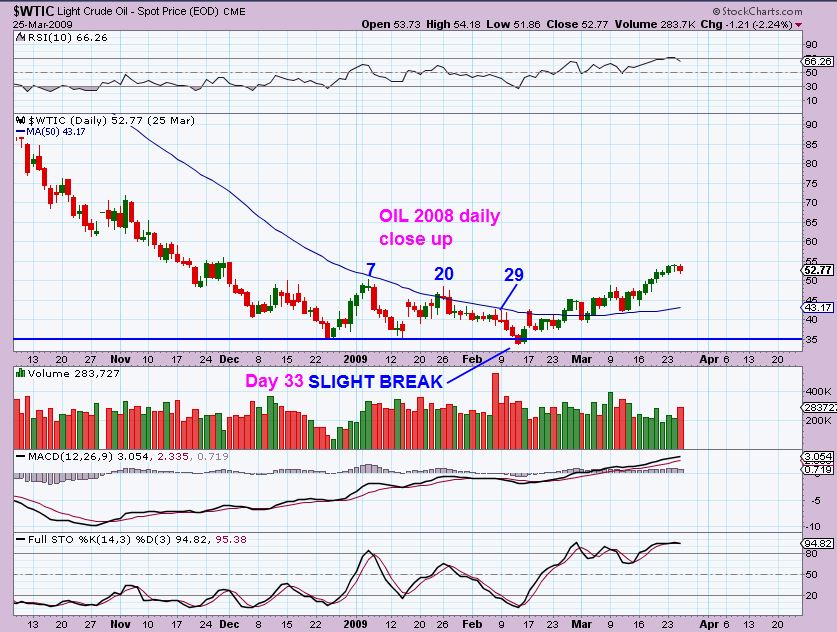
Mondays count for OIL was day 31. Wed was 33 .
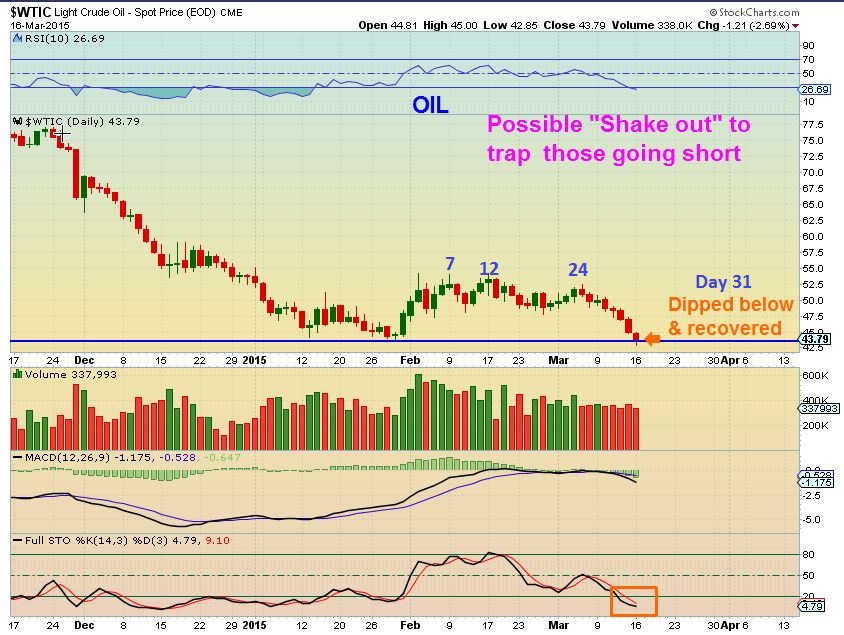
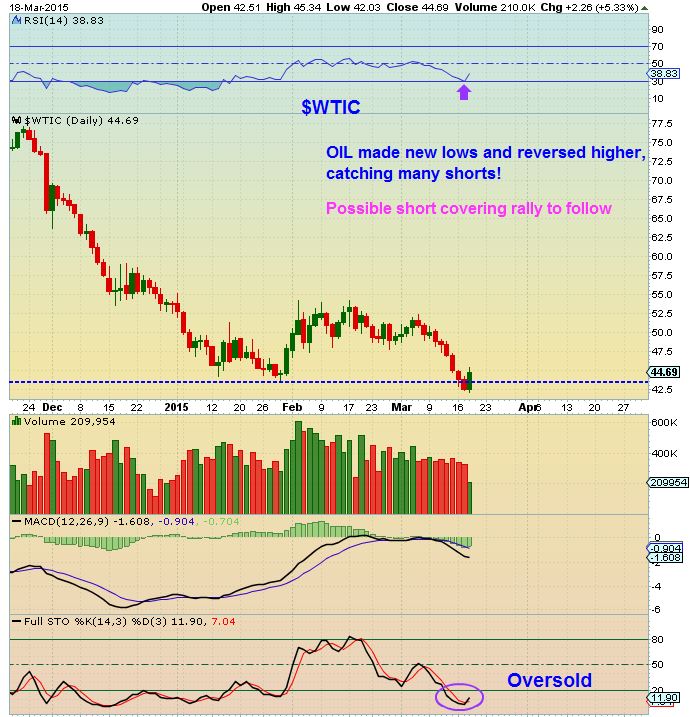
MARCH 18- looks like a reversal
Also OIL in 2008 1. struggled with the 50sma 2. dropped to new lows 3. recovered. EXACTLY what OIL did now.
THERE ARE MANY BULLISH CHARTS FOR ENERGY!
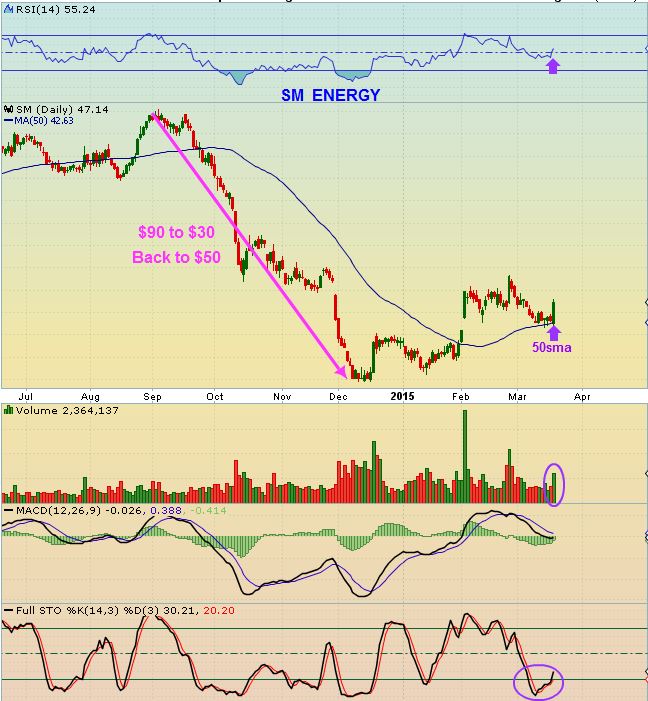
WITH OIL AT NEW LOWS…. Many didnt come close to new lows and look strong. Some are already back above their 50sma with OIL hitting new lows? BULLISH!
SM
In Mondays mid-day alert & other past energy reports, I have highlighted EXXI, GDP, BAS, REXX, DNR, SFY, etc , these look to be starting another leg higher. You can now look for opportunities to accumulate them when you are comfortable. You may wait until some re-gain the 50sma and buy them there, placing a stop right below the 50sma. You may but these reversals, with Stops under recent lows.
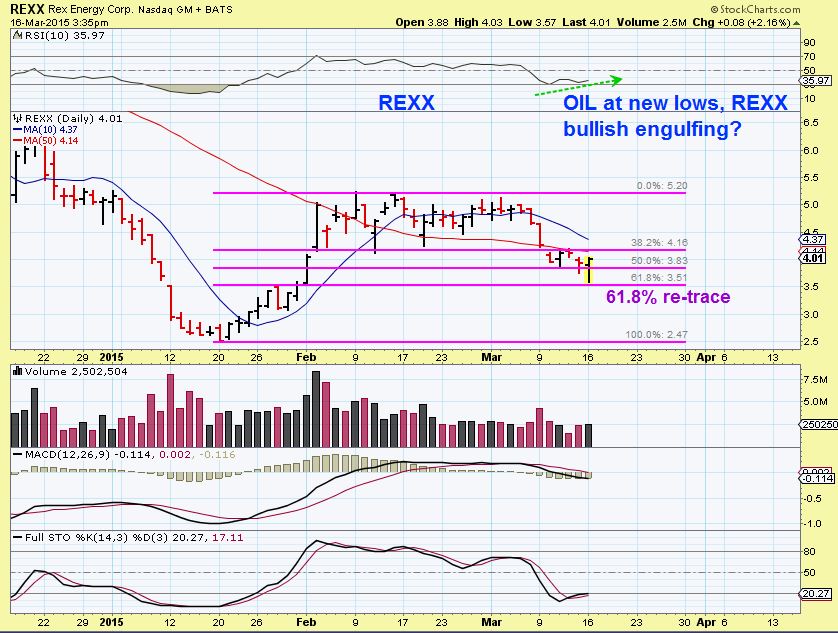
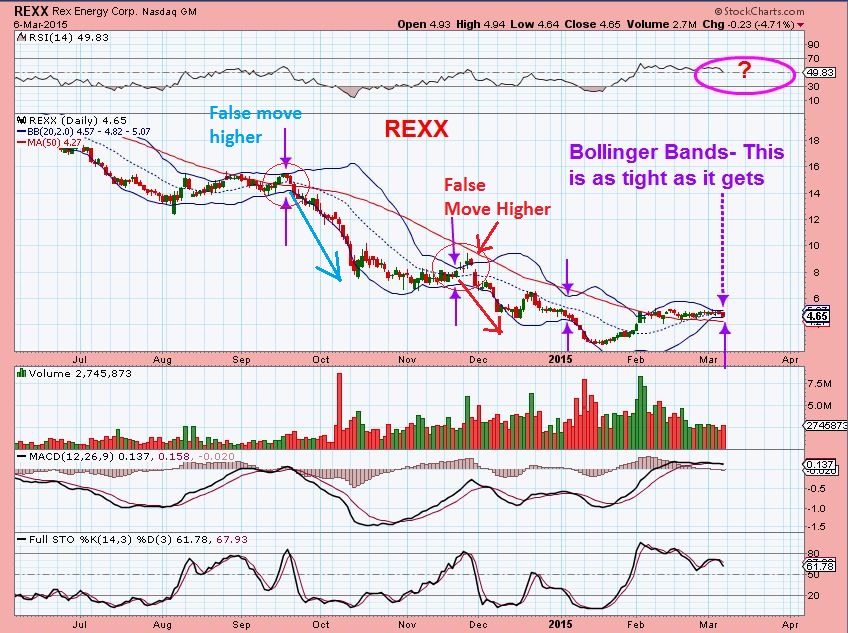
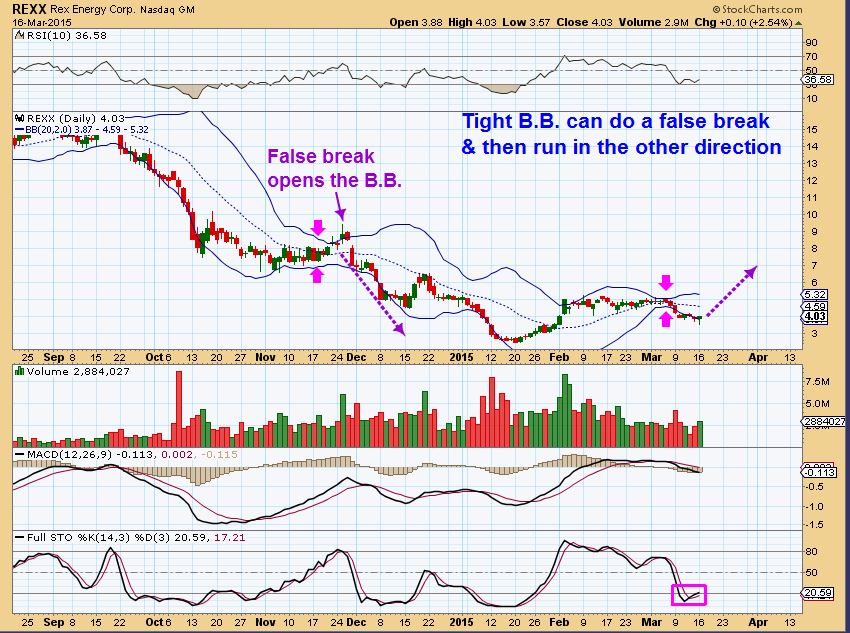
I mentioned REXX specifically and added to that one on the way down, because I loved that Bollinger Band squeeze play. I posted this and mentioned the tight B.B. leads to strong moves, but may initially be a false move. It broke higher , then sold off in the past. If it broke down, I would buy it ( High risk trade) …
I believe it may have just had the false move down ( This was Monday, drawn for a friend )
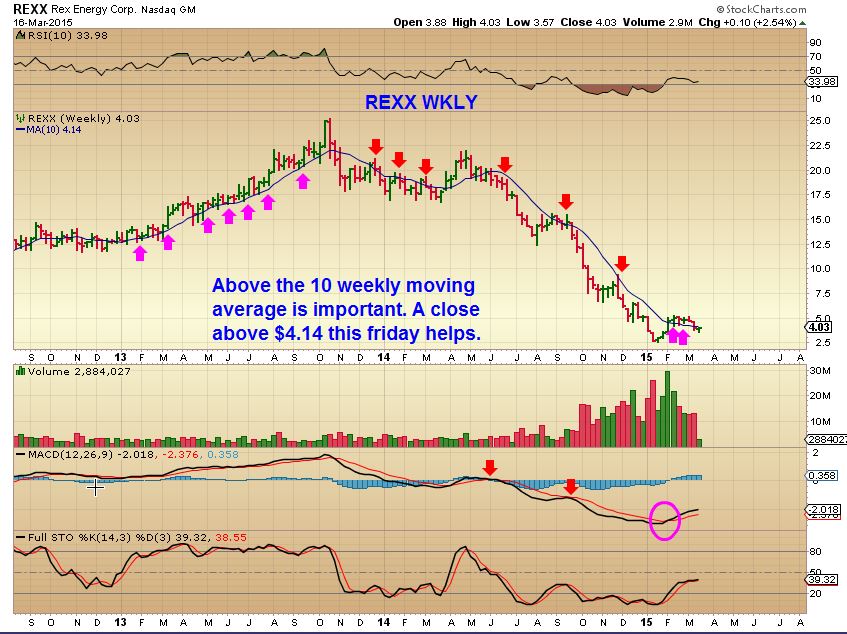
WKLY I wanted REXX above $4.14 ( Drawn Monday for a friend) . Yesterday it closed above the 50sma, and 10 WMA at $4.27 . Can it hold until Friday ?
SO I like the ENERGY STOCKS as reported in Mondays alert. Please re-read it if you have time.
GOLD/SILVER/MINERS – Also Popped with the FED Wed Release.
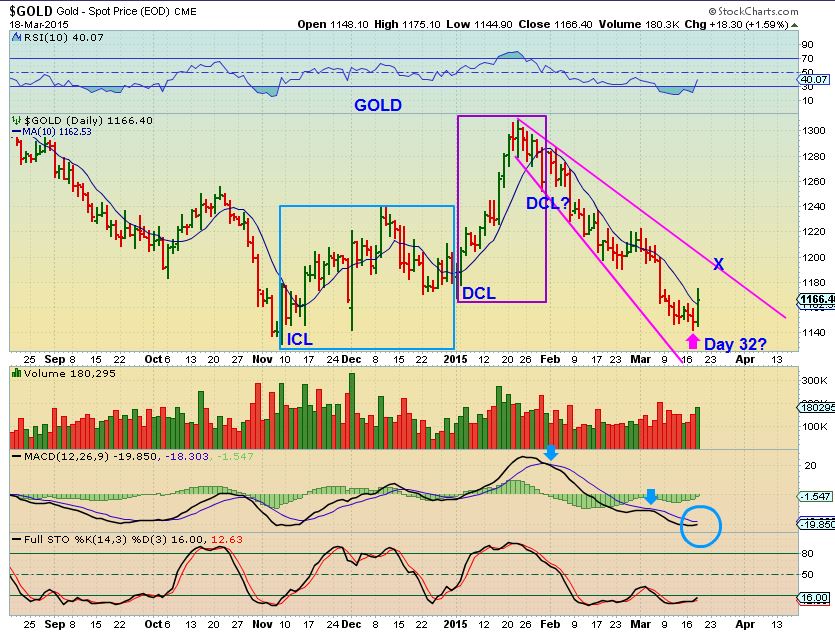
GOLD MARCH 18 DCL ( Daily Cycle Low?)
GDX already put lows in days ago ( I got that reliable BUY SIGNAL) . Pop, sideways, move higher
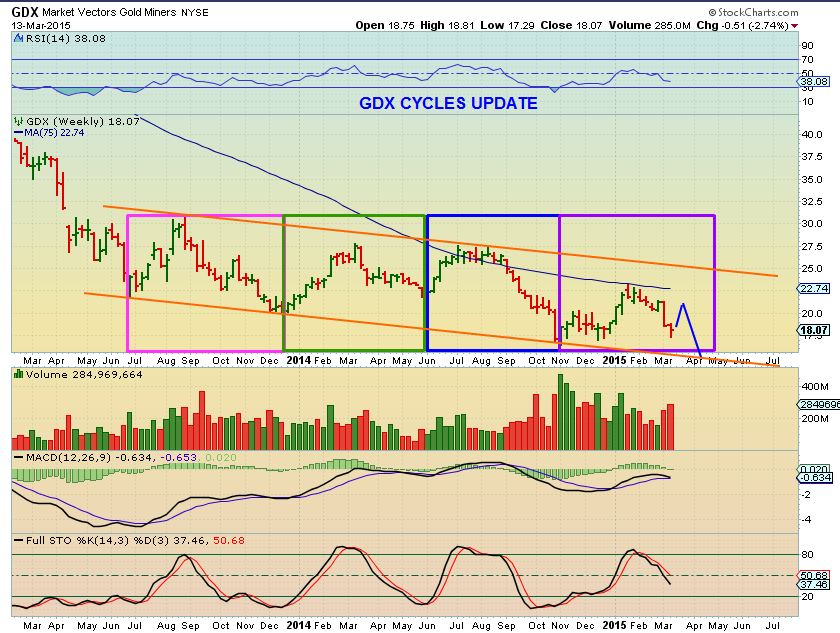
I have written extensively about this and all the possibilities. I have been cautious in the 3rd or 4th daily cycles, because they tend to run up for a week or two, and then drop. I will cover more in the weekend report . COULD this be a Meaningful low (ICL) ?
I have to lean toward “No” at this point, but there is evidence that it “Could” be. We have to watch things play out , and I will have that in the weekend report. Right now , if GOLD just bottomed…we have 5-10 days to watch it play out.
As a warning, I will just add a couple chart from prior reports showing how this could just be a trap , so we trade cautiously for the next week or two as we watch it unfold. I posted these possible paths if we are going to drop into an ICL after this move higher, based on past experience.
GOLD to $1200?
Watch for a triangle like OCT
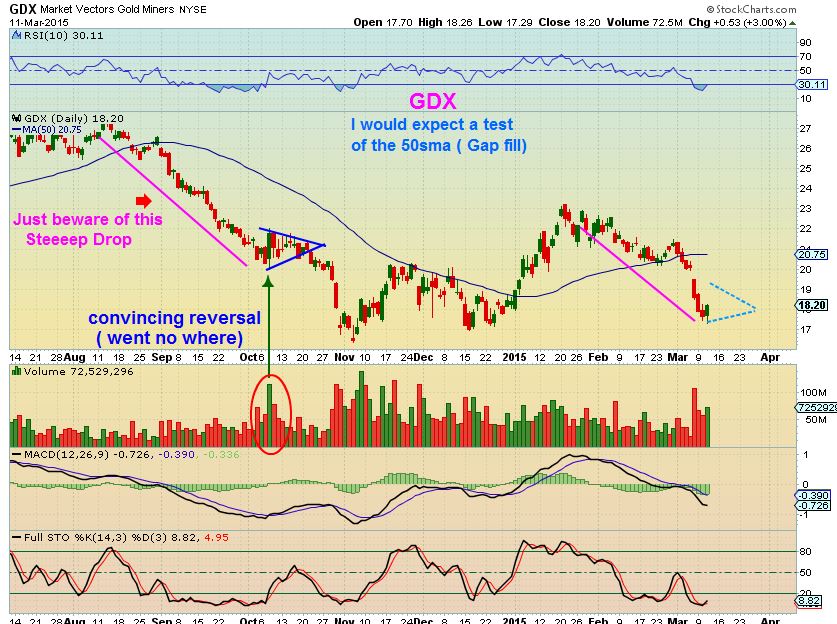
GDX WKLY 2 weeks up and roll over? Both charts below.
2 weeks up, see oct 2014 orange arrows bounce to Blue Arrows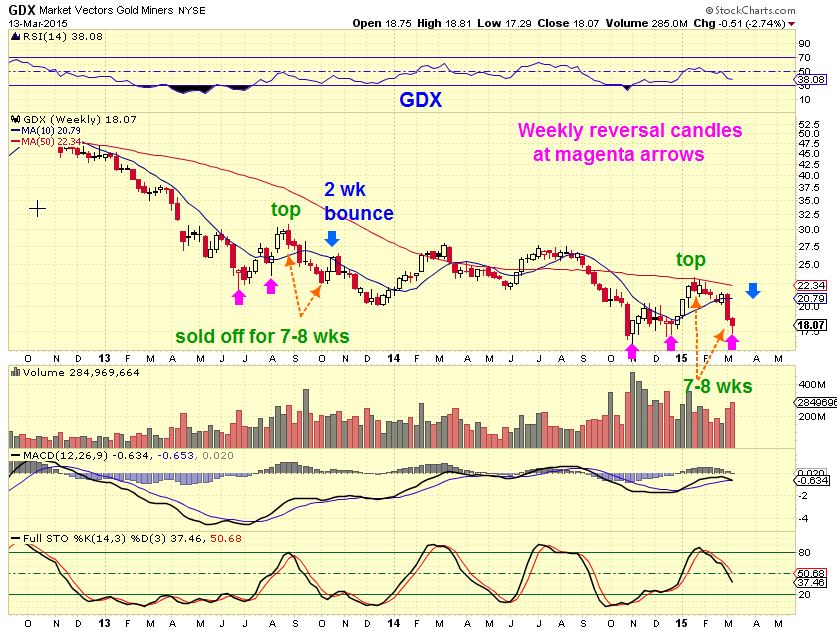
SO I’ve covered it repeatedly. Its too early to know right now where we are, but we will watch it unfold. Please review prior reports charts , skim through and see what I said we could look for , and I will discuss more in the weekend report . OIL & GOLD are selling off pre-Mkt, some will worry, doubt and fear (maybe they’ll go short again) , others will look to see if it’s a buying opportunity. Look for light volume pullbacks in Energy and metals .
It is likely a shopping opportunity, since we at Chartfreak saw the ENERGY stocks as BULLISH MONDAY when OIL was dropping to new lows. Best wishes!
~ALEX
P.S. No time to proof read, I just want to release this. ALSO , I don’t always have a Friday report, but if some of these stocks pullback in Miners & Energy and look like low risk buying opportunities , I may post some charts. I really liked what AKS, X, ANR, ACI and many Energy stocks looked like going into yesterday, as charted above.
Waiting On The Fed Again 
 Could Energy Still Be In A Bottoming Process?
Scroll to top

Awesome stuff as always Alex! Many many thanks for your time and dedication
ditto 🙂
Ditto Maria 🙂
Thank You Matt, I Appreciate that 🙂
Alex, anything on syzm? Also looks like mjna broke down on long term support now fighting it’s way back up any thoughts on that one? Thanks bud
I Steven,
SZYM, I still own it , I like it ( I do wish it had more volume as it rises) . It dropped to near the 50sma and turned up.
MJNA – Very interesting & bullish reversal, but it is extra risky until it recovers that 50sma (hasnt dont that in a while). I was trading FCEL & BLDP as better set ups. I like FCEL here (Chart below)
ALEX…. is SZYM a buy?
Maybe, it really depends on your goal. If you’re a long term holder U could , but the real buy is at the 50sma ( or yesterdays reversal). The only problem buying today as a short term trade is that its 50/50…. meaning It could run to the highs of that burst higher at $3.50 , or drop again to the 50sma.
Click the chart below. Its not even close to overbought on the stochastics, so it could be bought, but if it drops to the 50sma, will you be concerned? It could drop there again.
EXK looks like it is trying to put in a weekly reversal & shake-out, up allready > 30% since the 1,55 low, could you please give me your thoughts on this one? very weird to see it underperform most gold silver miners in the last month, but now it’s ahead the others…. thanks!
Hi Chris, Technical Analysis wise, I really like it .
Its breaking out from a downtrend. What about cycle timing? That is the only thing concerning me…will we roll over?
I’ll draw EXK chart (Below).
1. It could just break out higher and keep running, or
2. the 50sma may act as resistance. It could then just go sideways under until it pushes through ( like energy did), or
3. Drop to the 10sma again…testing the break out? I see that a lot
great, Thanks Alex. for the chart do you mean below this comment section?
No, when we post chart, sometimes the comments show up, but you have to hit refresh to see the chart. I have posted one in these comments. click on it to enlarge it.
great, know i found, i hope we get a retest and hope to buy close to 1,80 a 1,85 area. Thanks for the fast answer, i appreciate it a lot!!
Some Energy holding up better than others? EXXI and BAS look good, RIG and SFY beaten back. Any thoughts?
Add REXX to the ‘beat-up’ category! Alex, you recommend just watching here, being patient, and stop below this week’s/recent lows, right? Yep, hard to watch the next day, but am trying to hold strong in energy. I knew it would give back some but a bit stronger than I had imagined. CLNE holding up better than most of the rest of complex.
Alex, anything New on broad indexes? Looks like it will consolidate gains inside rising channel for Now, I believe. Trying to decide to part with QQQ gains now or press.
Ya, its tough to give back. I knew SFY would give some up, it just went crazy Yesterday. I bought some this morning. Stops are tough, you don’t want to get stopped out the first day of a new trend. Alex, what time frame do you use for determining stops? 1hr 1day 50sma?
I use a regular daily chart for stops, and they are set based on various factors:
1. Where I entered the trade, or
2. My confidence that I have the direction correct & if it goes against me?…
3. If the trade seems to be going against me….’what would make me think I am not correct or something else is happening here’.
Alex, Bill, thanks for the input. I re-read the whole report (slowly) and really have it now. Based on your answer to Bill above, I have enough ‘room’ to put stop just below new recent low. Interesting the EXXI turned it around but others like REXX closed right at the lows. Not sure why such divergence. I bought yesterday so after pop but before pause. Still got in early enough in the day to have some wiggle room. So, I am ahead on EXXI and CLNE and only moderately down on REXX. Should be able to give it room to ‘pause’, but if it breaks to new lows will have to cut. Thanks!
Well, when you say that I recommended … “Alex, you recommend just watching here, being patient, and stop below this week’s/recent lows, right? ” Its s couple of different things . ( For some it’s not just watching, this can be the buy area )
1. If you go back and look at My Monday report, I was discussing the reversals (bullish engulfing candles” taking place. SO I think in that report I did say that if you buy those, your stop is just below Mondays lows.
2. I also mentioned in yesterdays report & that FED day is tricky , and the note at the end of my report was “Fed day you often get a spike, it then can change direction, and the next day can go in whatever direction…”
The reason for that is that the initial SPIKE is usually just a short covering rally. When the short covering is done & new buyers arent ready to support price, it then drifts back down. THAT becomes an opportunity to buy. If conditions are correct,and a light pullback occurs , you can enter at lower prices that if we chased the short covering rally.
I still think Energy & Metals are acting correctly with the pullback today. Nothing violated yet. , and often at lows ( like Bill & I discussed in the past with miners) you get the intial Spike higher and then curve down lower. Then the next leg up when sellers dry up & longs step in.
This is how I was watching the GDX trading at 2 p.m. yesterday & What I see now. chart below
I have the chart from yesterday on my other computer , but its basically the Blue triangle on a smaller time frame breaking out & back testing before the FED… It was actually a very low risk buy for NUGT at the blue arrow , because the stop was a break below the red line
4th daily cycle seems to have more legs than the 3rd!
Some cycle guys are saying that this is the start of the 3rd. That would make the 2nd 40+ days , I think? Its tricky the way it sold off .
This was GDX Fed Wed (Chart below)
FWIW:
Added SD, SGY. Will add PES by the close.
I’ve added a little today too, but it’s not easy . I really liked the AXAS chart yesterday …it looked strong – today it looks like its going to stop me out tomorrow : (
Agree on AXAS…..touched the 50 dma from above, maybe a small position with stop below Mondays low at 3.01 ?
On a 5 month chart it looks good, todays move with heavy-ish volume (when you’re in it) seemd extreme. WHen you’re looking to buy it , todays move to the 50sma could be a gift. I have tainted biased eyes : )
I have my Rose colored glasses on too !!! 😉
Anybody still holding KITE? I was stopped out below the 50sma and today….up $10 (refresh for chart). I believe it has further upside after that consolidation. may break new highs and form a handle or just run higher and test the break later. .
Ya, I saw that. I don’t own it, but I did notice. Good Call
I’ve been burned and rewarded on BIOTECH stocks so often ( equally , I gues) that I cant stay in them if they go sideways. I fear the gap down.
Bio-tech was in pure beast mode today; really about the only thing that was. Check out today’s action in JUNO, CLDN, QURE.
Alex…. a total other question.
How looks AAPL? Is it in EW 5?
I would need to know what time frame. On a 15 yr chart you could say it is.
Sorry Alex… a daily charts from 6 months!
Sorry , I cant tell. Its a long uptrend that starts about 2 yrs ago, so its tough to start in the middle of that long uptrend for an E.W. count.
Started buying UPRO and BIB last week, added some more this week, along with XLE and JO. I’ve not had much luck with individual energy stocks (too volatile), better luck with XLE.
Do you have any thoughts on JO (coffee), I made some nice coin on it around this time last year, could it be seasonal.
Hi Harry,
I wish I read this earlier. I liked BIB a lot this week , but today pretty much looked like an exhaustion gap (RSI hit 90 on a huge gap open). Selling that Gap open would be great place to lock in gains until it possibly drops to the 13 sma (It seems to ride the 13sma). For now you may just want to hold it.
I like JO here too, when DBA had that HUGE capitulation volume day I looked at COW, CORN, JO, WEAT, SGG and a few others.
JO,WEAT look good here longer term bottoming type action.
In my weekend report, the bigger picture will explain my outlook better, but for today all looks fine & dandy in GOLD/OIL/Committees/ Equities, etc : )
I had a partial sell order on BIB at 188….I saw the premarket action and got gready and changed it to 200…..:(
Well, if it drops to the 13 sma ( doesnt have to, but I see that it could- refresh for attached chart ) it then would likely at least go higher and double top. I’d watch it near there . It could break to new highs or double top & drop, but basically I am thinking it returns there .
I wrote 10sma on the chart out of habit…its a 13 sma
Good rebound in OIL(refresh for chart). Glad I didn’t sell Yesterday! Bull flag now breaking out. AB=CD would have WTI around $50
I didnt post on here ( due to high risk & need to babysit positions, really tight stops, etc ) but I thought OIL was bottoming as noted in my reports, and NATGAS had popped…so I bought UWTI when OIL bottomed on this chart, and sent this chart to my buddy- he wouldnt take the trade ( It was too risky for him, but I just kept looking at OIL 2008)
So for short term traders , NUGT buy could be sold here or soon if U bought lower. Still may be more upside , it also may just pause at the gap . I am going to lunch…Good trading all.
EXXI, SFY, GDP not participating Today?:-(
I posted my intraday reversal post on Monday , so Energy stocks bottomed Monday ( 5 days ago) , Oil just bottomed 2 days ago.
Looking at EXXI- it ran up 50% from the lows Monday , probably needs a rest. (refresh for chart)
GDP 20% off lows, they are likely consolidating.
Same thing happens when Miners bottom first. I often get emails that GOLD is up, why are miners ugly & not up with Gold, but they popped first and usually move at different times.
Just a guess, but I’m not really concerned too much at this point. I’m hoping they follow thru next week.
PKD AAV SID and PACD nice looking charts.
Alex, so would you suggest dumping fast movers like SFY and going into laggards? Just curious. I bought EXXI This week, didn’t think I missed that much of the run.
Not necessarily. I tried that last time and NADL had a great run, but gave it all back in the end. WRES never did much other than that POP, so I looked at a few “healthier” ones and they were stronger during the pullback. That may be the best choice.
See AAV for example. That held up well from Feb lows.
However PACD never did anything , and it looks ready to break out now, so some laggers may out perform, its a tough call.
I did expect a little better from REXX and a few others though.
Triple witching today. Maybe that had something to do with it.
Good point ( quad witching, wasnt it?)