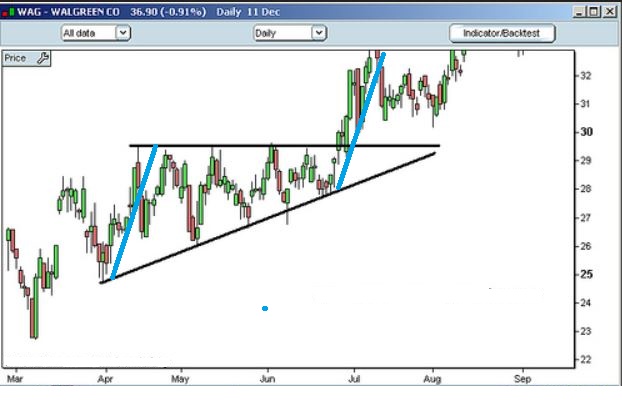
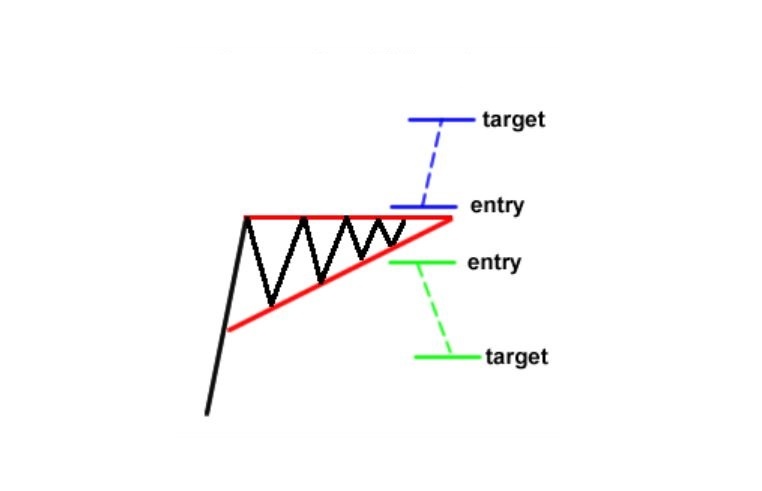
Have you seen any Ascending triangles? They can break out higher and they can break out to the downside. Here is one that broke out higher for example.
 I’d like to show you another one…
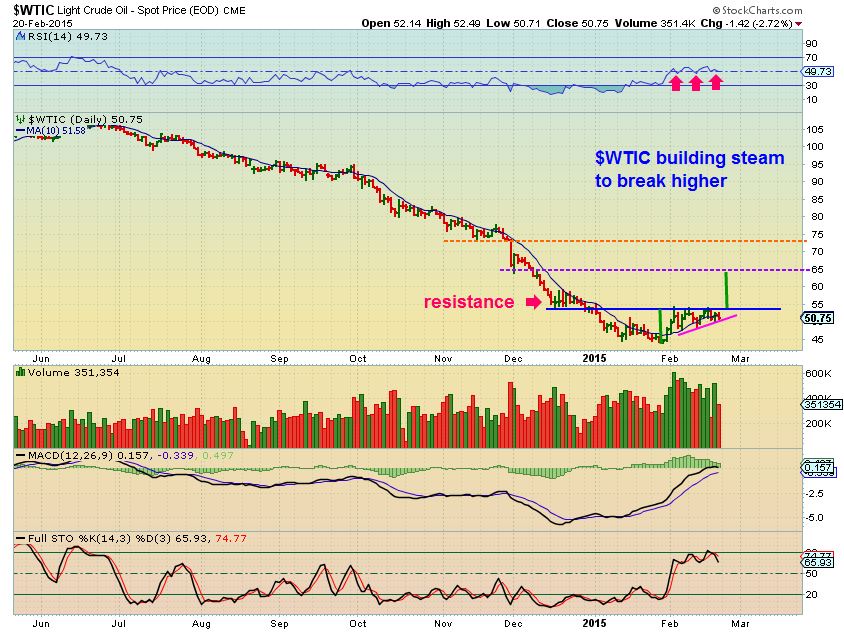
Now look at OIL. I am thinking that this may be an ascending triangle preparing to break out higher. It doesnt look like a bear flag to me at all. Some take the measured move from the lowest point before the break out, others add it to the break out. I am merely showing a measured move that hits resistance near $65
I’ve been bullish on OIL & NATGAS for a few weeks, so I have posted reports on ENERGY Stocks that should benefit from such a break out, but also…
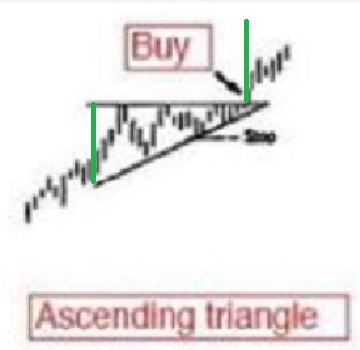
The proper way to buy this as a “trader” – a quick trade in OIL , is to buy the break out and put a stop below the lowest point before it broke out as shown below. EXPERIENCED traders looking for a fast 3xETF could buy UWTI when OIL breaks above its triangle. Use the oil chart, not UWTI chart.
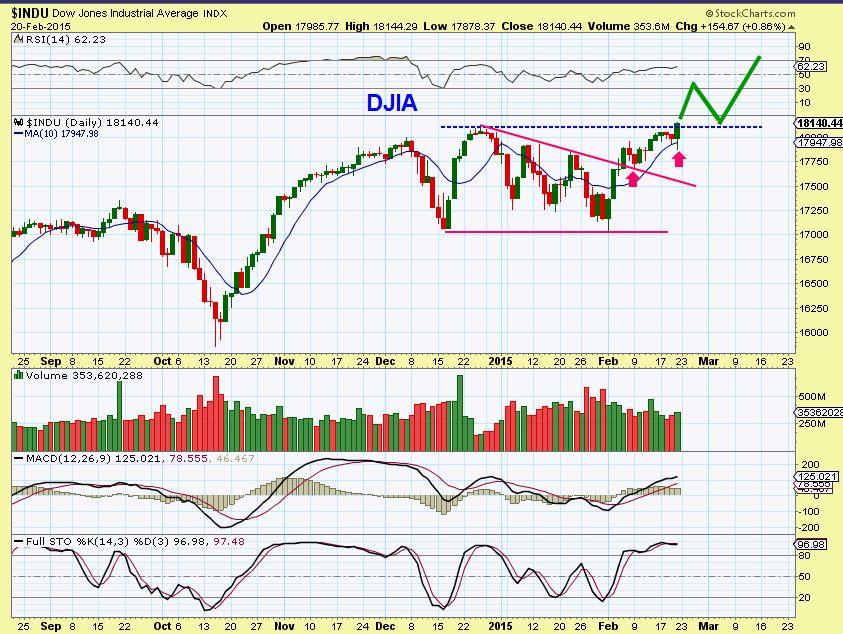
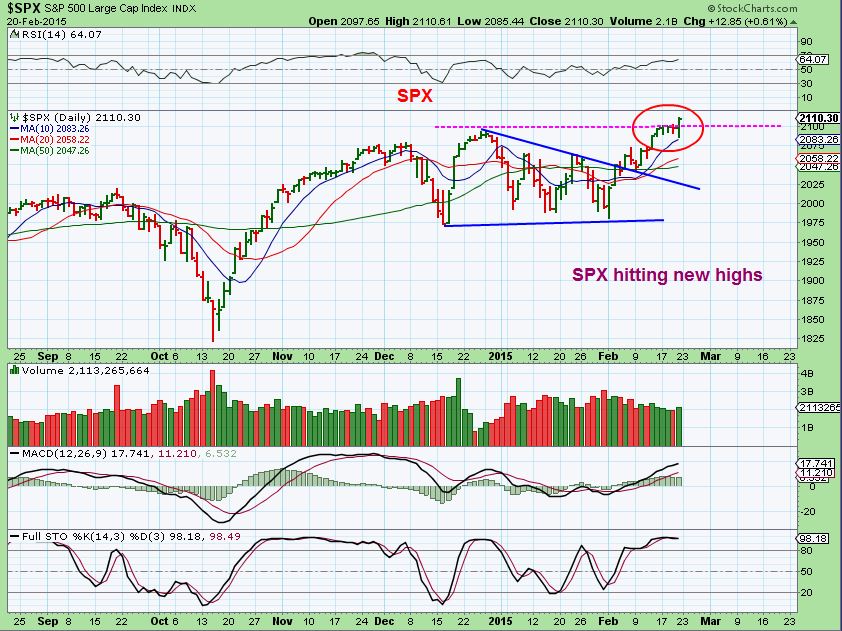
As for the markets themselves, ( DJIA, NASDAQ, SPX) they have broken out of their triangle consolidations as expected and continue higher. The Nasdaq / QQQ’s had already made new highs, and now the DJIA & SPX have joined in ( see below).
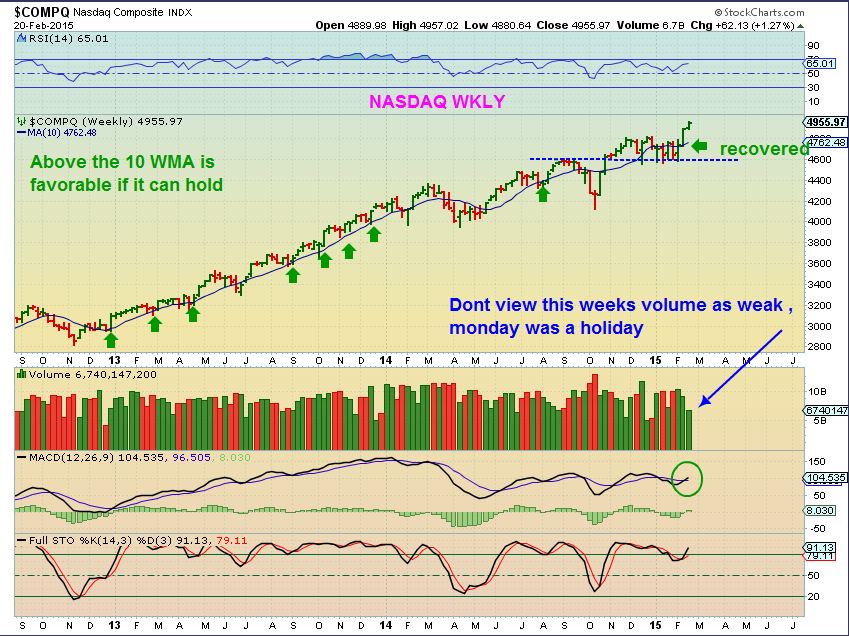
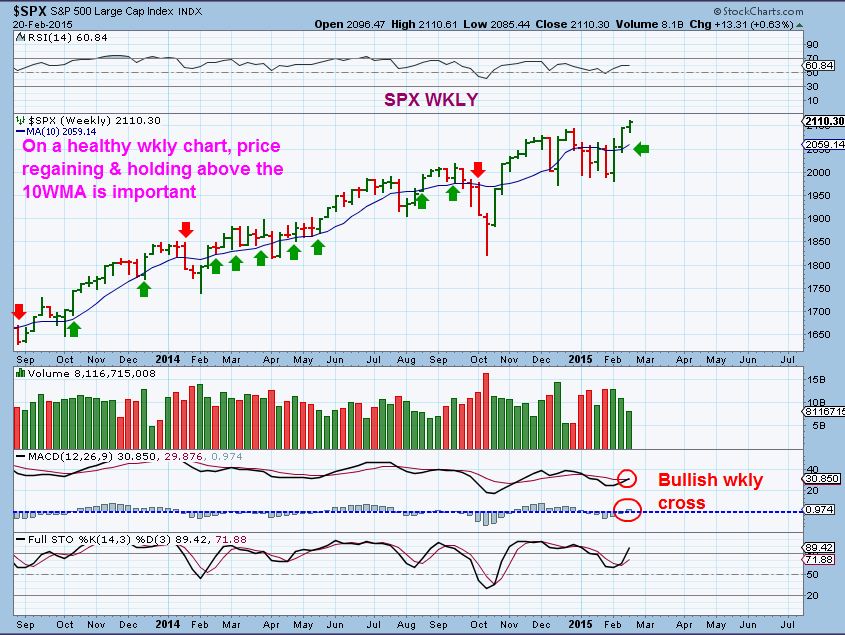
I still see a mix of some individual stocks failing with earnings release, yet others are breaking out higher. The weekly charts look Bullish. Rising above the 10WMA has acted as prior support and the wkly MACD is now crossing back to positive after the recent consolidation.
GOLD hasnt really done anything different from the prior reports on it. It is having trouble finding traction, but it is due for a bounce ( 3rd daily cycle) .
I posted these charts below from Feb 18 with GOLD at $1212.80 after reversing from a low of 1197.20. It was a possible daily cycle low and we’d expect a bounce that may last 7-10 days.

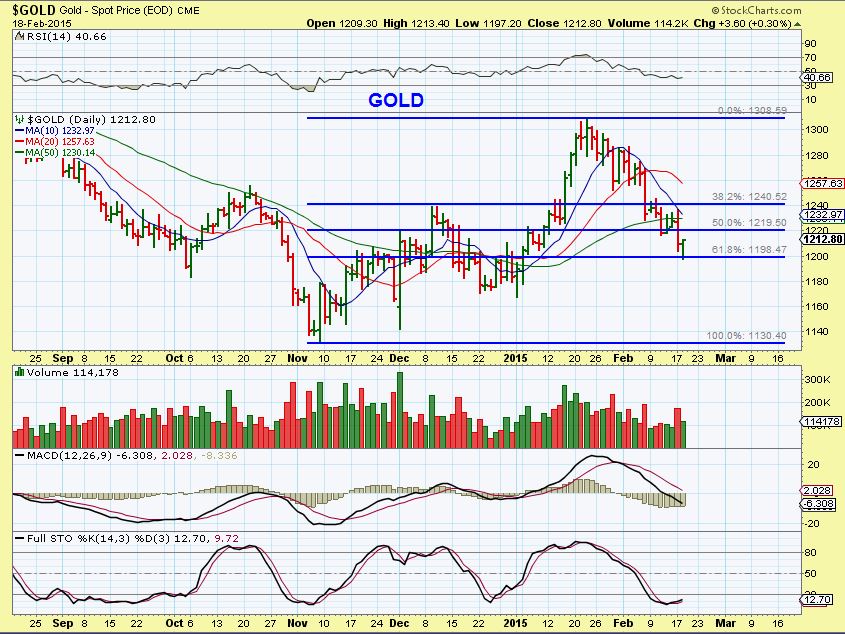
Gold is currently 1203.30 and the low of 1197.20 in the above charts has held. We will be watching for that low to hold or fail Monday .
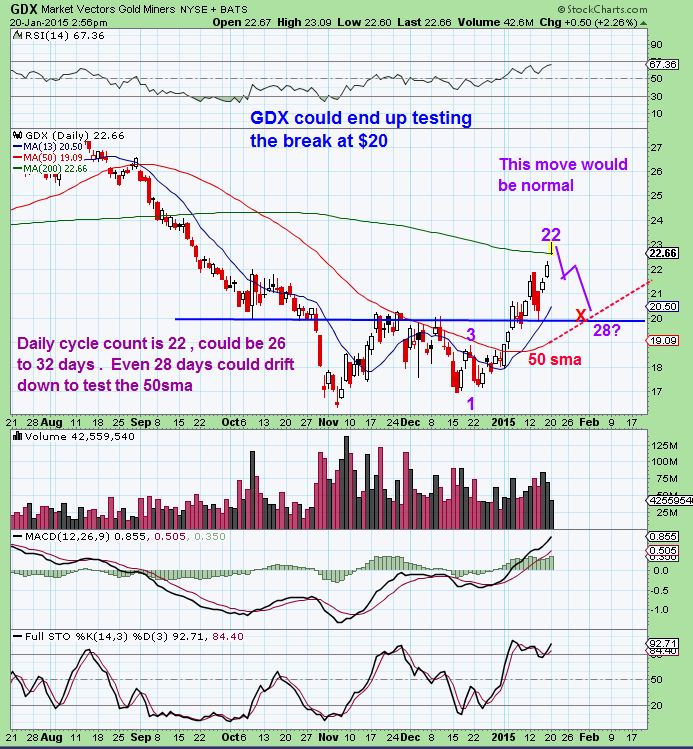
GDX– I have posted many charts showing that we could get a pullback to the 50sma near $20. We have landed on the 50sma, but cycle -wise this is ridiculously extended. I expected this to happen a week or so ago actually.
I posted this as far back as Jan 20 – a sharp drop to the 50sma by early Feb???
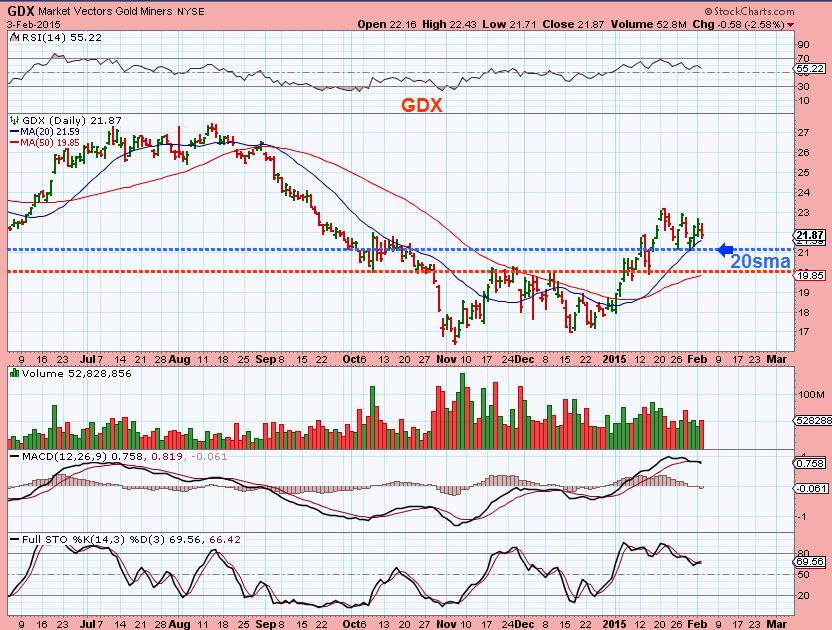
FEB 3 – ‘flagging’ at the 20sma or dropping to the 50sma below it?
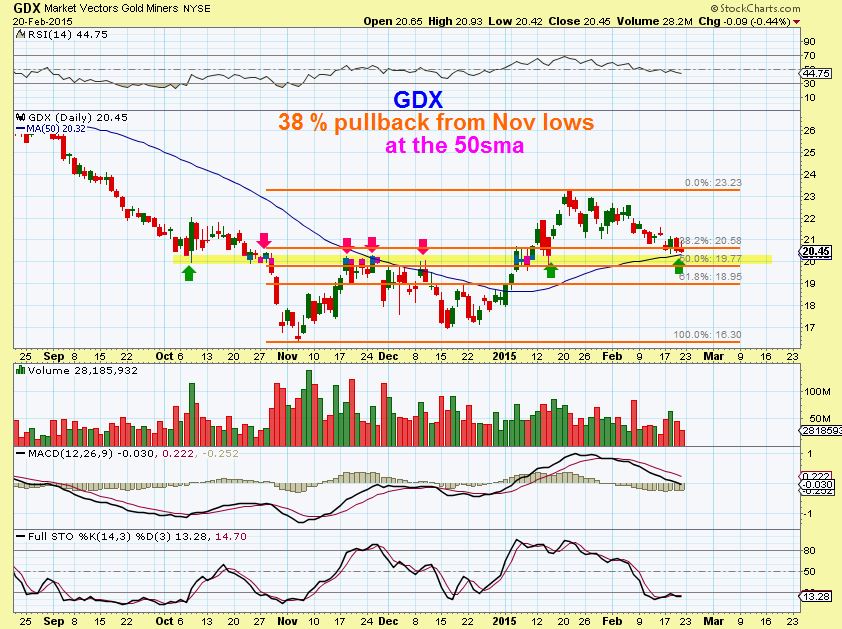
Friday Feb 20, still in that area?! Dragging on still holding above the 50sma & near the $20 . Like GOLD , it put a low & reversed Wed. Will it hold? We will be watching Monday.
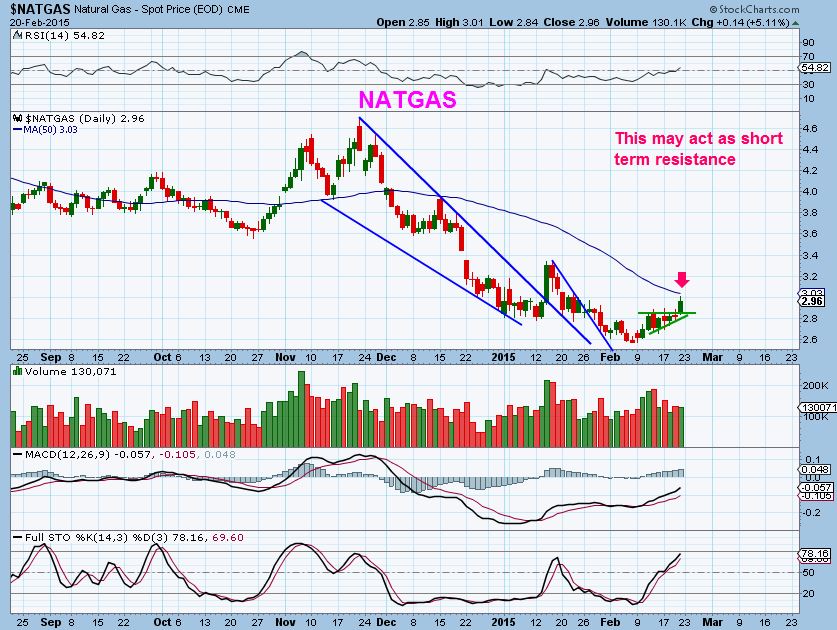
Lastly, I have been bullish on NATGAS for weeks as it has bottomed. Feb 10 …
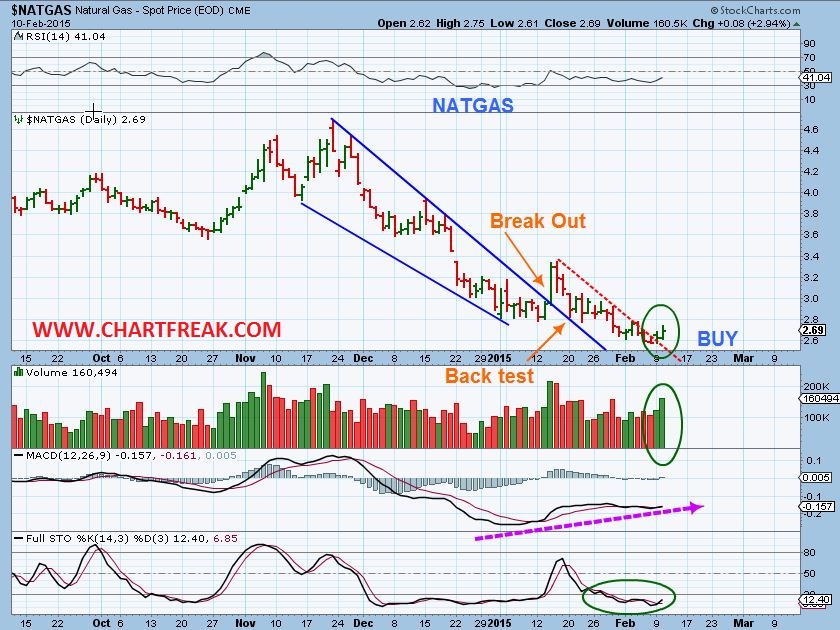
NATGAS NOW after bottoming in a sideways move ( I expect higher prices, but the 50sma may slow it down temporarily )
I was asked to mention Rare Earth stocks
They have had a short covering rally and then some !! looking at them, some have shot up 400%, right? They have done what I was hoping some of the ENERGY stocks might do. Well, right now they may be ‘trade-able ‘ for some, but I dont view them as low risk at this point, so the choice is yours.
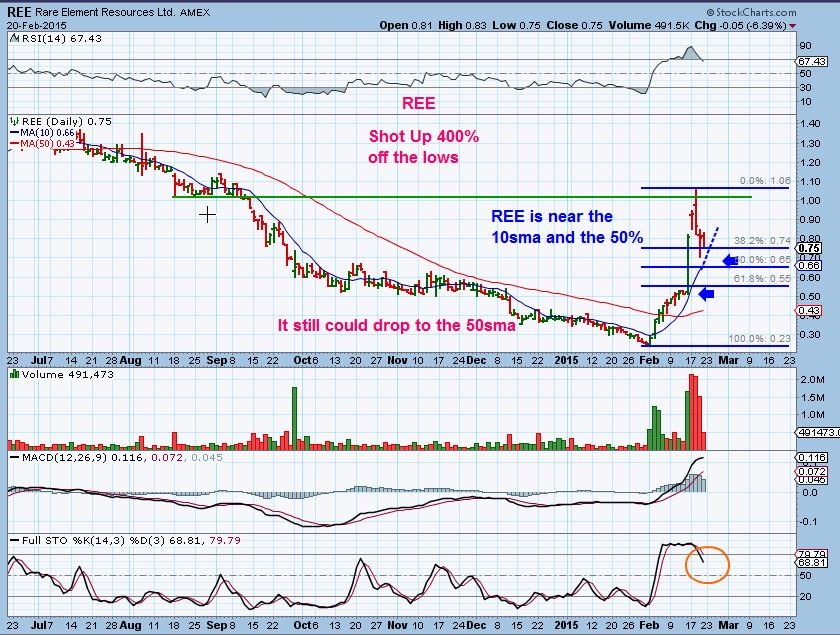
For ex: they can be played on a pullback to the 10sma, but that doesnt mean they’ll stop there. Shooting up 400%, they can easily pull back 50% of that move or even more. I will throw up a couple of charts, but I cannot recommend them as safe trades. I will just point out points of interest.
REE is near the 10sma and the 50% re-trace, which could be a buy point, because support on the left is around 66 cents, but if it continues to drop to the 50sma from here? Price gets cut in half again
MCP is a little safer set up and could become a nice set up if it drops further. It is holding on the 10sma, but a drop to the 50sma is a safer set up. Its an inverse H&S & closer to a 50% pullback.

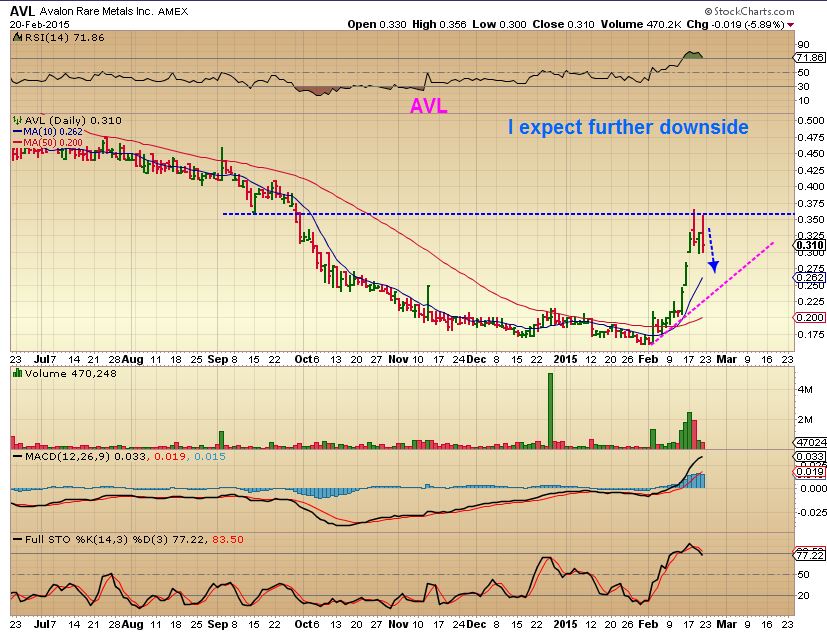
AVL – I just expect more downside , not sure how much since this one ran up ‘only’ up 140% : )
So it’s basically more of the same, we’ll have to see what this week brings. The equity markets broke out and have moved higher. Gold , Silver & Miners we are still awaiting proof of a daily cycle low. OIL, NATGAS , & ENERGY are where my investments are currently for the most part, I think that there will be more upside . I will look to see if there are any good set ups elsewhere, like in Tech stocks, etc. ( I reported some on the energy stocks that I think are still valid, some are still low risk entries since your stop can be placed right below – see my last few reports) . I’m hoping that this week may help to clarify the situation in GOLD/MINERS with some real upside action.
Happy Trading!
~ALEX
I am releasing this report late Sunday night ( early Monday Morning here actually), because I will be away from my desk all of Monday morning. Any comments left in the comment section will be answered later in the day. Thanks!
WHY ENERGY? 
 Looking For SIGNS
Scroll to top
Alex: if one is long in #gold, should the stops be placed just below 1197.20 or should one not have stops at all at this stage?
Hi Rick,
I think you should always have stops in , because nothing is certain in the markets.
Where you should have one would be based on where you get in also. Then if we are in the timing for a daily cycle low, you also have to decide how far down below the lows you put it in case they run the stops & reverse it higher.
Today may have been one of those stop runs
Alex
Where should UGAZ be bought now ?
I was gone today, but you would have waited for a pullback. today we got a pull back in NATGAS, so it looked good for a lower risk entry, but you need a stop in case the selling continued.
WTI (OIL) still on course Alex? The Hour chart below looks like its trying to turn higher!
OIL looks “OK”, more in the report
We Miss You ALEX !!!!
: )
Alex,
Could you please do a quick update once again for AG on your next report…should we expect a bounce over the next couple of days or further weakness…it sliced right through the 50 day…….thanks
It came out with earnings today and was one of the PM’s with a large impairment charge. The others with weak earnings EGO,
CDE, PAAS all with impairment charges have generally been under-performing for a bit after the news. I think they are a good company and will do ok when PM’s really turn up but in a short third cycle might be under-performing for now. Depends on your time horizon. JMO!
I somewhat agree …if we get a good bounce in the 3rd daily cycle, it may bounce back. I’d wait & See if it recovers the 50sma… if someone had a stop below the 50sma, you may be out.
It did reverse at the end of the day so some buyers are out there.. but DOJI candles can be continuation candles too.
Alex, if it makes sense can you run through other possibilities with gold? I know what we are expecting but are there other scenarios where it just keeps dropping, like 3rd cycle is straight down? Keeps trying to do everything to throw us off!
Staying strong in energy, hope to see oil try to power up this week!
The gold part of the report is written, it may help.