I wasnt going to do a Friday report, I was just going to allow yesterdays report to speak for itself, but lets just do a quick review to be clear.
I posted this oil chart yesterday for a reason…
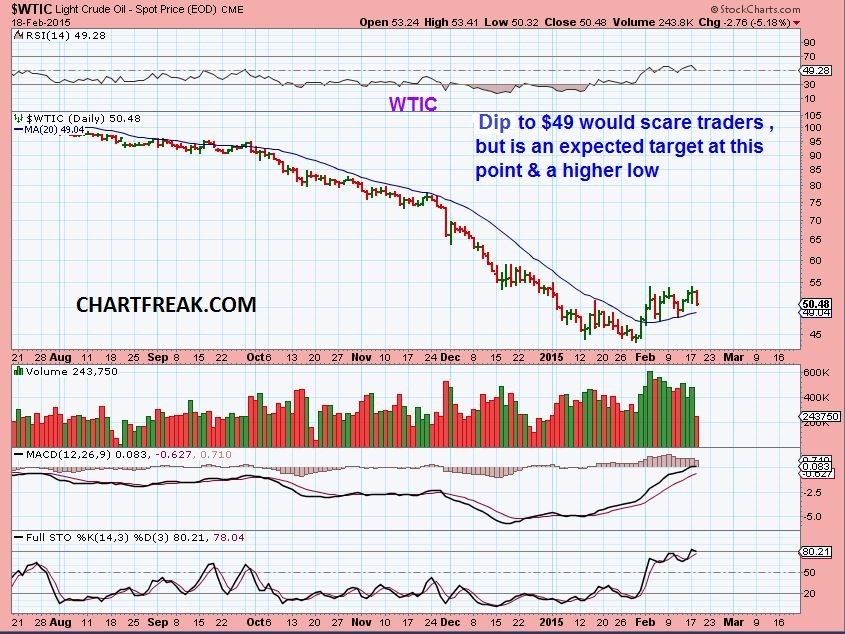
A drop to that area would be a low risk entry…
SO here is what happened ( $49.15 lows)
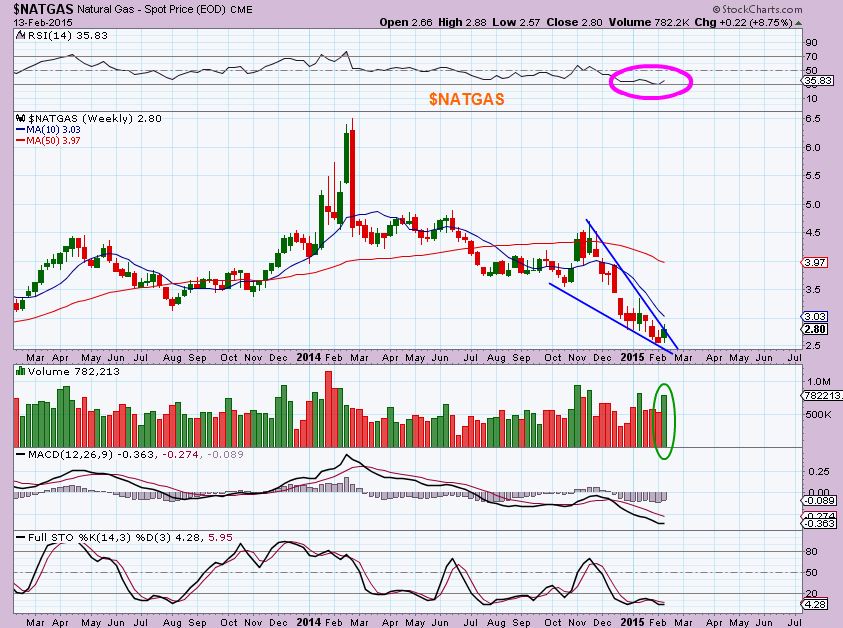
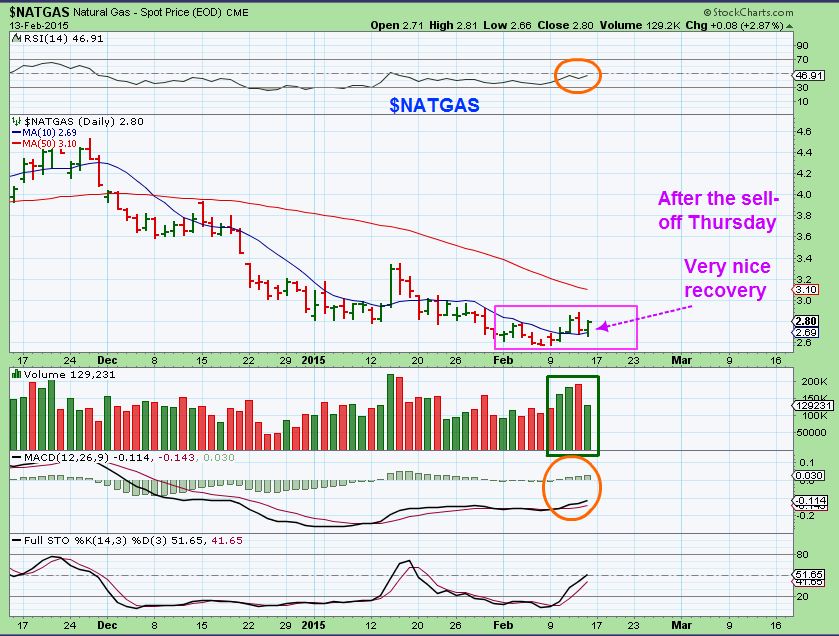
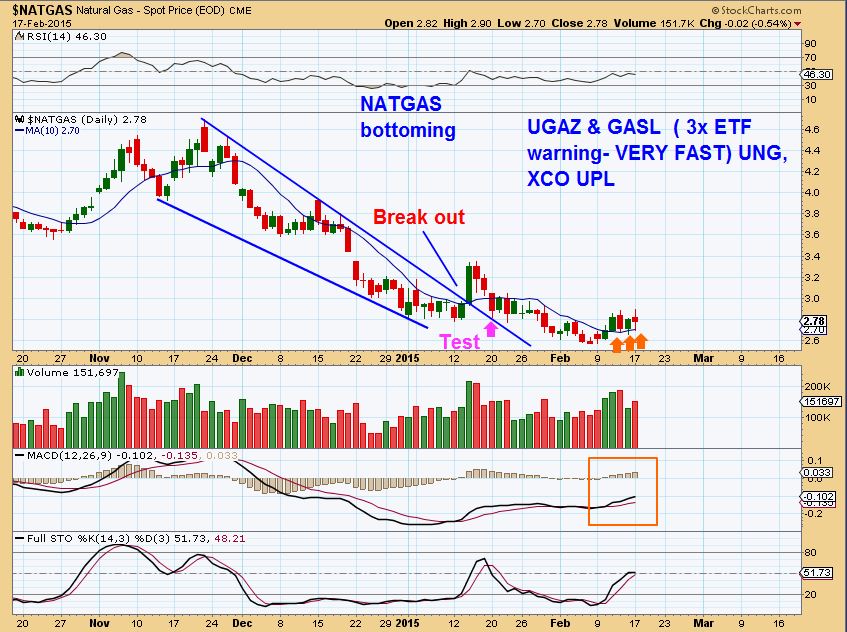
Also NAT-GAS…I get more & more Bullish daily, as I see others get more & more frustrated. A public blog that I read has so many saying “Coldest winter ever & NAT-GAS cant move. I give up!” The charts have been saying it’s bottoming right along , as pointed out here. I Dont go by the weather. In fact, I posted a chart here a while back showing that some winters Nat-gas is up, sometimes its not.
I posted these (Among others) to show a bottom forming…
NATGAS FEB 13 = BULLISH WKLY
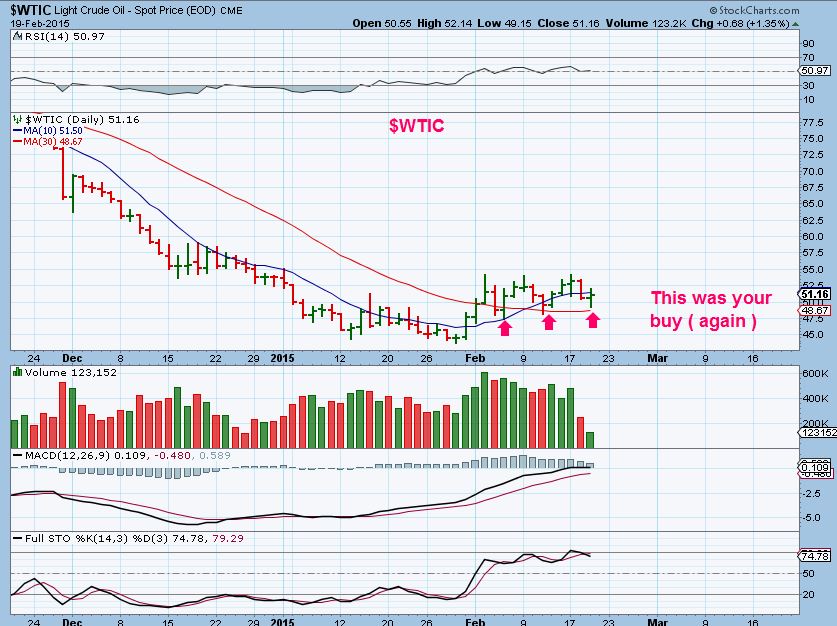
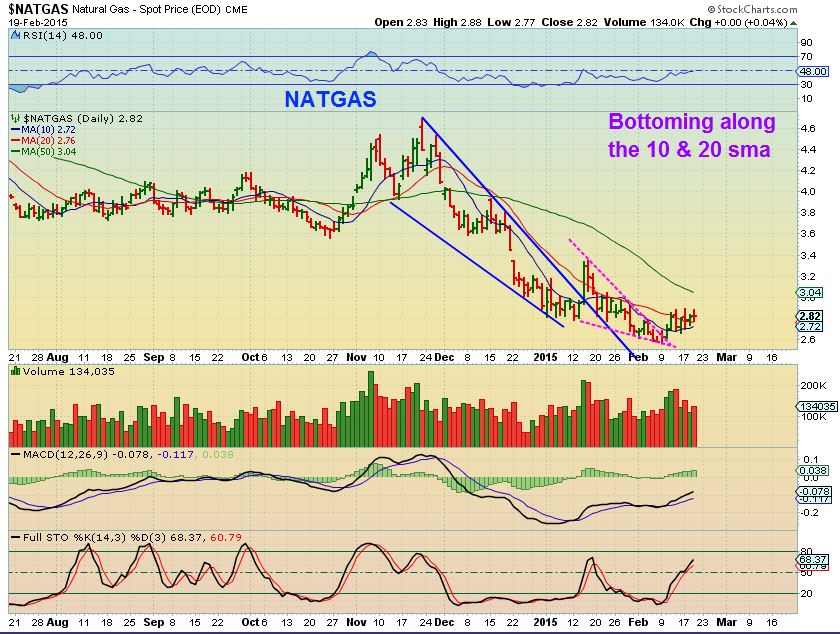
FEB 19
I THINK UCO , USO, and even UGAZ & UWTI for the experienced traders ( leveraged and move FAST) could be bought & traded at these lows & for the next 2 weeks .
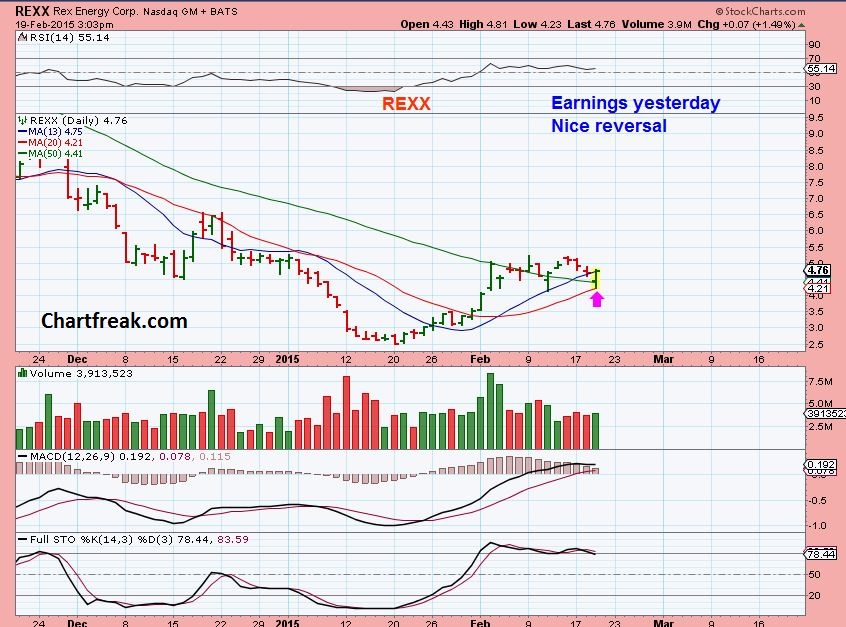
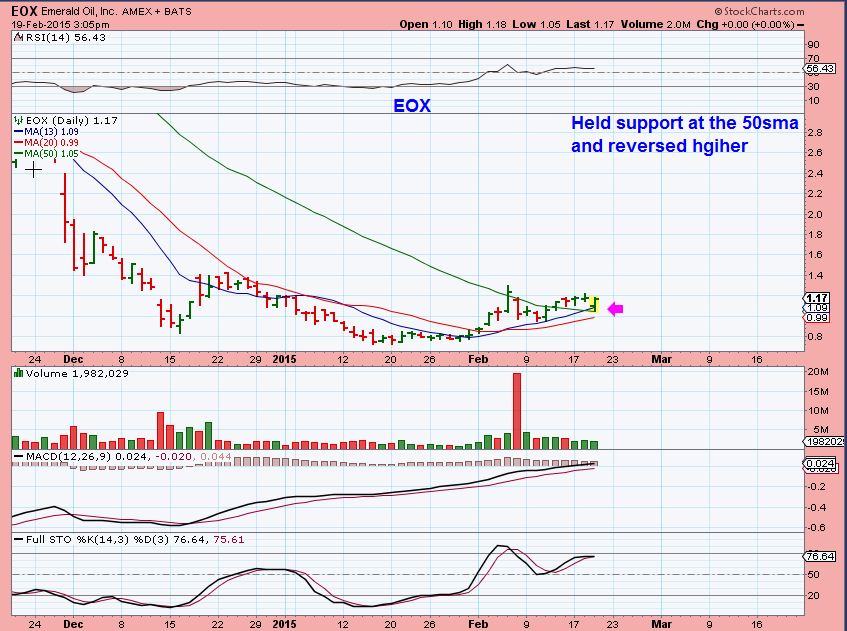
SO I mentioned that I was buying pullbacks to support. For some companies that is a test of the 50sma that holds. Other companies it can be the 10 or 20 sma, trend lines, etc. It should be noted that some companies are coming out with earnings this week and next week. Due diligence if you own energy stocks, look up their news reports and see when they release earnings. you can do this on yahoo finance. REXX already released theirs, so I bought REXX yesterday at support. See the chart below.
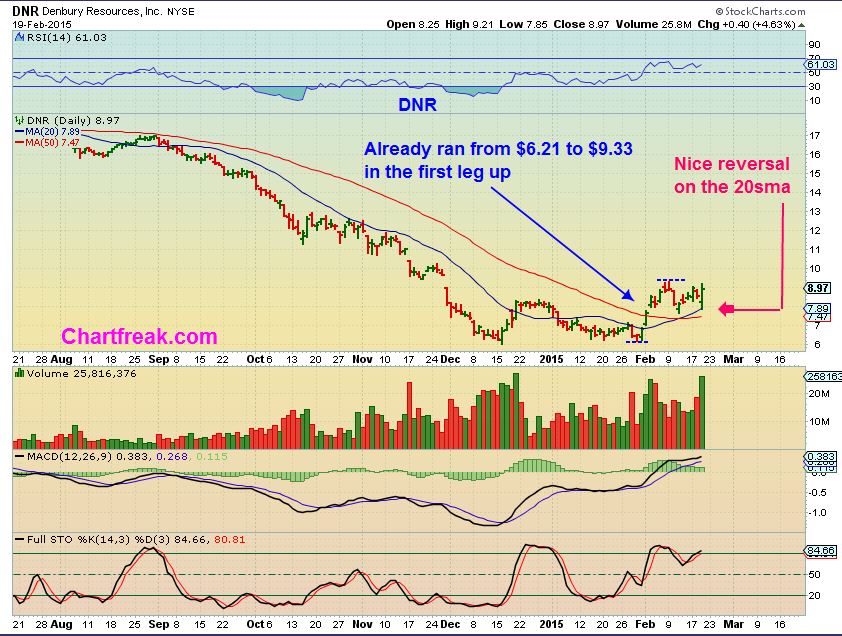
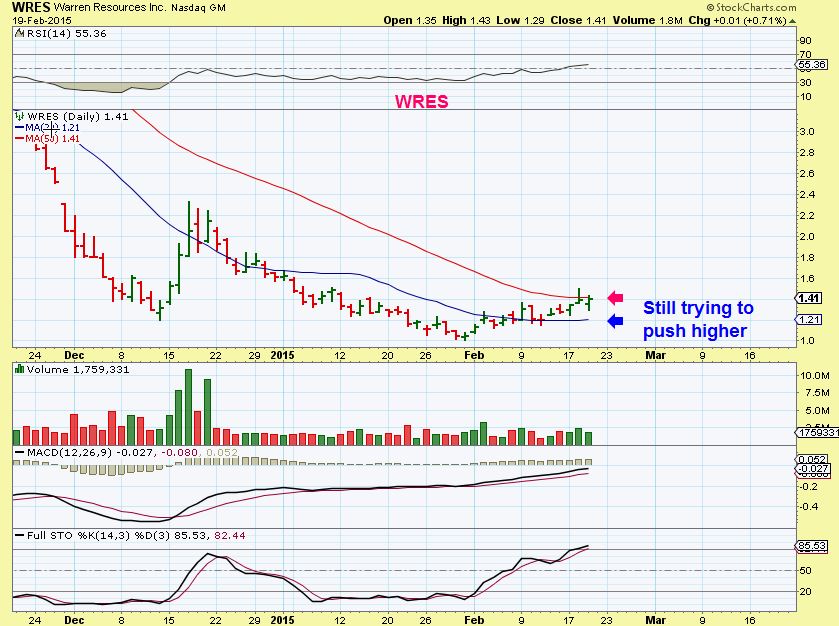
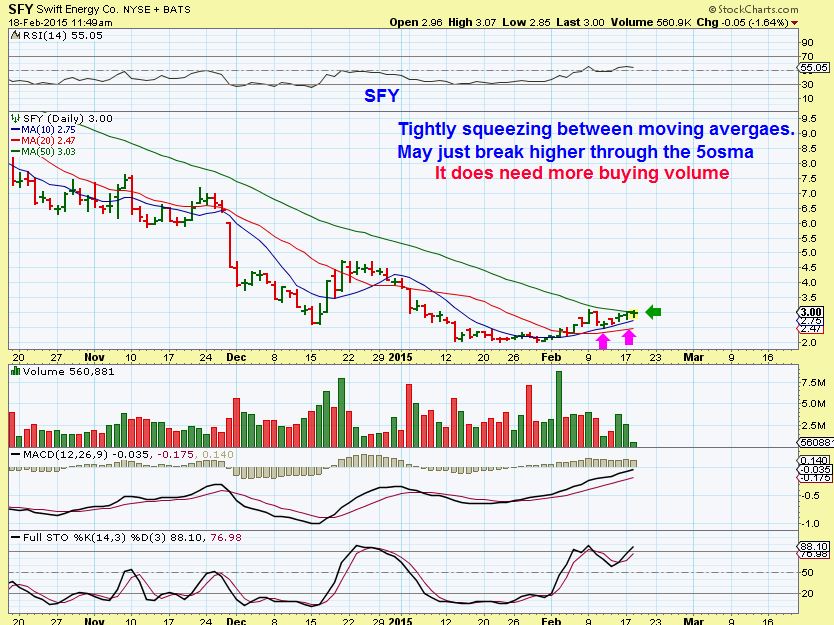
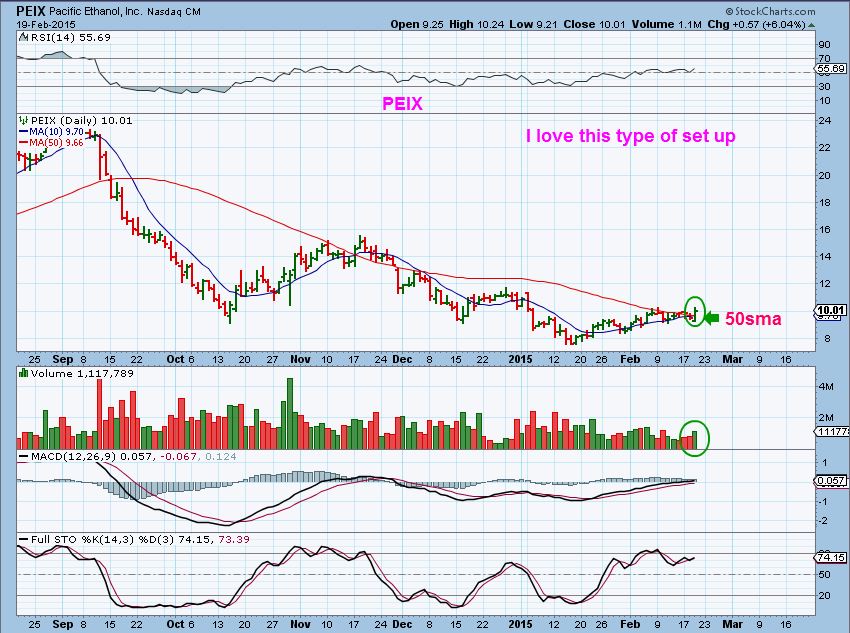
Here are some charts that I liked showing reversals at support. They can be bought. Some are cheap, some are avg price.
PEIX _ I really like this tight squeeze & POP higher. If you look at a 3 yr weekly however, it looks like a giant H&S…so keep that in mind. This set up looks like it wants to break higher & run right now though. This can go from $10 to $12, $14, $16 in no time .
There are MANY, and I still own GDP, NADL, WRES , etc
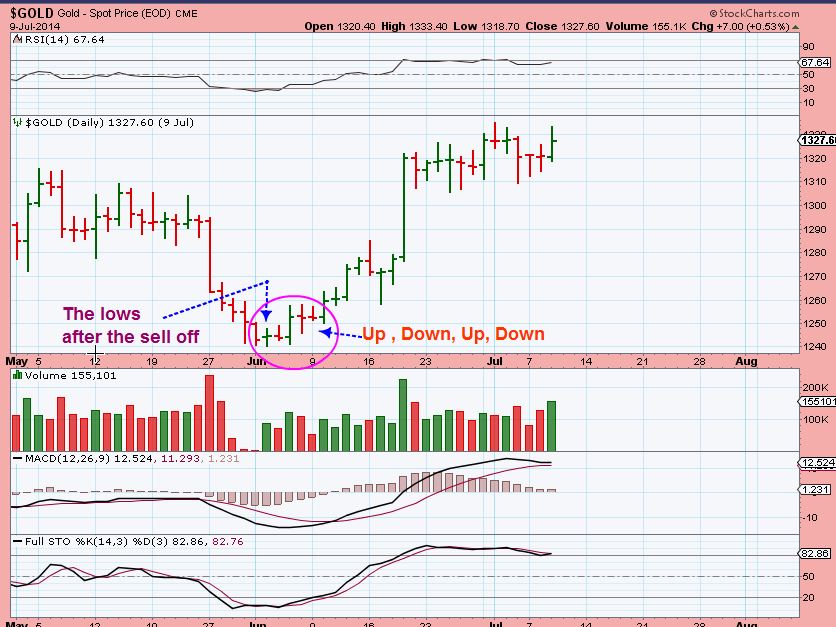
GOLD put in a swing yesterday. Will it hold? Who knows, but the timing is right. It is often lackluster at the lows, so I posted this chart of the MAY ICL bottom in the comments section yesterday. It simply shows that we dont always blast off out of lows, and thats why people are afraid to buy near the lows.
I’m not saying , ” Jump in and Buy Gold/Miners here” , because this is a 3rd daily cycle and can roll over after 8 days. I’m just saying that a swing came yesterday, and the timing is right. Some stocks had earnings that hurt their beautiful charts and other nice looking charts got cracked too , like PAAS. Earnings reports affected GFI, GG, CDE, PZG.
Some are waiting to see if this is a weak move higher, and may short the end of the 3rd dcycle and if there is a 4th, that one too.
I am planning on posting a public report on energy later today, so I again wanted to post here first. I have posted here about Energy for weeks and had “THE DOGS ARE LINING UP” parts 1 & 2 earlier this week to give my premium readers some stock picks, show set ups that I am looking for , and give you time to adjust to the Energy selling/ pullback. You may want to re-visit those posts for more charts on Energy stocks too. I wont post until an hour or so after the open. By the way : If I post in the public section it doesnt mean that suddenly everyone will start buying & push price up on us if we haven’t entered. Some public readers dont really know me, they may not trust what I am pointing out, etc . They will just watch to see if Energy / Nat-gas does do another leg up.
Have a great weekend and thanks again for being a chartfreak reader.
~ALEX
We Love Swings! 
 WHY ENERGY?
Scroll to top

Thanks ALEX…… very nice to hear from you again !!!!
Where do you see the price of oil resisting?
I mean as example, do you see oil up to 68 dollars?
It is at resistance right here, then up to $65 to $75 looks possible, but that doesn’t mean it goes there necessarily.
THANKS so much, ALEX
thanks Alex, you are my type of trader, trying to get the bottom for the move up. Great education on the energy trades, which will speed up my learning process
Thank You Marinho – So far so good, the set ups from Miners to Energy have been pretty sweet.
Glad you are considering it an education too!
In the past when my reports were all open to the public, Some just wanted me to post “Where do I get in, where do I get out. Dont need to tell me why. “, but I personally cant take a trade without understanding it or I wont understand why it fails or succeeds if it does.
Alex, it looks like if we close today where we are this morning on Natural Gas then we will have a close above resistance on a weekly basis with the pattern of a bullish falling wedge. Does that sound correct to you?
Hi Shermo,
Yes, we are above it now
Alex. What about KEG
Hi Gracegift
Keg is ok, and had a nice run, but it got quite a bit abiive the 50sma so its kind of consolidating here. Its struggling a bit with overhead resistance, but doesnt look “Bad” . EARNINGS CAME OUT Feb 18 and stalled it .
It is above the 20sma…I’d like to see that hold, so it doesnt drop to test the 50sma. AT a glance, I see that it could break higher from here or MIGHT drop to the 50sma or go sideways allowing it to catch up.
thanks
perhaps bull call spreads for options on ung?…..
Perhaps
Good report Alex, as usual. Like you, I like natural gas here and own a bit of UNG. I’ve made money on UGAZ but have learned that its volatility is not for the faint of heart and one must exercise caution when buying UGAZ. FYI Alex, one stock you mentioned, ERF, beat earnings by a healthy $0.46. Company management aside, perhaps the sentiment toward the energy complex is due for a turn toward the positive? Thanks for all you do to help us become better investors and traders.
Hi CF
I saw ERF this morning. It has the same set up as REXX and I bought REXX because earnings were out already too. ERF actually looks better today. I like that set up . And thanks for the kind words too.
Alex, For weekend report could you update SOL, if possible. Seems to be holding the 50dma, but sadly that’s trending down. Seems the sun is not shining too brightly on this one.:-( Thin volume to boot…Thx!
Hi Deshy,
I owned it and YGE …I sold for a tiny profit simply because it didnt do as I had expected & I got bored ( I expected a good pop) so I wanted to use the money in UGAZ.
Its not bad, just lingering. Let me post a chart so you can see it during trading hrs and decide to hold or sell. Got overbought and may sell the stochastic down 1/2 way, forming an inverse H&S. If you’re going to hold it, I’d make sure its above the 50sma. Click able chart to enlarge
If you want more, like a wkly, I can do it in the wkend report.
Thanks muchly!! No need for a weekly on my account. I had the same thoughts as you which leads me to think I’m getting bored as well…
Actually Deshy, thin volume on a down day is ideal. Can indicate sellers are drying up at the 10sma..
Hi Alex,
Do you have targets for UNG?
referring to the comment about you think UNG can be bought and traded for next two weeks, do you mean you expect bouncing on the mda?
Hi Jay,
Ung has great volume today , but is tagging the 50sma. I think it can break above in time. No definite target yet, but…
The reason I was saying tht is the type of low I think is in in OIL / NATGAS could be that meaningful low that lasts for weeks. The only problem is ( like we have seen) sideways too long building a base can rob the leveraged ETFs or calls, etc. I am not expecting a big drop …I have heard some say OIL is a bear flag. I have taken the long side. Hope that helps?
Ok gotcha
Bought REXX on Tue afternoon after it pulled back to the 10ma and reversed higher, only to have oil drop over 2 dollars the next two days, which cause REXX to blow through the 10ma hit the 20ma and reverse higher….this caused me to get stopped out with a 10% loss. Should I have played this differently? I was also watching oil, it did the same thing…Tue, it hit the 10ma and reversed higher, only to blow through the 10ma the next 2 days.
No Harry, I think you played it correctly for that time. It was a time of uncertainty for REXX, because earnings were coming out and you played it safe.
I also was watching it for a buy on the 50sma, and when it broke it yesterday, I also was very hesitant, I thought it might keep selling.
As soon as it reversed higher off of the 20sma and re-gained the 50sma, I bought , because the earnings news was out and the reversal looked strong.
Harry, almost same story here. Timed my REXX purchase terribly, well above support and just before earnings (not sure what I was thinking). Had stop just below 50 which got run hard on Thurs opening. However, saw earnings report was favorable and oil was down 5% on API numbers, which are almost always higher than Energy Dept official numbers. So I lifted my stop for first hour, hit support at 20 and then oil started recovering at 1030 report release. There was also a hectic email from me to Alex in there!
So, might have been dangerous if it kept falling, but saw possibility of stop run and selling overdone so held strong. Still in REXX, stop back at 50 day, but I didn’t add unfortunately. So, 2 day rally just got me back near breakeven, but I avoided a loss on what should be a solid trade. Point was just to share a technique So we can learn from each other to. Had it closed down at those levels Thurs I would have taken loss and not ‘gambled’ hoping for Fri recovery.
By the way…if you got a midday alert on a premium post…it really isnt…I made a mistake.
That report was supposed to be cleaned up & posted public under the blog tab ( it is there now). I tried to preview it and hit post under premium by mistake. I apologize for any confusion.
Hey Alex,
Are you recommending that we sell any energy stock positions we currently own ie: PIEX due 2/24, NADL 2/26, OAS 2/25, SFY 2/26, the day before there earning’s report come out and then possibly reenter after?
Thats a good idea, and it wouldnt hurt if you had profit in the position. but it also may depend on where you got in & how big of a position.
For example: I own a good amount of GDP, but bought some at the lows near $2.60, then added under the 50sma near $3 with a tag of the 10sma, and added even more after it popped higher and dropped to tag the 50sma. I probably own too much now anyways. so… In that situation I might sell 1/2 before earnings and watch it the next day.
Some are selling off initially after earnings and recovering. REXX for example. Sold down to the 20sma and then recovered .
SO its up to each person, but you always have the possibility of a gap down and wiping out gains, it wouldnt hurt and get in later .
Thanks Alex.
Alex… I’m still in YNDX, what should I do with it?
Whatever you want, but the chart isnt bad. It pulled back to the 10sma and sat on it for 2 days and is still holding there .
It is still acting correctly so far , since it just ran from $14 to $18, it pulled back to $17 now.
Thanks Alex for your very quick response.
FRANK- I keep trying to reply to your email, it gets rejected. the answer si…
Hi Frank,
It does look really good and if Gold & Silver ever decide to go up, I imagine it’ll break out nicely.
Earnings out & they had record sales . I like it .
http://www.marketwatch.com/story/hecla-reports-record-sales-of-501-million-for-2014-2015-02-18?siteid=bigcharts&dist=bigcharts
Oil still look good here Alex, this a dip below 50 to draw in shorts or hit bulls stops? I added a little to the long side today on the dip
Hi Steven,
yeah, it just seems to be a battle of the Bulls & Bears, but the chart still looks good. It looks like it may be forming a bullish wedge , and I’m watching it with the 20sma too.
Exciting that many small energy plays were still up with oil down two weeks in a row. Did end lower on weekly close but Alex’s setups still looking good. So, if oil finds footing again…
Alex- unfort I am still in the metal trade as I was away and left my position on.. It seems like sentiment now on every board/analyst is very bearish.. We haven’t broken down yet and my thought is a quick jam and reversal next week would really create some pain.. We still should have seen a higher 3rd cycle as dc2 was right translated in miners. Thoughts? Ty
I am surprised that we havent had a bit more of a POP, but I do think its still coming with the daily cycle low. Today was so close to new lows. Maybe your scenario (Stop run) or gap up open and runaway next week? tough call.
RM, I am there with you, man. I thought that first reversal off of 50 day would stick. Used short time frame due to 8-10 day period before rollover. As you already know, that didn’t work out; abandoned GDX position at loss (stops hit). Maybe your theory hits on Monday. I fear if we close below 1200 that Maybe it’s a fail, will have to see wknd report and Monday action first. I def expected better.
Oil has also showed support at around $45…..once in dec. And again in January…..if the 20dma gets violated. Do you think it will go back to $45……. Goldman predicts oil to go to $39
Not right now