Have you ever seen Black Ice? living in New England I’ve seen it a lot. It looks like solid dry black pavement, but Suddenly you see someone walking along and Whoosh! , their feet fly out from under them and they are flat on their back. Invisible Ice. Well on occasion, I’ve seen something similar occur in the markets. You’re going along and all things look solid and safe when suddenly…Whoosh! things slip away. I want to mention this now and first off, so that THAT image sticks in your mind when I cover the weekdend report.
Our recent consolidation that was looking a little Bearish in many ways (as shown in prior reports) Got Draghi juice and suddenly looks a little more normal. This is the SOX index on Friday
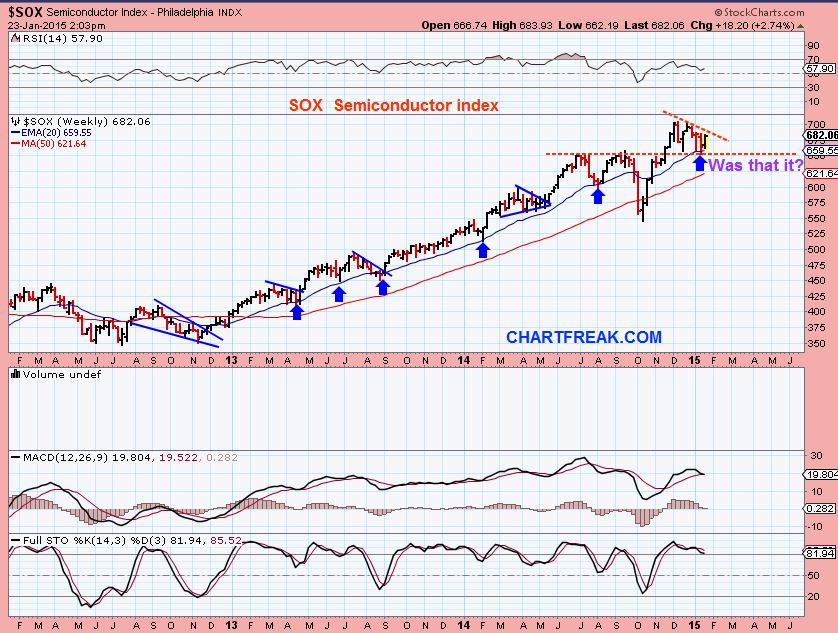
Does that mean we’ll break out in Bullish fashion soon? …
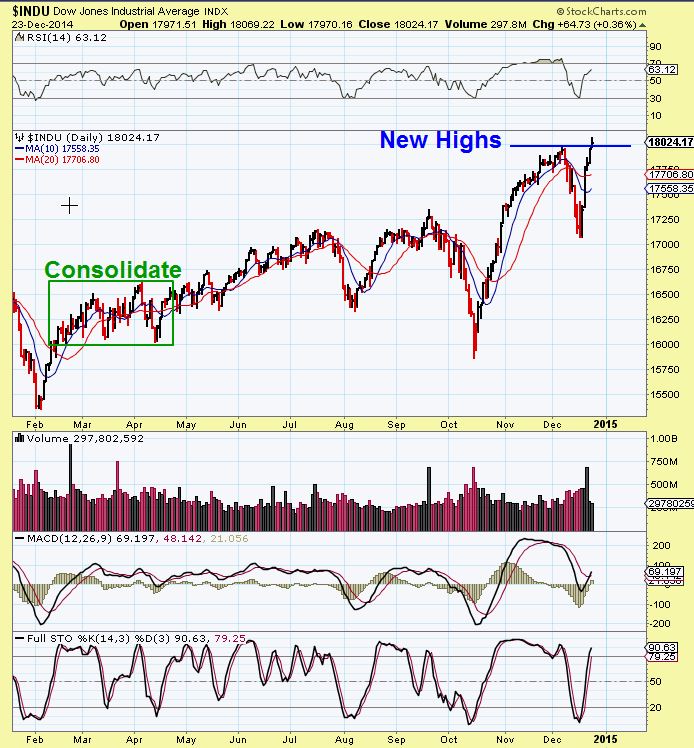
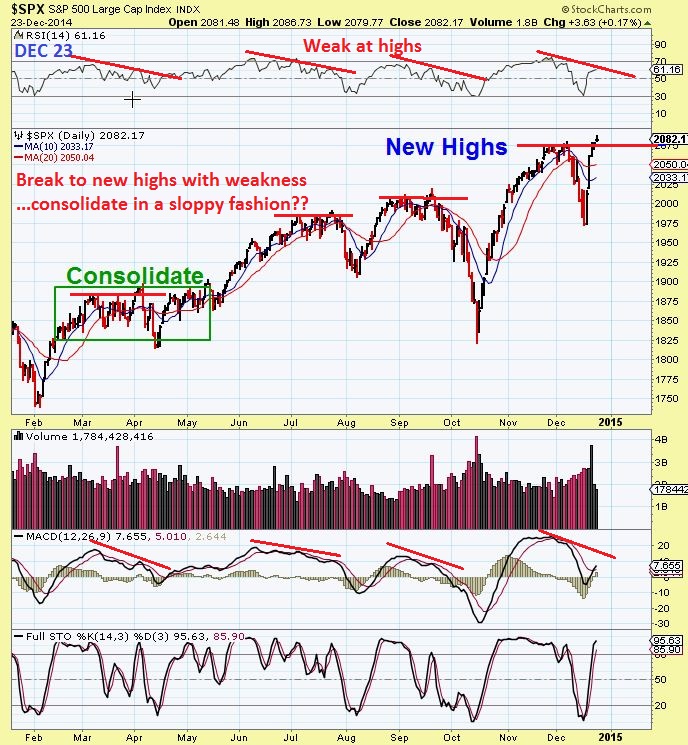
Possibly, sure we could , but Let me post a reminder that I had noticed in DEC. I pointed out that after a break to new highs with signs of weakness, we often get consolidations. They can be TRADING RANGES, so you may find some good trades, but they are usually just trades inside this consolidation . I posted these charts then…
They show that a break to new highs with weakness can cause a consolidation like we saw in March & April.
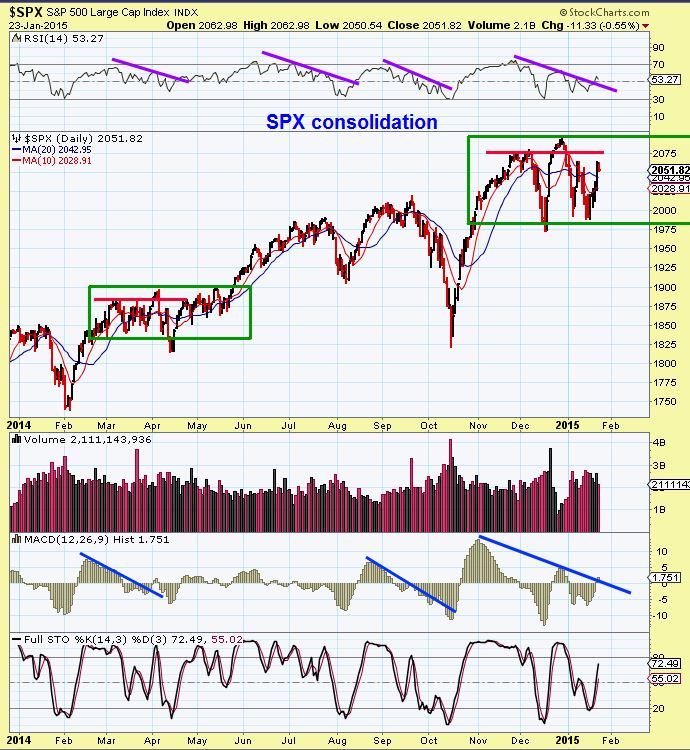
After looking at the above SPX…notice what we have now exactly 1 month later. Consolidation.
The consolidation that I had pointed out in Feb through May was 3 + months, so will this continue? It still cannot be determined, but I do still see weakness.
I am thinking that along the way, there may be individual “Set ups” that form, but trading the indexes may need further follow through . This may be why I am seeing set ups like I mentioned in CREE, CY, ONNN, TSEM in the Semi-sector. See my SOX article under the “Blog” tab.
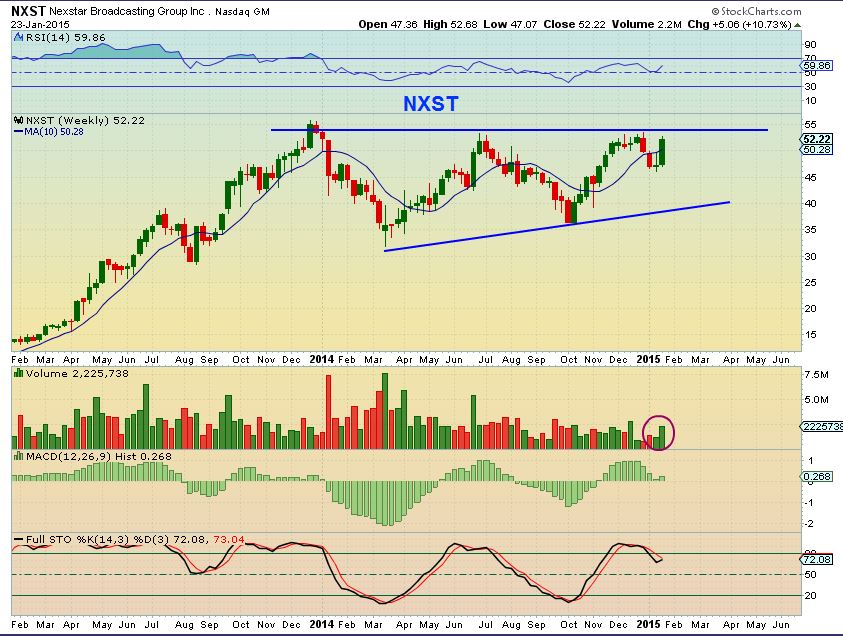
I also mentioned that I was noticing set ups that I liked in the media sector . NXST looks great ( see the weekly chart below ) It looked like it started breaking out on a daily last week.
This could drop to the lower blue line, or just break out from here.
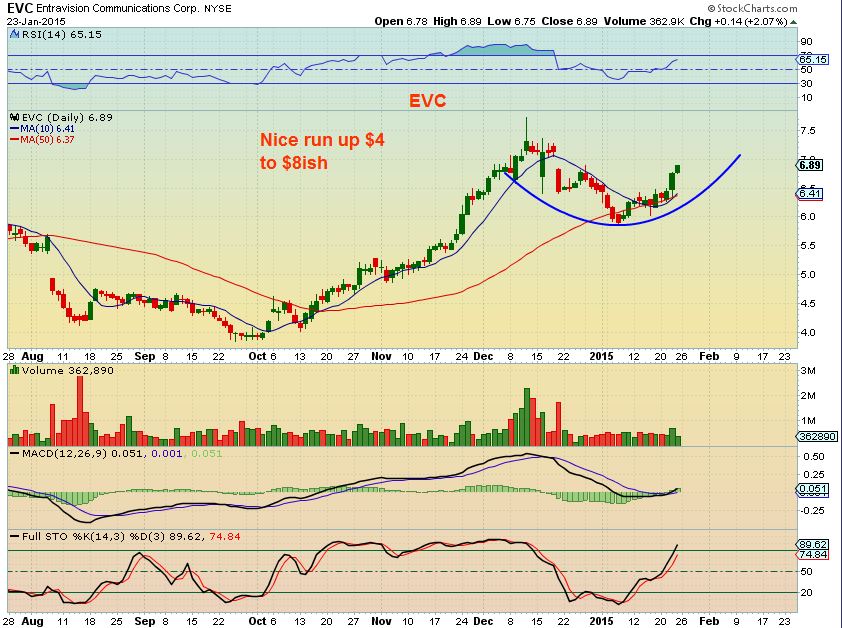
Looking at EVC…it also looks like it may be setting up for higher prices. I think this could break out, Buy if it drops to the 50sma.
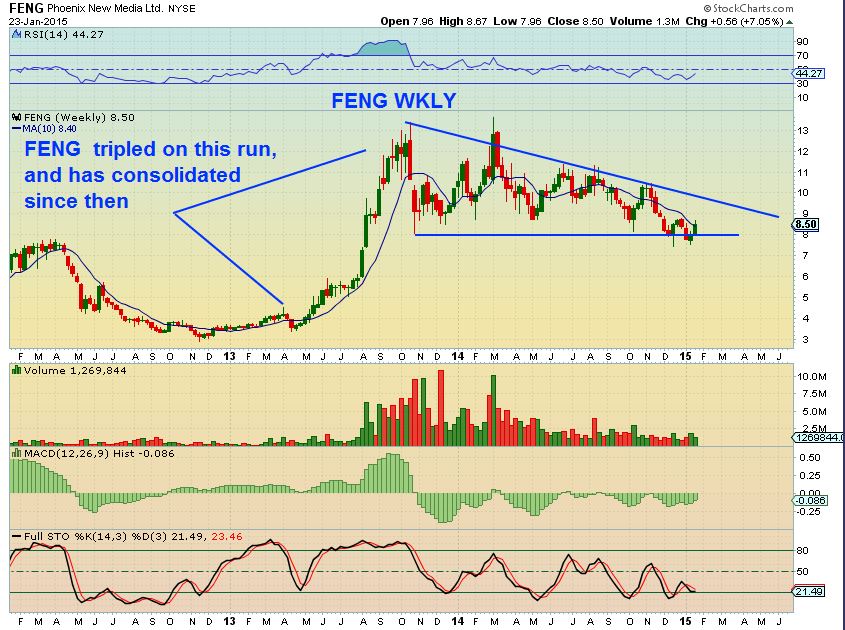
FENG WEEKLY is also looking interesting. So again, I am seeing signs off possible set ups forming. This is the weekly ( Run up & consolidation). It could be bought around here with a stop below recent lows. See the daily chart below . Sell profit at the upper blue line.
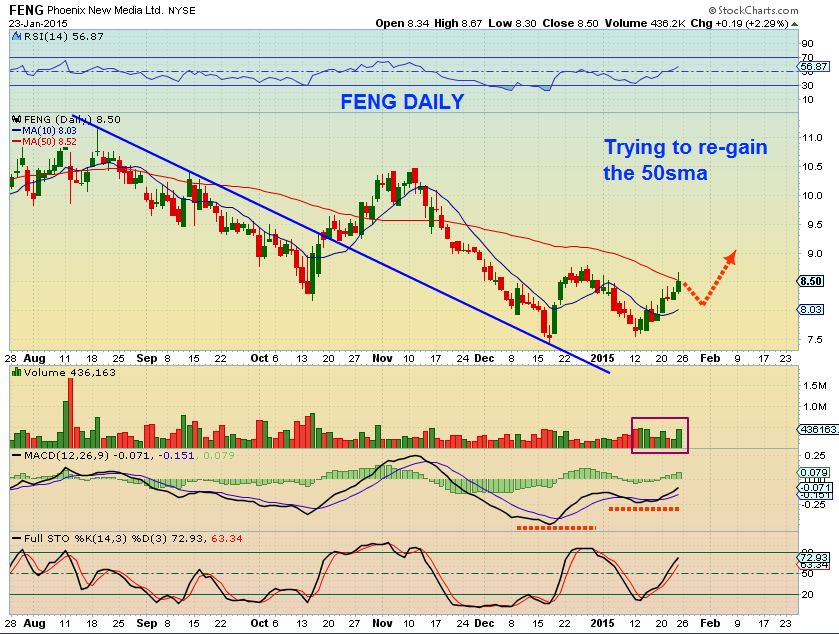
FENG DAILY – double bottom recently. Rejected at the 50sma, buy a dip?
The markets direction is uncertain right now, it may take a few more days for things to clear up, but above I just wanted to show a couple of sectors where more than one stock is beginning to set up in an interesting manner. I look for that as a start, and if a couple break out, you may get some nice low risk buying opportunities Pre-break out or on a pullback.
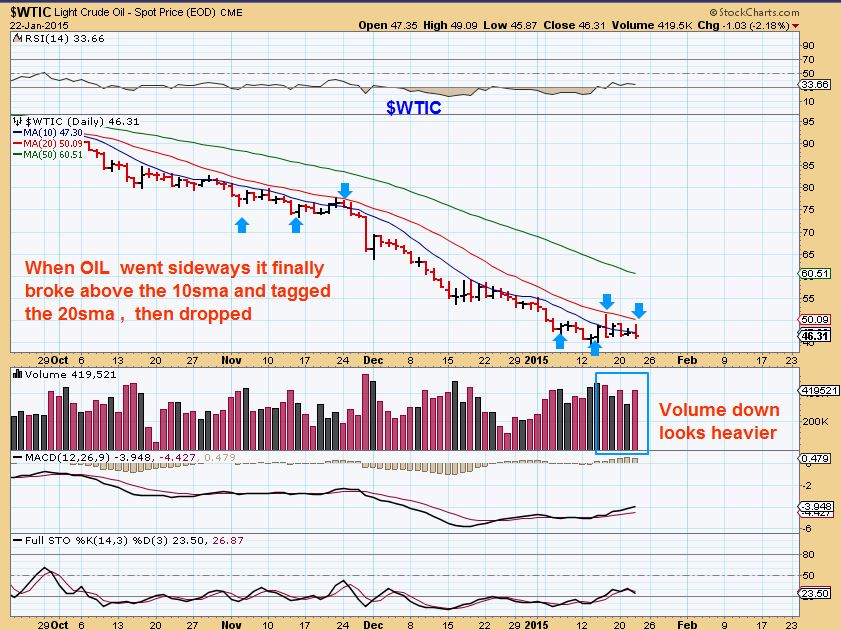
WTIC – ( This is Thursdays chart) shows Oil may be putting in a bottom, but you can see that it has done the same old same old. Sideways along the 10 & 20sma and drop. THIS TIME I do see the MACD rising, and with Fridays drop, it continued higher, so we may get a little bounce, but I cant recommend anything safe. Some energy stocks have acted well, like KEG, HK, VLO, XOM, etc I am just watching for now.
GOLD / SILVER / MINERS – SO MUCH TO SAY
This is where I want to emphasize the slippery slope. As a trader, I can trade individual Miners and I know many of you have written and want to also, but you MUST understand that the odds here are NOT in our favor to buy and hold for very long. I need to explain this clearly. We have had ICL’s (meaningful trade-able lows) pretty much every 5-6months. I have pointed this out repeatedly. I have also said that these are trade able for the first 8 weeks or son, but then it gets tricky. In a Bear market Rally, which is what we have been getting, it averages 2 months higher, 3-4 months back down into the next ICL.
IS IT POSSIBLE that we are breaking free from the bear mkt rallies and we could get a run from the lows that eventually brings about the next bull mkt run in Gold/Silver/Miners? Yes. I even think that I see signs that we could be at that point, but we need further proof. At this point, however, we must conclude to be safe that we are just in another bear mkt rally. Compared to past ICL run ups…it may have topped (though I expect a double top- I’ll explain later in this report)
Here is your first warning to be careful.
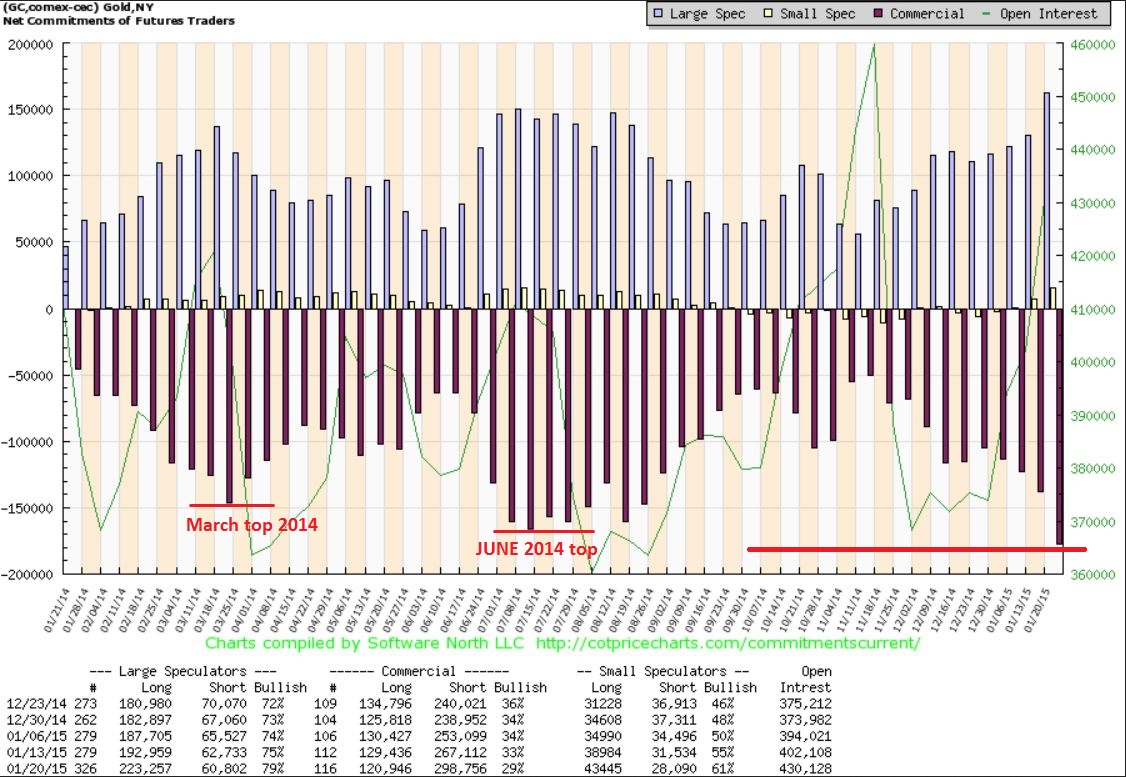
C.O.T. – The past 2 tops formed with Commercial shorts less than right now.
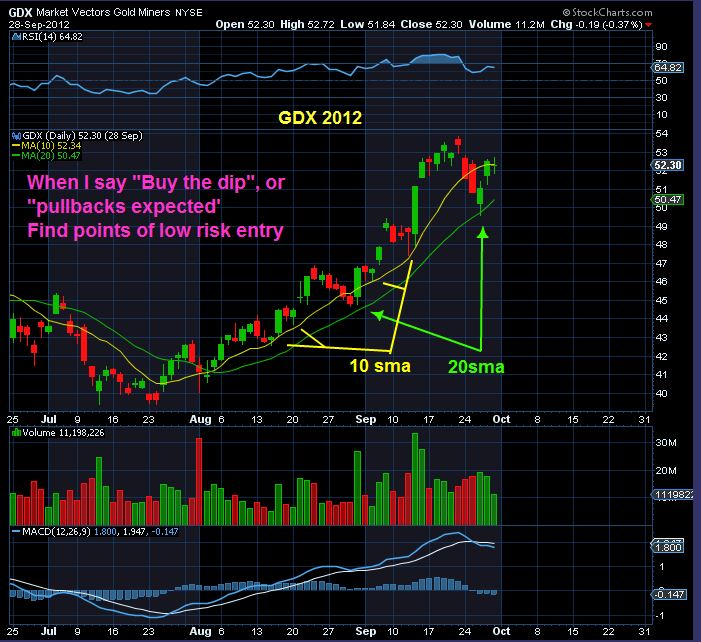
I have received comments and emails where people are saying that I said to buy at the 10sma and GDX is there. ACTUALLY I posted these 3 charts below.
This first one showed that GDX pulled back to the 10sma on a 1/2 cycle low, then to the 20sma on a dcycle low. I have said that we are due for a daily cycle low.
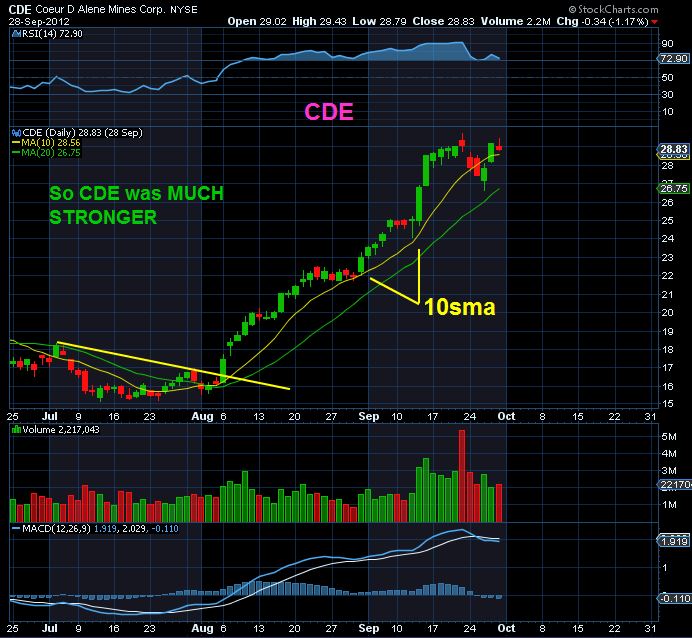
I also pointed out that SOME miners may do their own thing , so can be looked at as stronger or weaker than GDX, I pointed out this strong run in CDE during the same time period, only hitting the 10sma . I pointed out that GFI & HL were strong last week for example.
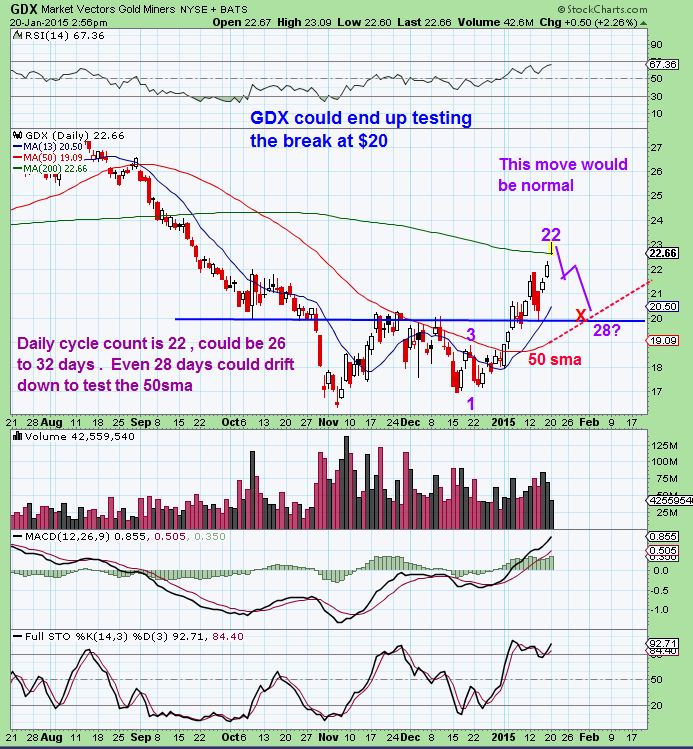
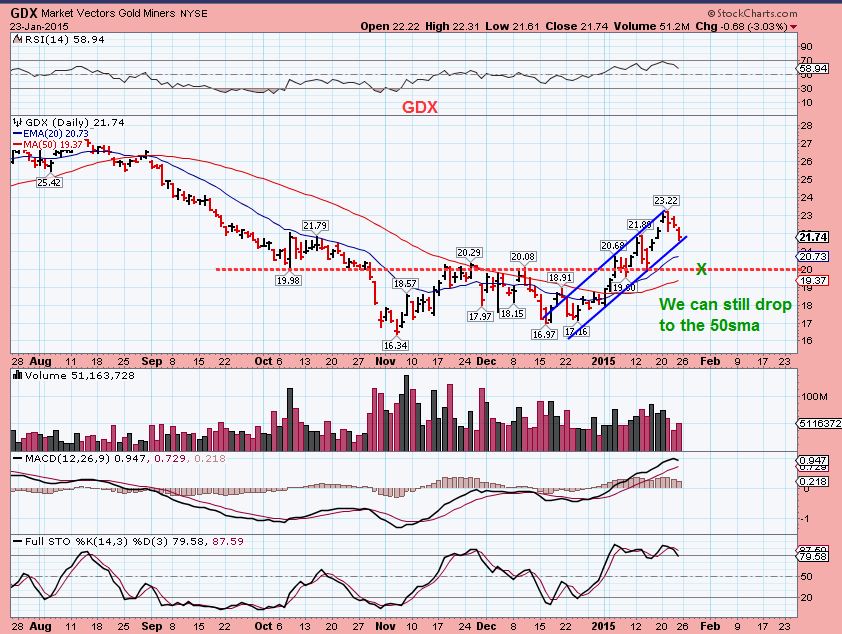
I DID POST THIS a few times though since JAN 20. It shows GDX at $20 & the 50sma. This COULD happen, so I didnt really say “Buy at the 10sma”. I look for a reversal
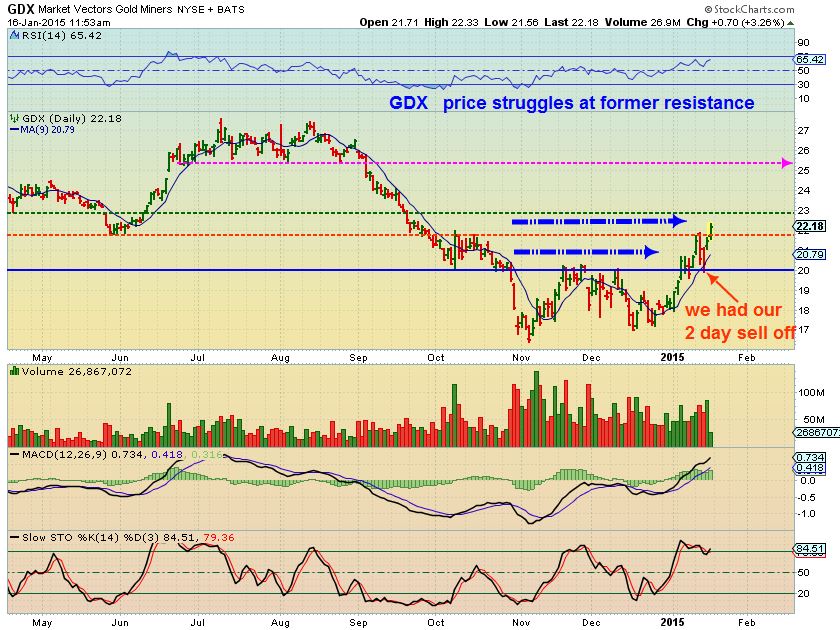
This Jan 15 chart shows GDX resistances. GDX ran to a litttle over $23 ( over the Green line) and has dropped. I can see it dropping to the Blue line.
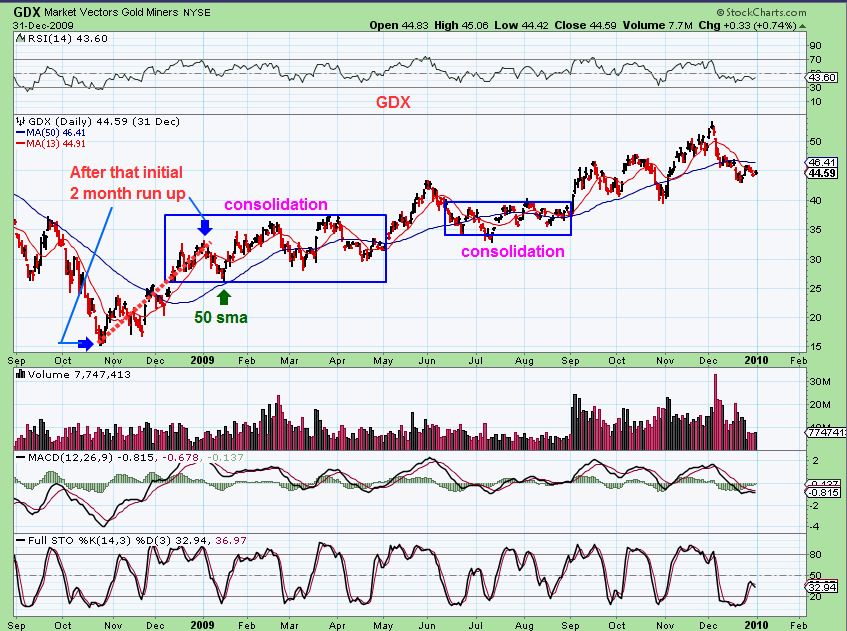
Remember that I also pointed out that Even If we are coming out of a bull market and entering a new run up in a Bull mkt, in 2008 it was Not straight up. We dropped to the 50sma and and consolidated too. It formed a trading range that was trade-able. I showed this chart . (However- some stronger Miners individually ran straight up)
Please note on this chart, This looks exactly like GDX in Nov. Here in 2008, Lows were OCT – bounced up & sold off like we did in December. Then another nice Run up into Jan , then DROP to the 50sma. THEN you could trade a quick pop to new highs, and then it just went sideways. NO LEVERAGE / CALLS may have decayed in this consolidation period. It was a trade
OK ALEX, you have now discouraged us . How about something positive. WHAT – IF – WE – ARE – IN – A – NEW – BULL – MKT?
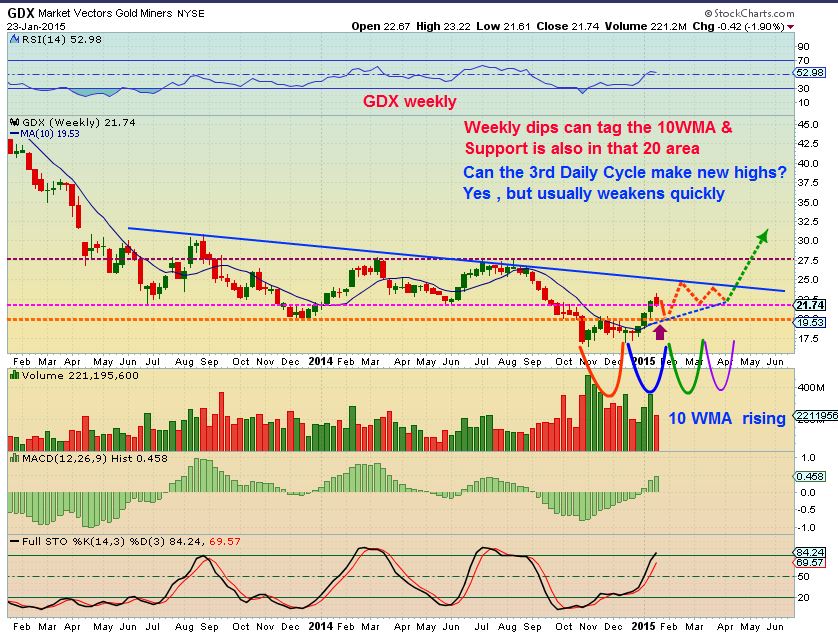
OK, the lows of 2000…ran up on a weekly and went sideways /up/sideways along the 10 Weekly Moving Avg. This was a beautifully bullish run up. SO Using Technical Analysis- you could buy the 10 WMA. Do you know where the 10 Weekly Moving Average is now ?
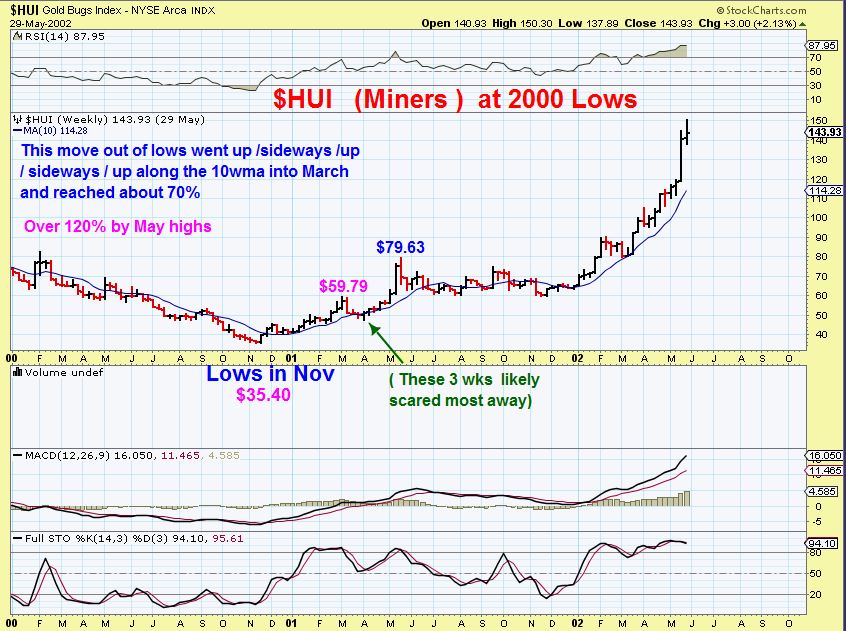
The 10 WMA for GDX is about at $20. So now we look at our Daily GDX. $20 is support and the 50sma is rising to it to. THAT looks like a possible safe entry for a short trade. WHY? Because we are looking for the 2nd daily cycle low. SINCE our 2nd daily cycle was right translated, we should get get a new high on GDX, but then it might roll over if the 3rd daily cycle proves to be weak. We may just DOUBLE TOP.
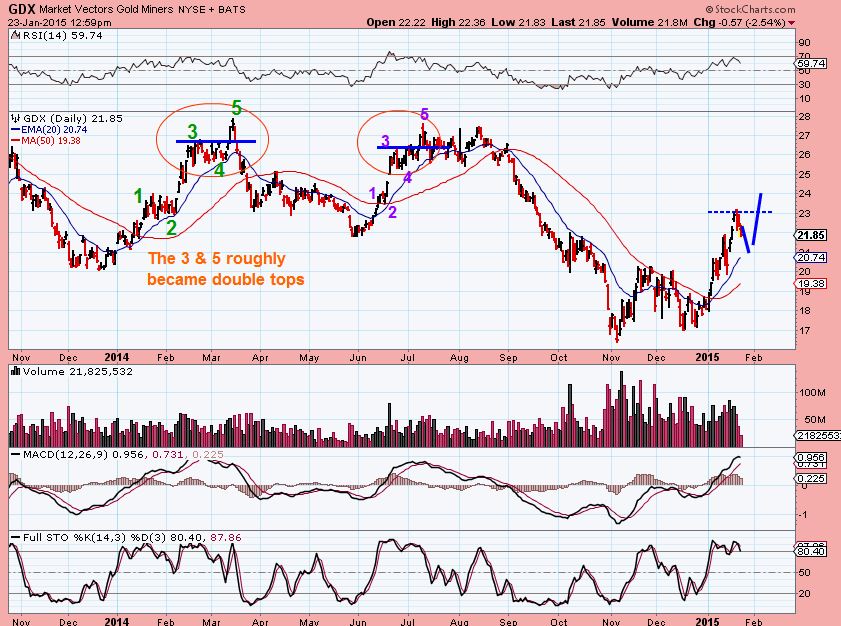
DOUBLE TOP? It has happened in the past, and it sucks people in “long” because they dont want to miss another leg up. Looks like this as #5 , then rolls over once everyone goes long on the break out.
But I said I was likely buying some individual Miners . That is because I do expect another quick run up. Once the lows are in on a daily cycle low, we could get higher prices for maybe 8 – 10 days ( Not straight up) , that could lead to the new highs, then IF THIS IS ANOTHER BEAR MKT RALLY- it would roll over likely by day 8 or 10 or so . “Buyer Stay Frosty.”
Here is one of my many ideas on a weekly chart of how this could play out if we get a 3rd daily cycle that rolls over, and then even a 4th daily cycle that pops and also drops….right down into our next ICL. Of course, this is just a rough estimate if the 3rd pops to new highs and rolls over. Each colored loop along the bottom represents a daily cycle. Look at DEC to MAY of last year. Its similar to that up & sideways move.
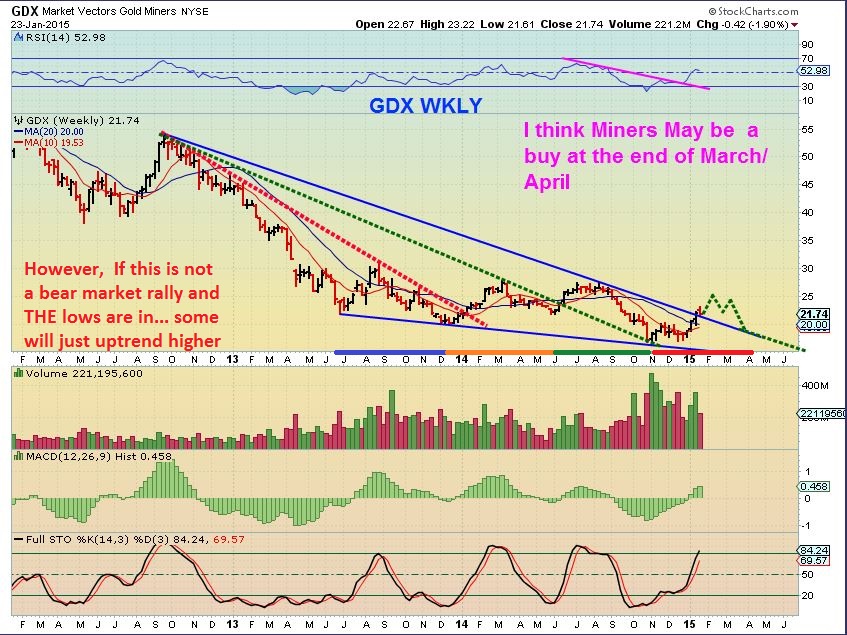
Here is what I am thinking is a S-A-F-E idea. Wait & Buy the next ICL – unless you are an experienced trader. It could get very tricky in between now and then trading this sector. It could possibly be mostly sideways and down. ICL’s come every 5-6 Months in Miners, This next one could be very profitable buying near the lows. We just had one in the first week of November. You could expect one in April/ May.
To scare the buy the dip crowd, you may see this. This would be a totally normal break out & back test in Technical Analysis.
It could happen as shown in a 3rd and 4th daily cycle. REALLY BULLLISH would be a long 3rd daily cycle tht leads into an ICL in March, but I just think ahead & try to watch for things that could possibly play out. I dont want to guess too much. I’ve seen way too many people drawing out charts 6 months ahead of time & declaring how “THIS AND THAT” will happen, only to be wrong again and again, and they miss the trade because they hold on to their own bias, fears, guesses. Lets see how things play out, willing to change whenever the market gives us signs.
I did say that I (As a shorter term trader) Want to try to buy this dip into a daily cycle low and catch that pop to new highs, because so far the set ups in individual miners remains bullish looking. You can see that I am expecting GDX to possibly tag $20 near the 50sma. Other Miners are so bullish looking that I do wonder if we are starting the next leg up. I will show you again a very bullish set up.
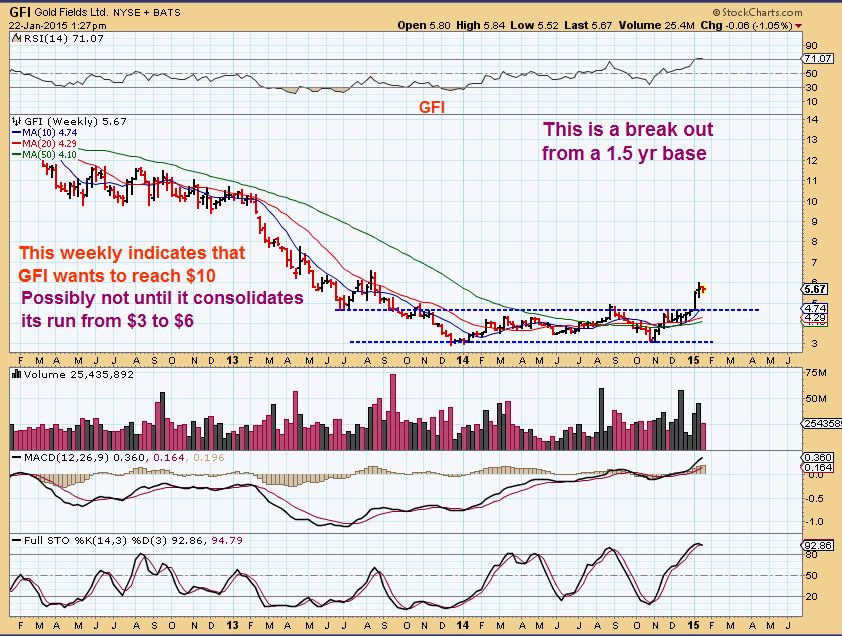
GFI – HUGE BASE break out
SO I will trade the set ups as I see them . I was looking to buy “AG”, I posted this chart saying where and why. I said I’d look to buy near the 20sma & trendline.
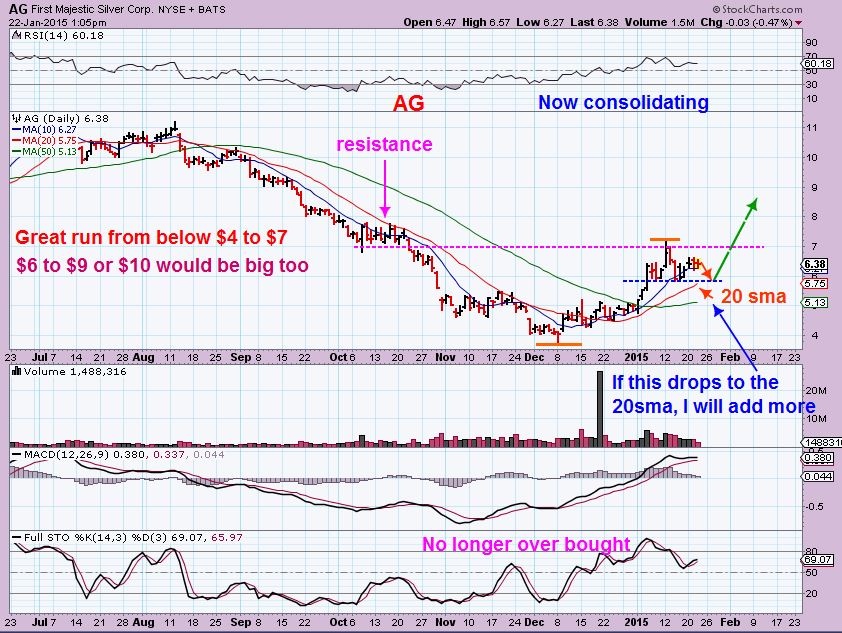
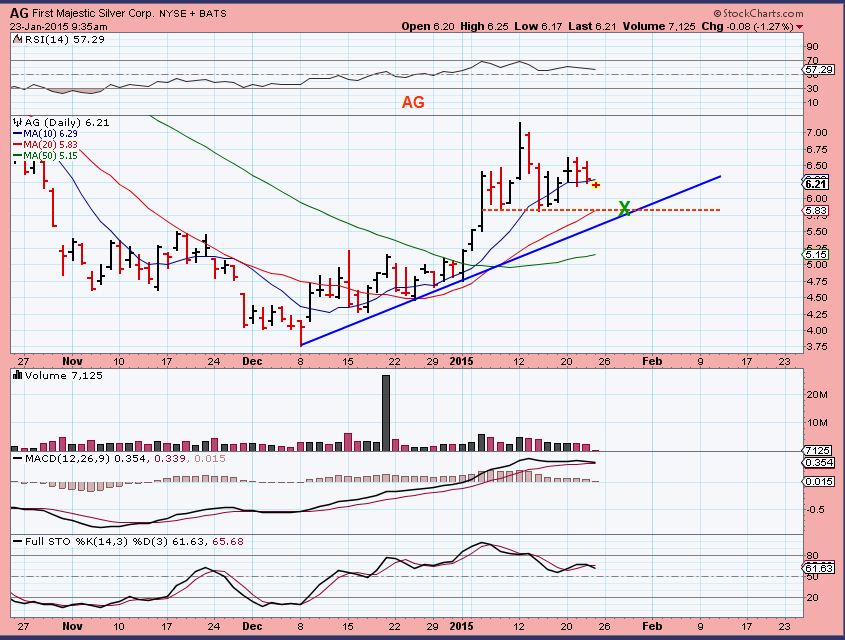
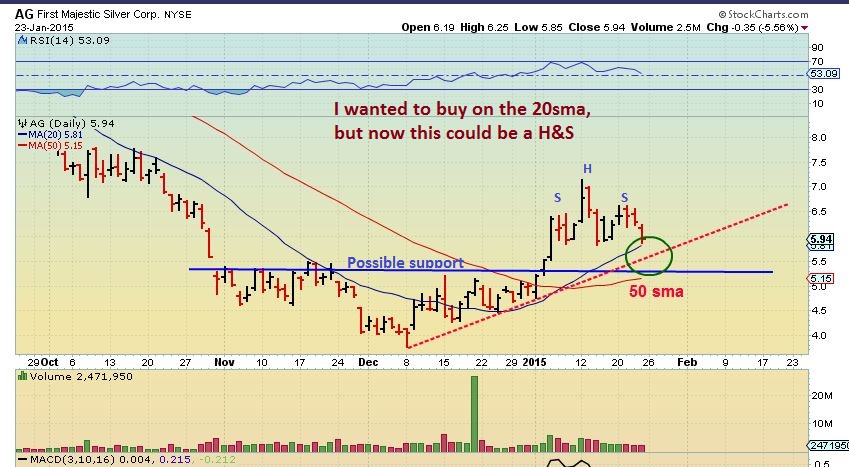
It dropped right where I thought I’d buy Friday. Now I want to watch it closer, I noticed this …drop to support on a H&S break? I would buy it there, because my stop is right below, but it may just turn up here, then neckline wasnt broken & the 20sma may be support.
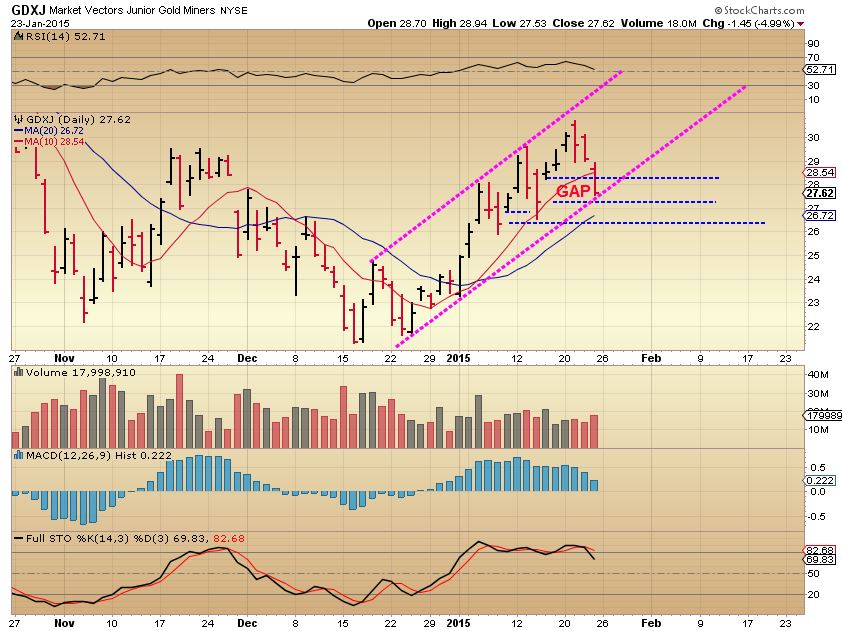
GDXJ actually closed a gap & landed on a trendline. Normally I would buy this, but I still think the daily cycle low is a couple days away, and the 20sma could get tagged. If it did and reversed …I might take that trade. We should break to new highs since the 2nd daily cycle was right translated.
So for those that trade regularly, yes I am looking to buy this dip. I’m looking for low risk entries. A reversal at the 20sma or at the 50sma , at a trend line, etc . Some of these Miners can pop %-Wise quite nicely for traders. The slippery slope is that each ICL for the past yrs has rolled over a failed around this time period… So you need to be cautious and recognize that if you bought recently and we do pop to new highs while you haven’t lightened up or taken profits last week when I recommended it ? I recommend take some profits on our next bounce out of the daily cycle low.
So thats the weekly wrap up. SPX , QQQ, DJIA turned higher on the DRAGHI juice, but they’ve also been in a consolidation. Traders can trade as they like, but the direction of the markets is still unclear . Its a consolidation. I will be looking for set ups going forward and see if I can find some low risk set ups to go long. It’ll be interesting to see how how they play out. Will they look strong or weak as the markets move forward. The week should tell us a lot.
I need to also bring something else to the attention of the readers.
I live in New England and they are calling for 2 or 3 feet of snow and blizzard conditions in my area for the next few days ( Monday night into Wednesday). Blizzard meaning winds could be 60 MPH during this strong snow storm and likely power outages as tree branches weigh down on the power lines and snap and take out power lines, etc . In the past I have lost power for a day or even 3 or 4 under these conditions! Seriously. Obviously, if I lose power you wont hear from me until it is either restored in a day or 2 , or until I can get to a place with power ( Starbucks, Barnes and Nobles, etc ) and then review charts and write up something from my laptop. Please understand that this is out of my control and thank you for understanding. I will be around Monday during the trading day, but the storm is expected to start late Monday afternoon.
My words of wisdom under those conditions are this : We dont always need to be in a trade just to trade. That is how money is often lost. Being patient and waiting for the trade to come to you, waiting for a lower risk entry is the course of wisdom. Trading just to trade …just to have money in the game can add to losses. Risky set ups are costly. There is always another trade coming, they just take time to set up properly. What if looks good, but doesn’t feel quite right?
WHEN IN DOUBT, JUST STAY OUT! Dont force a trade.
Also of course, Honor your stops if a trade goes against you-
This way you can keep your money to trade another day. Thanks for being here and enjoy the rest of your weekend!
~ALEX
This is a very long report ( 25 charts!) , so I want to post it early enough for you to be able to read it- Twice : )
Look At Those Socks! 
 I WANT TO SHARE SOME TRADE IDEAS
Scroll to top

Excellent report, Alex. Thanks for the “words of wisdom” Best of luck w/the storm.
Thx #9 ( Enjoy the Palm trees) : )
Alex, if you have a minute can you throw up a chart for SSRI? thx.
Could fall to $6 area
does a trend break and at least a 50% retracement occur for a DCL?
I’ve looked at GDX in past moves daily cycle lows and almost always have a trend break (individual stocks may or may not).
I have been in trading blogs where the trend line break often causes people to go short, and then that is really the Daily cycle low, and it reverses higher. They cover shorts and it drives it up a bit.
Be safe this week Alex. Thanks for another excellent report and great trading ideas. I enjoy trading and making money with you!!!
Thanks you Shermo!
I forgot to piut it in my report, but ENERGY stocks may start setting up too.
I liked KEG, HK, MHR,VLO and a few others for various reasons. For ex : MHR great volume reversal, but stopped at the 10sma. Good sign of life though in some areas.
By request.
ABX could fill that gap. There are moving averages stacked up there and ABX could fill the gap & find support , then pop back to the recent highs ( or more) after the Daily cycle low is in.
wow..quite the report – I like the way you think; thank you Chartfreak.. Certainly is a lot to digest…. hope Mother Nature is kind to you ;o)
THX Heidi
If 2- 3 feet of snow rather than 4 feet is considered kind, maybe : )
Thanks Alex a lot of good info to digest. Stay Safe
Ur welcome Sandy, thanks for the well wishes.
BTW Chartfreak… that CREE trade…… —> STILLLLL working ;o) enough to pay for this year’s subscription, and the next year, and the next year annnnd the next ….
;o)
Excellent…Nice trade Heidi …..here is what I’d do if its just a trade ( if you dont want buy & hold) .
CREE has an overhead GAP, that might fill, but I would take partial profit in this area if your position is large ( or all if you want )..it COULD break out , but I think it MIGHT pause here, although It does have good volume lately . There may be trapped “longs” up in this area. Some got stuck in the gap down, some are longs from the last run up.
It is at a prior pivot point . Click this chart . It MIGHT just run to $40 & fill the gap, that’s why if my position was large I would only sell partial until $40.
FENG has dropped nicely today. Would it be buy at this price (under 8), with stop at 7,45?
NO, Sorry I didnt see this sooner, and I hope you havent
I do NOT like the volume selling. It needs time to show its intent. Remember the day EGO did this and I mentioned that it could just sell further? See EGO now.
Alex, sitting on ONNN and not moving. Noticed earnings call on Feb 5…hate to hang around and overstay my welcome. Thoughts on the chart? Looking like (?) ascending triangle…tough getting over $10 and change. Thanks!!
Hi Deshy
I would keep the earnings report in mind ( maybe sell before then) . today it still looks good, but its in a consolidation . It is trying to push above both the 10 & 20sma and may then wait for earnings?
Let me know if you got this ok? I released another report and you may have moved on to that page. Thx
Hi Alex,
I like a defensible trade on IAG here with a stop below the 50 sma.
Watching MVG closely also.
Comments or Concerns ? 🙂
Hi Ken,
Both are right above their 50sma, I think IAG dipped down and almost tagged it and turned higher. I like the idea of adding there if you will put a stop below and honor it in the case that they drop further & something doesnt look right.
Right now, things look fairly good ( But I have seen a 3 day slam into a DCL in the past).
I bought what if you bought this morning
(:-) Thanks for your thorough and forthright presentations