Did you see the $USD? Did you see the QQQ’s? Did you see $Gold? Looks like “Happy days are here again” ? Well the markets certainly did react strongly after the ECB announcement, but will it last? Can it last? It really raised more questions than it answered, so lets look at some charts.
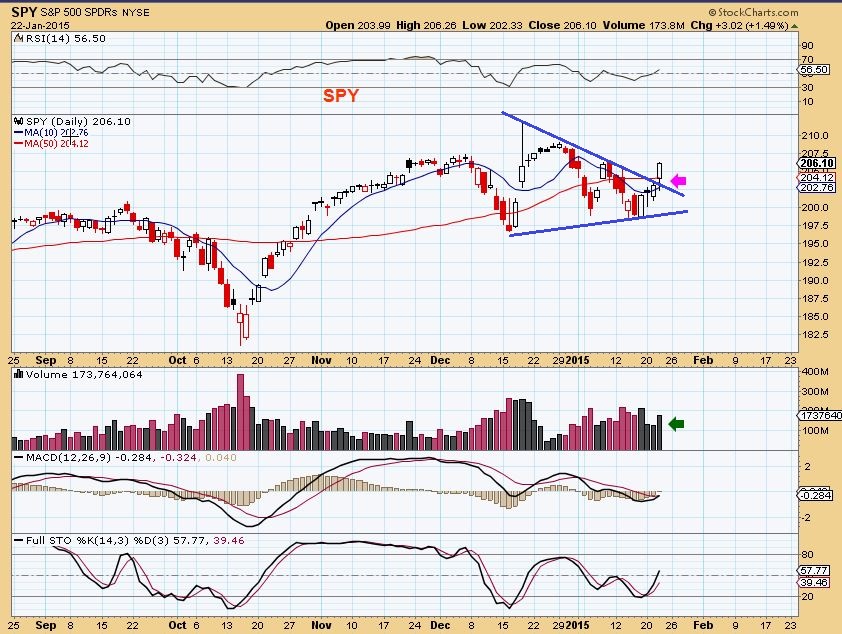
SPY – Which was struggling below the 50 sma got a bit of a boost yesterday
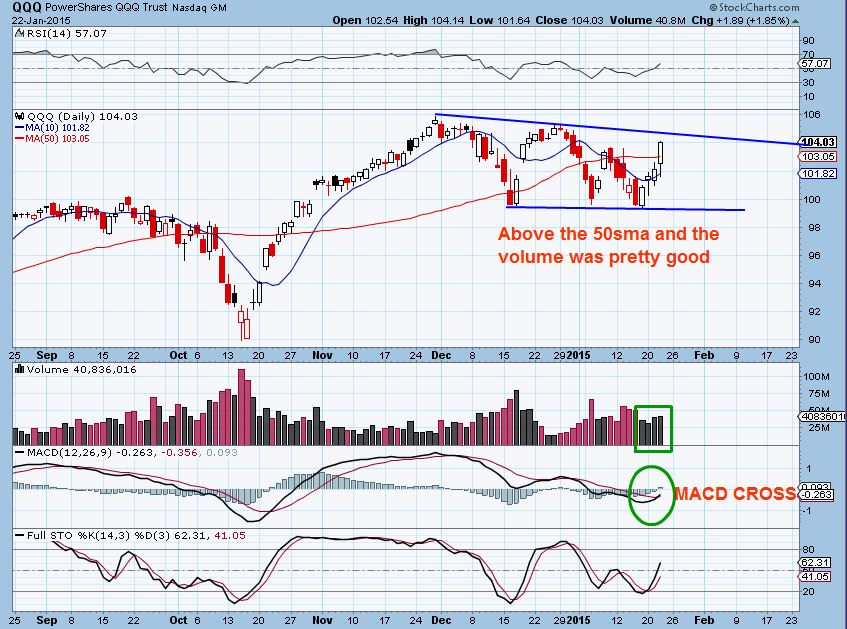
In some ways , the 3 Q’s looked even a bit better…
AUDIO – Right click & open in new tab, click ‘download’ , then just click open or play & return here to follow along.
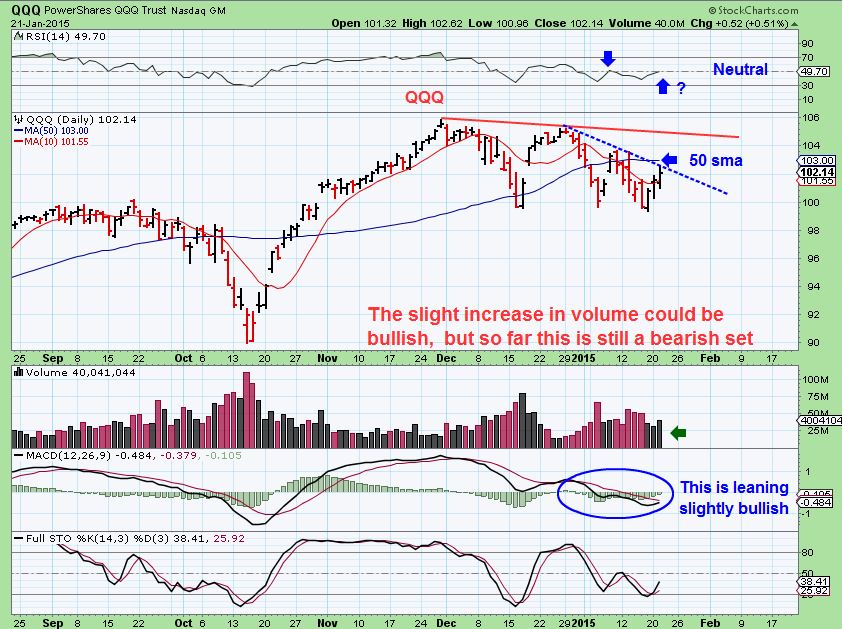
QQQ – I was looking at this in yesterdays report . Blue line and 50s,ma, and I noted a more bullish improvement.
QQQ – MACD crossed higher yesterday
So the markets responded in a positive way, and I do see quite a few bullish looking charts . I was thinking that we might have a short opportunity coming up, so I was watching QQQ vs TZA and I also eatched SOX vs SOXS (And of course a ton of other areas like the VIX, put/call ratio, NAMO, NASI, etc ).
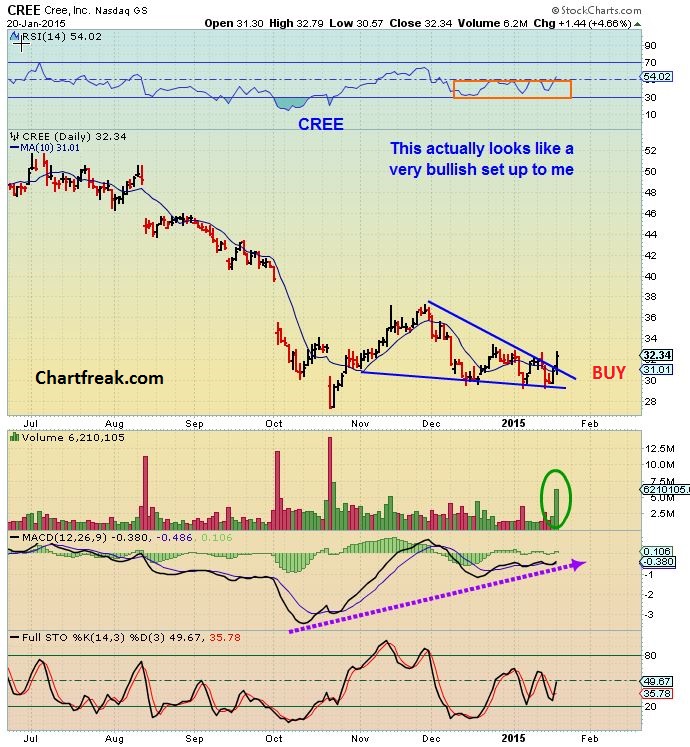
While looking at the SOX & SOXS , I look inside at semi-conductor stocks and saw CREE shaping up. I also saw a consolidation in ONNN and CY as a few more semi’s that looked more bullish then bearish. SO lets take a look at CREE then and now.
CREE – I posted that it looked bullish
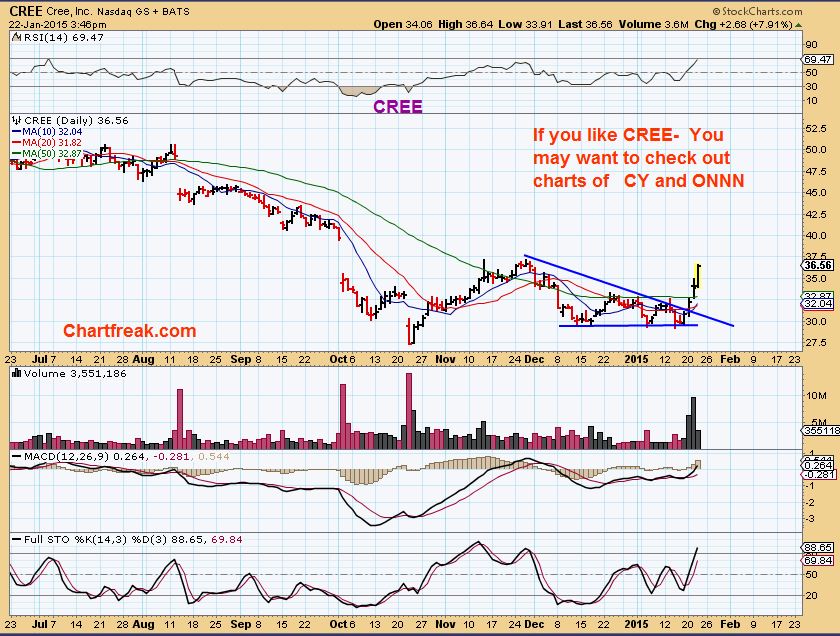
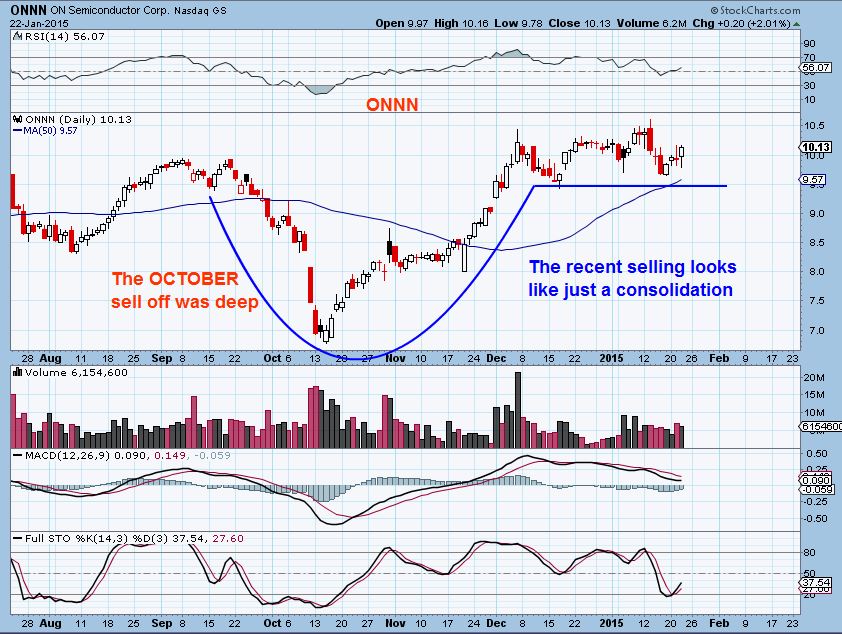
That was a break out. This is what I see in ONNN, so the semi’s could be shaping back up.
ONNN
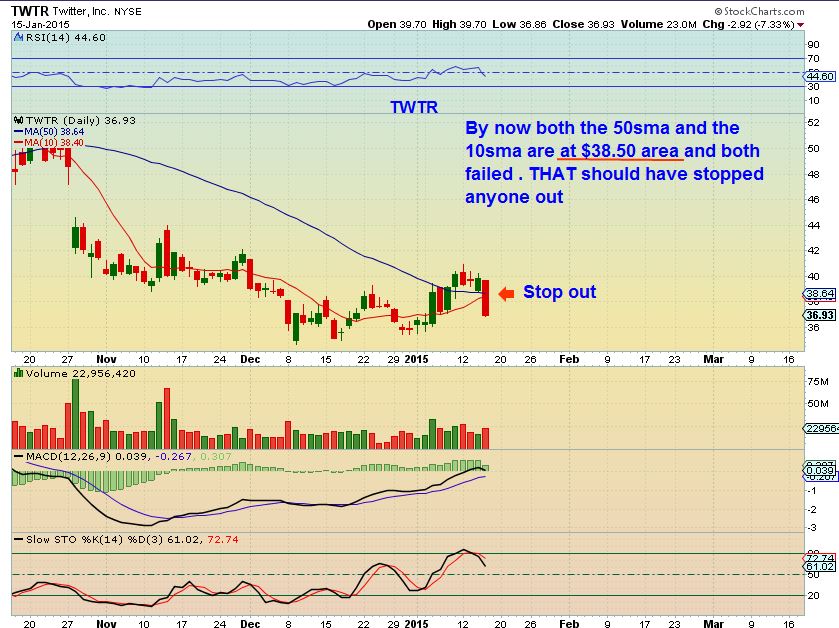
I mentioned a while back that TWTR looked bullish, then it went ugly.
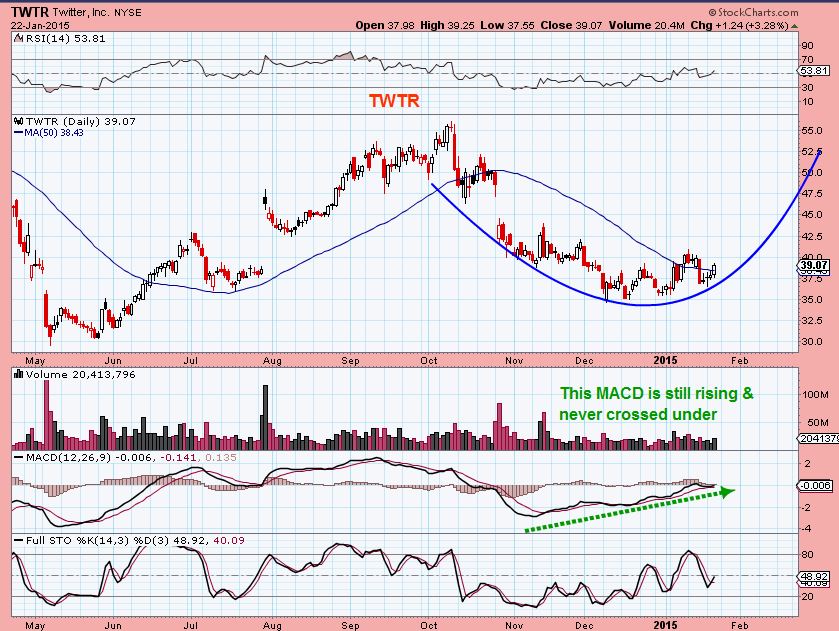
Now even TWTR is regaining its composure.
SO I’m not saying that we flip long, but what I am saying is that many stocks took the Draghi Juice and look a little healthier. AFTER TODAY, I will have the weekend to take a broader look at things because a 1day wonder can fail just as fast as it was deemed wonderful. If you have time, however, take a look at a few stocks that I thought had an interesting look after yesterday (This is a small list, I have many). See EBAY, AVP, ( Media stocks….NXST, SBGI, MEG, etc)
Some energy stocks looked interesting . look on a 3 month chart to see a close up of PLUG, HK, KEG, CPE and more.
Gold & Miners
And of course GOLD & MINERS. Not much changed there. I had recommended lightening up / cut leverage and also some options may decay if we get a sideways move or pullback. I want to mention that I am watching various miners and holding a core. I might even ADD on dips to areas that seem like support , because I can always stop out if the selling gets too heavy into a DCL.
I will say that I like the set ups on many of these miners, though GDX is due for a daily cycle low . It may be shallow based on 2 things.
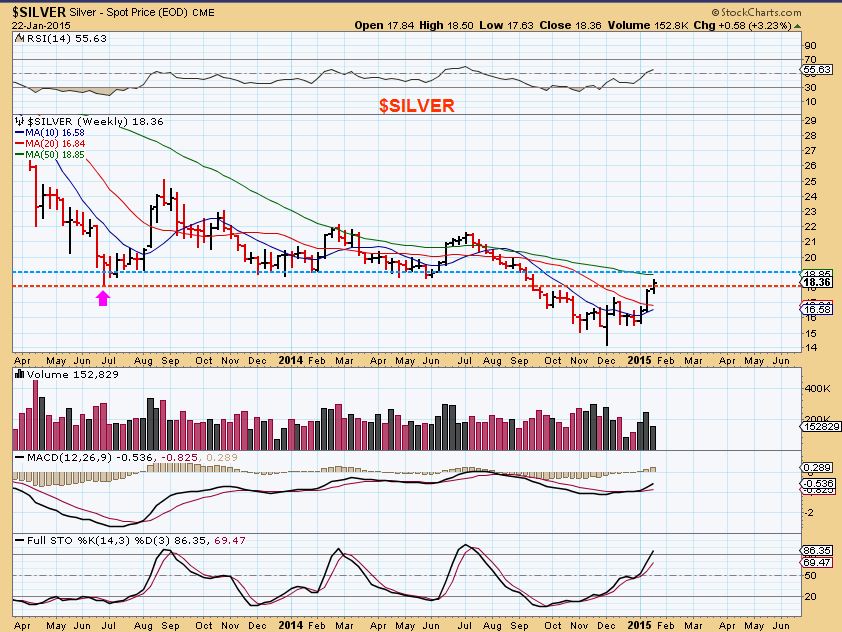
1. My GOLD / SILVER upside targets havent been met and still may
2. Gold is not as late in its daily cycle and therefore could still push higher in it’s timing.
CYCLES ASIDE- I like the technical analysis view of many of the Miners. They look bullish and they can do what they want. Lets take a look at what I mean.
SILVER broke into important resistance yesterday , recovering JUNE 20013 lows.
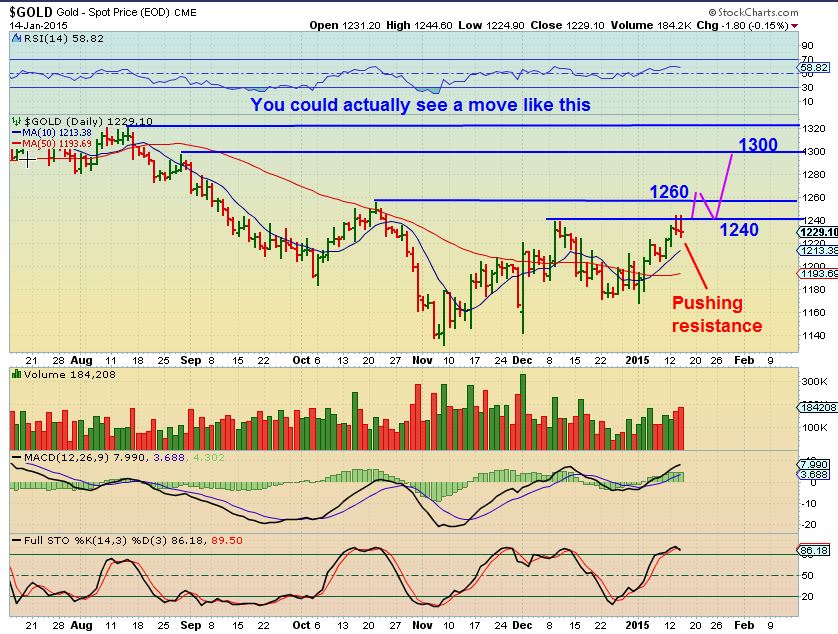
ON JAN 14– I mentioned that GOLD could pause at $1260 before attacking $1300. I’m HAPPY to say that I was wrong : ) We now know that it just Burst up to $1300 and now has paused . That was strongly bullish with the dollar continuing to make new highs!
Lets look at what I mean by some Miners look bullish.
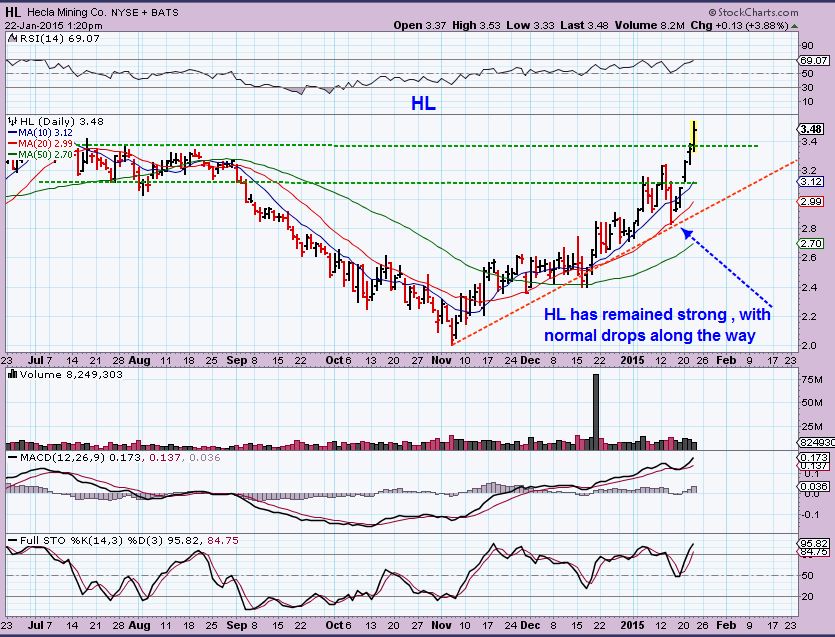
This was HL yesterday. Someone forgot to tell it to slow down, huh? Notice that it paused 7 days , building energy at resistance before blasting higher. Many others may be “pausing’ now.
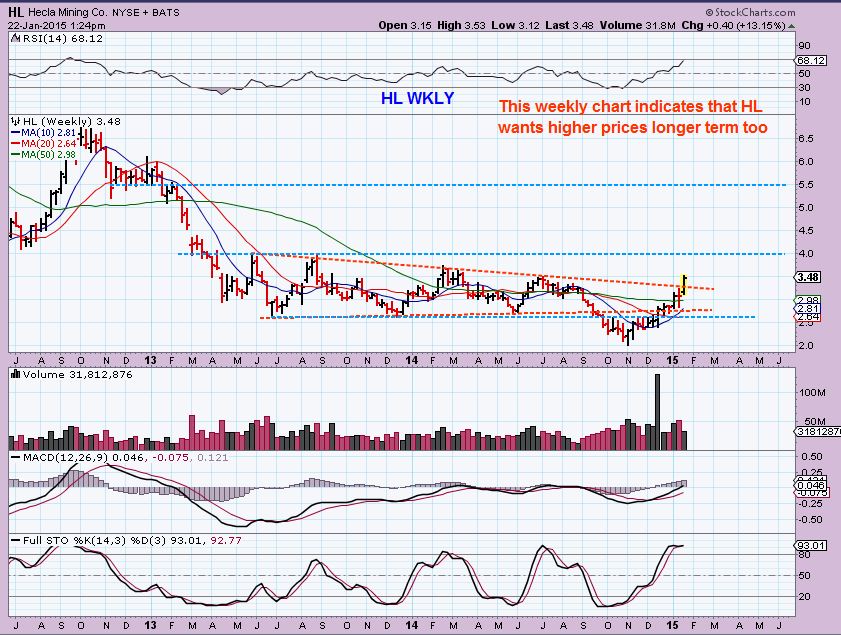
HL WEEKLY- it should have stopped at $3 on the chart above. The weekly wants $4. Also – a break of $4 & small resistance to $5.50!
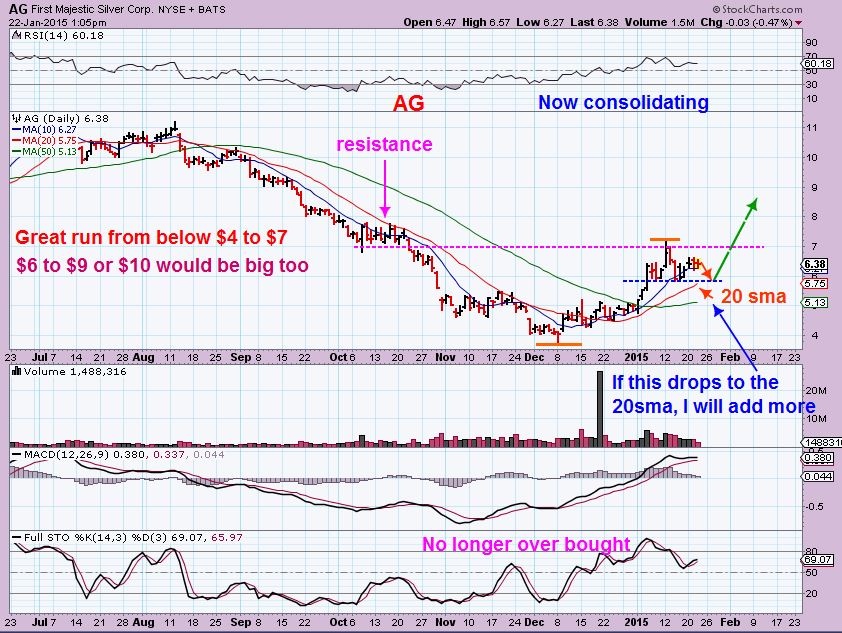
I ‘m Watching silver stock AG. It too has paused at resistance (like HL) after a great run from $4 to $7. I owned it, sold it just under $7, and re-bought it at $6.
I will add if it drops to $5.75 – $6 area again in case it, like HL, does another leg higher. Using TECH ANALYSIS…this looks like it wants to go to $10 . $6 to $10 is very nice, but it COULD drop to $5 at the 50sma too, so its a tad risky knowing that Miners DCL is due. The 20sma is at $5.75.
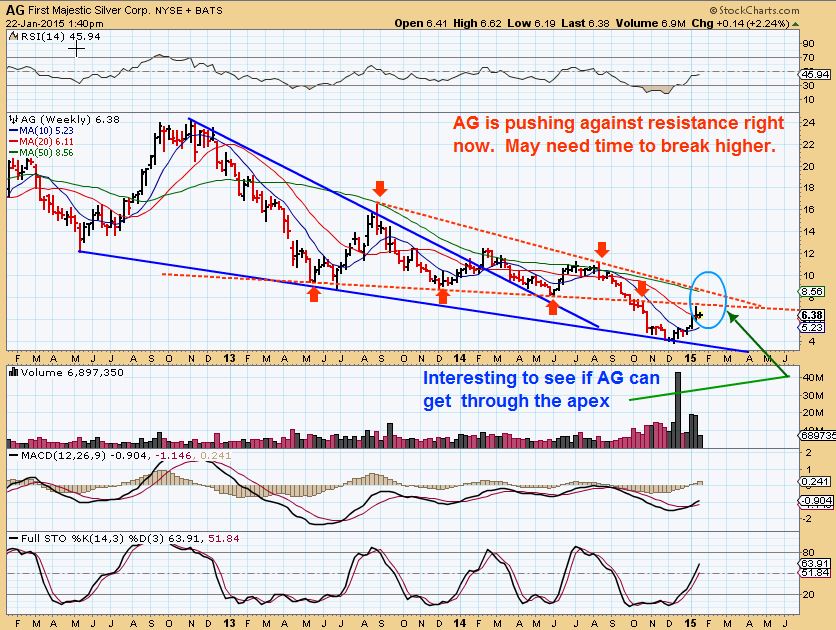
AG weekly – You can see why it stopped its run.
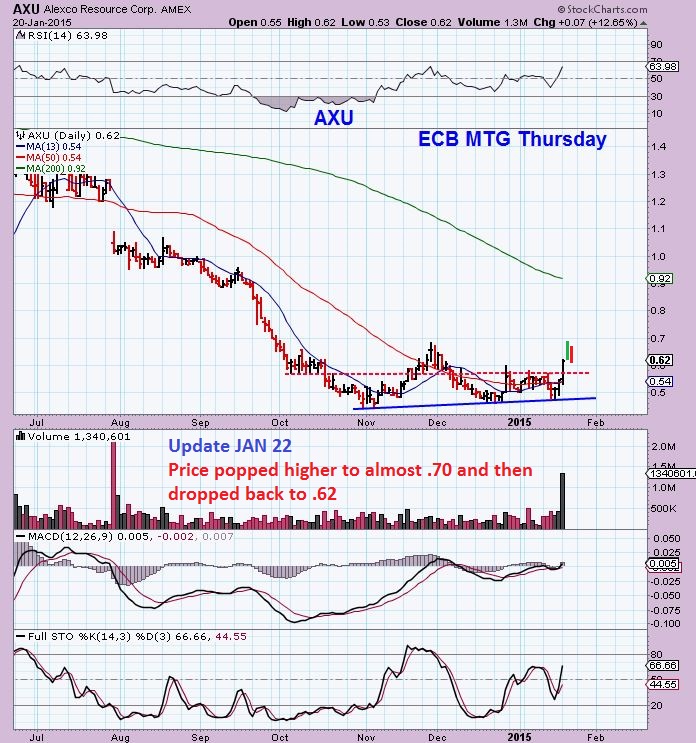
I pointed out that “Lagger” AXU broke out. This is what it looked like yesterday . Its cheap, under $1 and some do not like to buy those, others may be fine with it as a trader . Your stop is placed at the red break out line, you dont want it to fall back inside (that’s a false break out or weak break out). You also may wait , watch it, and BUY there if it drops there.
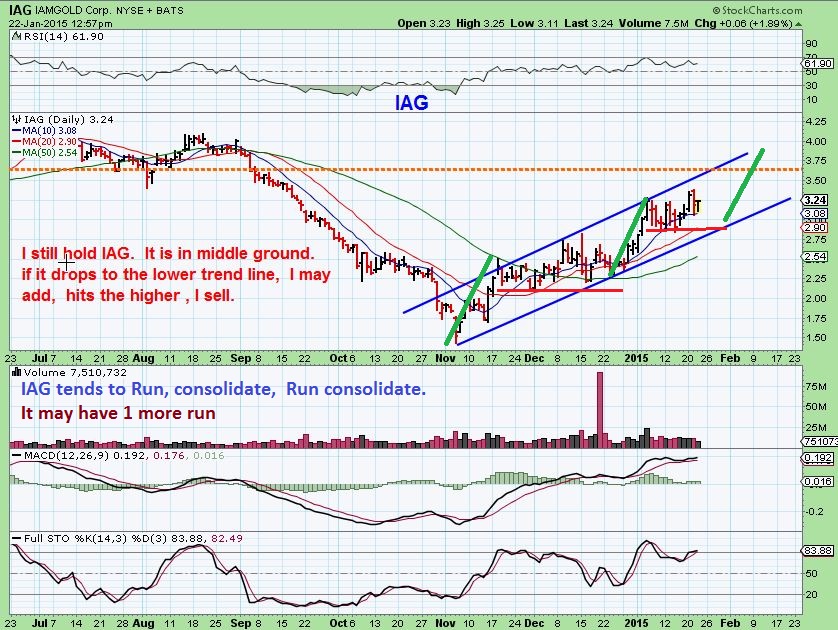
Another stock that has “Paused ” and gone sideways, possibly consolidating to break higher later is IAG
JAN 9 – I pointed out that this dip may be all we get.
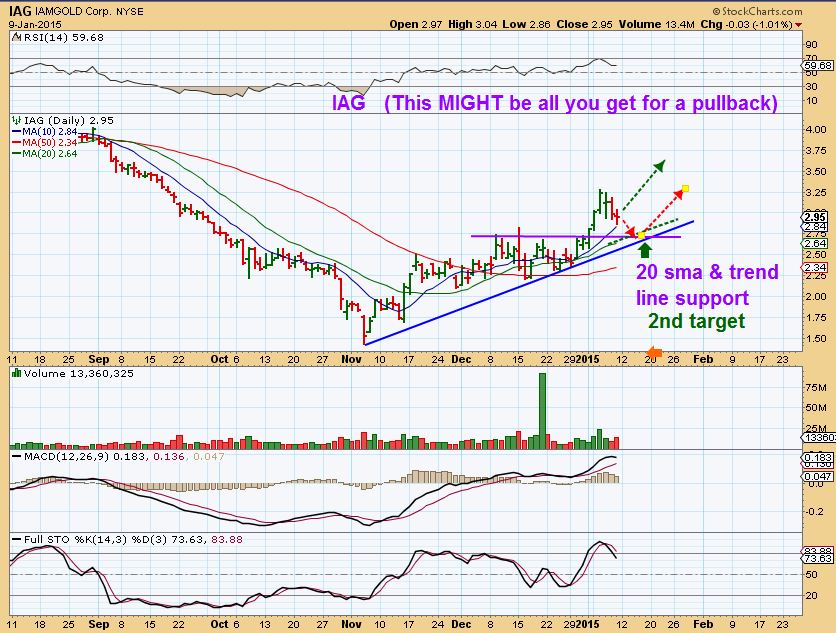
IAG now. It has gone sideways after running up over $100% from Nov lows. Often they need to consolidate those gains , and by now no one remembers that it ran up 100%. Most are bored with it. I bought that dip at $3 and may add again if it drops again. It looks like it could run to $4ish.
HAVE YOU SEEN GFI & HMY ? African Miners that are very bullish.
Look at GFI WEEKLY – That is $3 to $6 and very bullish looking break out of a 1.7 yr base. IN Tech Analysis, it wants $10 if it gets through this resistance area.
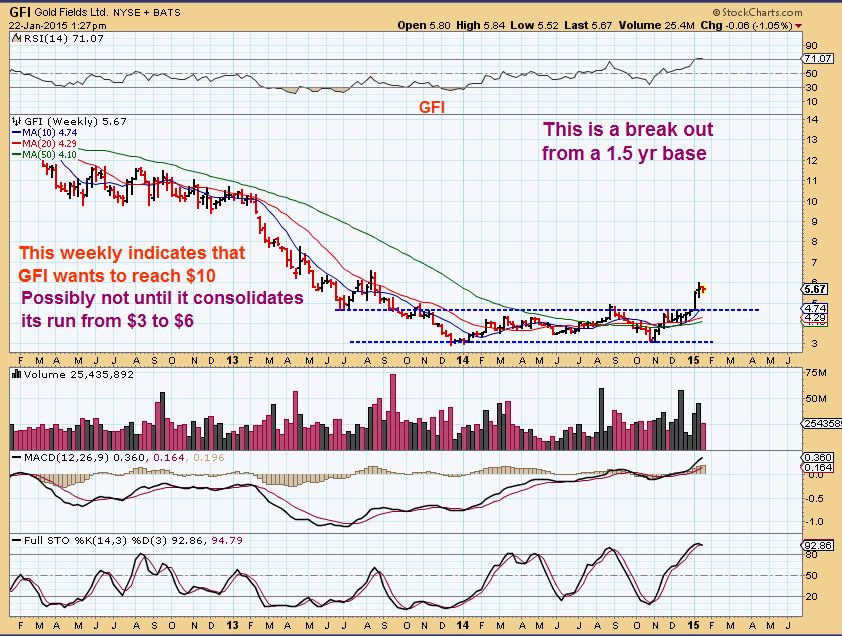
When I see a chart like GFI above, I have to wonder if the lows for Miners is in. Remember what I said about Miners bottoming 1 year before Silver in 2000? I will re-discuss this in the weekend report. I know that for many this could be just another “Bear Market Rally” like June 2013 and Dec 2013, and that may be true. SOME THINGS look different this time, however, and I am watching those things.
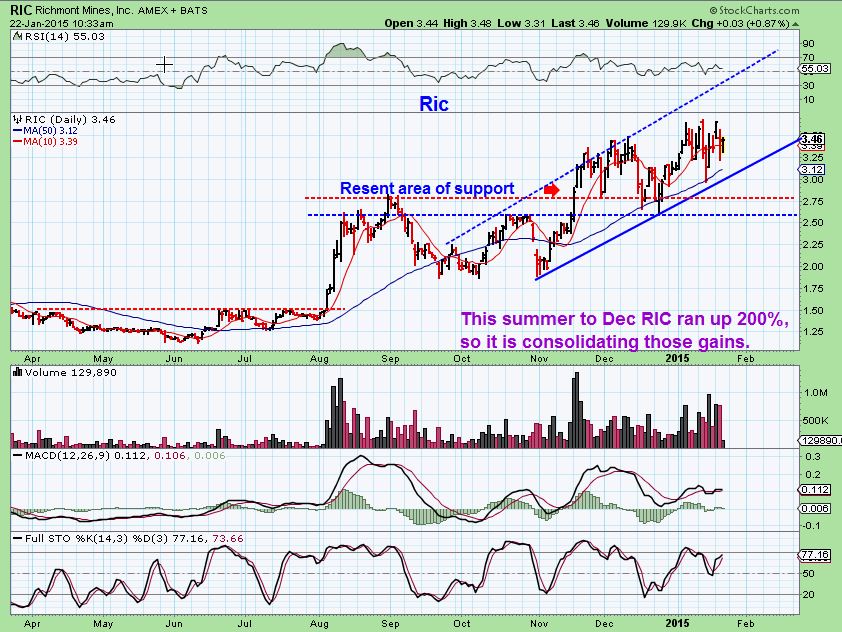
Alan asked about RIC. It looks great, up 200% from the summer. It is consolidating too.
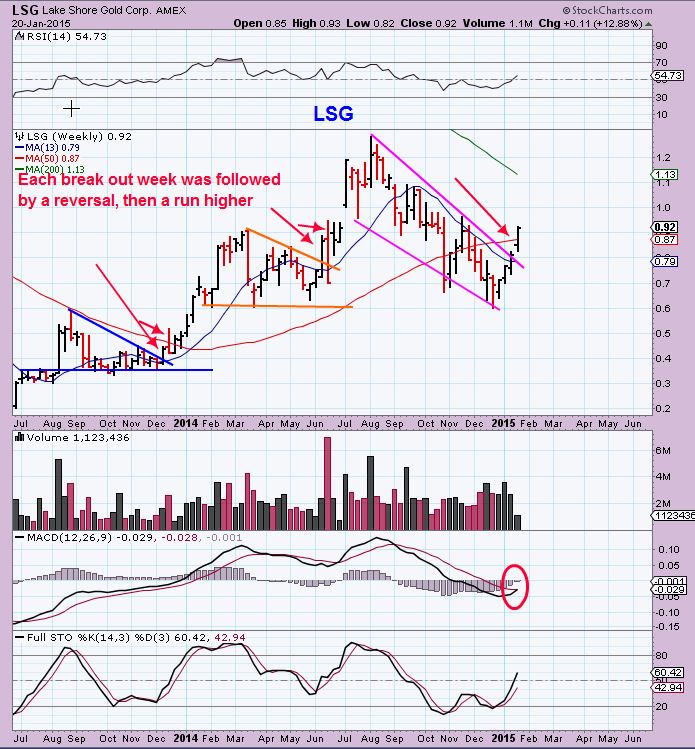
I also pointed out LSG on Jan 20 as a “Lagging Miner” that just started moving higher. The weekly looks great too. It was 60 cents in december, it hit 94 cents yesterday
So here is where I stand with Miners currently .
I mentioned that due to ‘timing’ of the cycles, GDX was due for a daily cycle low. I said we should lighten up / cut leverage, etc . I mentioned that this could me a good time to hold on to a core , however, if you bought it lower. Now prices have consolidated or dropped a little lower tin some Miners, so I have a core and may add to my core if certain miners (I mentioned a couple like AG or IAG ) reach my downside targets on nice easy selling. THAT is what you can look for if you feel too light and think GOLD/SILVER may have another leg higher. I caution : Dont be too anxious and just jump back in to be in, rather, , let price come to you. Ask yourself: Did it break below the 10sma recently? If so , is there a 20sma below that you can use as a target? WAIT FOR IT. Using technical analysis ….many of these Miners actually look like really nice set ups . They can pullback a bit more too, but the set up is good. ( Of course, that can change if GOLD drops $30. They can fall apart, but I just dont see that as a high risk right now , when the DOLLAR blows out upside and Gold also goes up $10). We have witnessed a character change in that area for weeks now.
I will look the markets over this weekend and see how things look. A fellow reader here Harry Wagner mentioned in the comments section the 1.5 Billion S.O.S. number. I dont use those as a timing tool, but they do often indicate a pullback could come. On recent runs up, I have seen huge S.O.S , and then a drop and huge B.O.W. and on and on. That is somewhat scary because it can indicate a topping process. 2008 had the same action, so we should be aware of that. In the weekend report I will try to cover various areas. Thanks for being here and have a great weekend !!
~Alex
In My Opinion, Its Back To Learning Patience 
 Look At Those Socks!
Scroll to top

Thanks Alex for ONNN. I see the “larger” possible cup and handle I was missing?
Ur welcome Deshy,
I’m still not sure (mixed feelings) on the longer term direction of the markets, thats why I want to look into it this weekend. Some nice set ups seem to be forming in some stocks? Some improvements seemed to be forming even before the ECB (But that ECB move may have been baked in a bit), so I think it still needs a little more time so its not a 1 day ( Draghi juice) wonder .
About 6 months ago I started seeing unrealistically large numbers popping up in the money flow data, and with a lot more frequency than before. I question whether the money flow data is even useful any longer. Something has changed, either the way the data is reported or possibly false data is being generated somehow. Either way it doesn’t seem to have much predictive value anymore.
Right, I noticed the same thing a while back.
However, before dismissing it as ‘false data’ – Have you gone back and compared it to the 2007 -2008 top? Thats what you want to do..to see if it really is “out of whack” or has this happened before? If so, then you must ask, ” is it possibly predicting something? ”
My data shows that this HAS happened before, and markets topped and then crashed within a yr.
Alex: Good. Now we have the decline happening in gold sooner rather than later as you suggested. This should encourage the bears all the more. You said something very interesting above. The buying on weakness data etc- suggested in the past a topping process followed by a “crash(ed)within a yr” in the conventional markets. Could you elaborate this weekend if time permits? Secondly, I wonder whether you could speak to the possibility of the DOW making all time highs and forming a blow off top over the next year but gold also moving higher as it did between 2002-2007? I never understood why both gold AND the DOW moved higher together back then.
Hi Mark
This pullback in Gold/Miners should be interesting. Its pretty much right on time.
I have actually expected that 2015 would be bullish and I’ll try to remember to cover that in the weekend report. I can mention the S.O.S. and B.O.W., but I dont know if it correlates with a Major top or was co-incidence. It is noteworthy, so I’ve taken note – but as I said, I have a reason to believe that 2015 was going to be bullish.
We bounced off the 10sma on GDX price action today….
interesting as your comparsioncharts over past week indicates a side ways action or maybe a bounce now back up to new highs….
Looking forward to this weekend’s report.
Have a nice weekend.
Hi Jay
Actually GDX bounced off of the 10sma and the 20sma at times, I’ll show it in the wkend report.
I just realized recently that some of you are signed up for the “Public report” email alert, some arent. Just because you are signed up for the premium service alert, you may not get the Public post alerts. Its something that you have to sign up for – the free posts alert . Some did not want both.
So I thought I would just let you all know that I posted a free post under the “Blog” tab today .
It can be found here
http://www.chartfreak.com/blog-2/
Hey Alex: noticed a lot of gaps on GLD that would essentially correspond to 1240 gold. Think they fill on this correction next week?
Hi Mark,
Dropping down to $1240 wouldnt be the end of the world (Its a 50% re-trace of the move from the January lows to the top), and the break out of the 200sma at $1255 could get tested, but I dont think it’ll drop there due to gaps needing to be filled in GLD.
GLD represents GOLD that trades 24 hrs a day , so it will have gaps in the same way the UUP will gap higher if the Dollar moves higher over night.
Take a look at the run up on UUP , and you’ll see open gaps. Its basically just a part of trading an overnight currency. I’m not saying that it cant go there, but I personally think the gaps on GLD are less relevant.
i always appreciate the lessons.
Alex- not sure why but looks like my last post deleted? I was asking about miners dropping to the 10 day and what your thoughts are about it holding and reversing back higher. I bought a little of what I had sold back.
I didnt see that comment. I believe that different Miners (individual ones) will do their own thing and the 10 may hold for some, others may drop to the 20sma or 20 ema. In 2014 GDXJ used to drop to the 20EMA, and many miners that I followed did too in the June 2013 run up. Sometimes they just went up & down sideways over to the 20EMA.
Check your miners (or GDXJ) using ONLY a 20 EMA and you may see the same thing ( And yes, we are close to that now on many)
Looks like Jay and RM beat me to my question/comment. GDX came right down and sat on the 10-day avg today. Last time it got support there, we saw a $3/share burst! Alex, is the 10 day here a good buy opportunity or would you look to 20 day? There is some pretty good air btw 10 day and then 20/50 day SMA. Might be ok on GDX but with leverage that would be a tough drop. I meant to post this during trading hours but work just didn’t allow that today. So I guess we’ll have the advantage of Monday morning GLD data. If up maybe that shows the bounce, if down maybe look for the 20 day. Does that sound close? Thanks.
Alex, here’s another reason to hold on to potential bull thesis. Social media traders giving up on miners. “The top is in!”. That’s right, gold went up $170 but then corrected $20 so bear market continues unabated!! (clearly controlling emotion is key!). As you have stated, we are now programmed to get a pretty good face-kick after a sizable rally so…
See RM’s answer below, wkend report will cover the “cautionary” notes
Ok, thanks. Have a good weekend.
So no Buys currently. ONNN maybe a buy? Just looking for pullbacks to add or start a position?
Hi Bill
I am a little cautious on Buying right now , only because I am not 100% sure of the market direction. Some could buy ( onnn for ex does look good ) but would need to set a stop or watch their positions in case the markets drop again.
the weekly ONNN is on the 10WMA & that is a good sign. A stop below that could be good.
I am working on a wkend report to discuss a little further.