
Time Is Just About Up
Using cycles for ‘timing’ various sectors of the markets helps us to anticipate when we can expect a possible turn to take place. True, you get a little leeway of maybe plus or minus a few days, but sooner or later, we reach the end of that time period. It seems that we are rapidly approaching the point where it is Do Or Die time. Each day that passes this late in Cycle timing brings us closer to the point where we begin to see clearly how things are going to unfold. As usual, I have about 20+ charts , and at this point I’d like to start with-
GOLD – With the $USD at new highs, GOLD hasn’t been hammered down to new lows as one may expect.
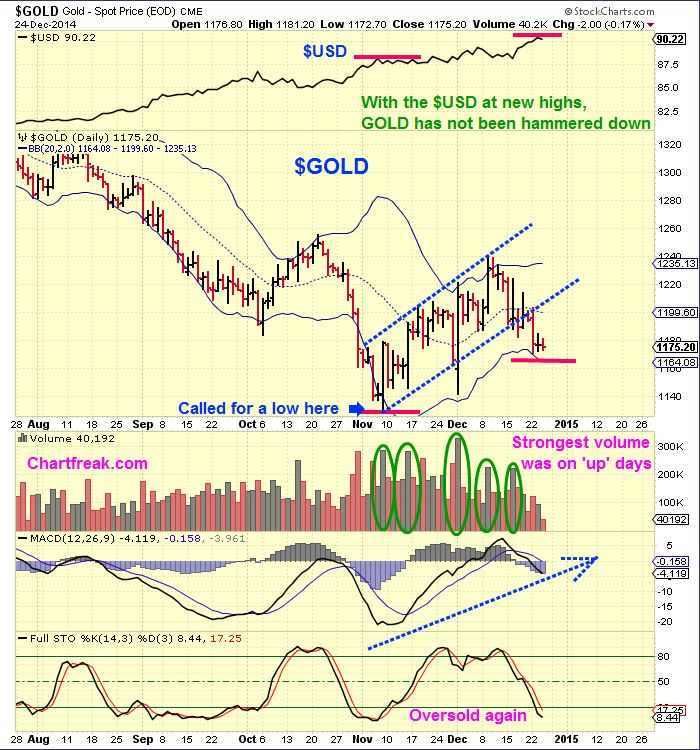
I posted the above chart in my public report, but it still leaves questions. Was that a bear flag that would just break down?…
AUDIO http://www.screencast.com/t/QnUl1g0xOH
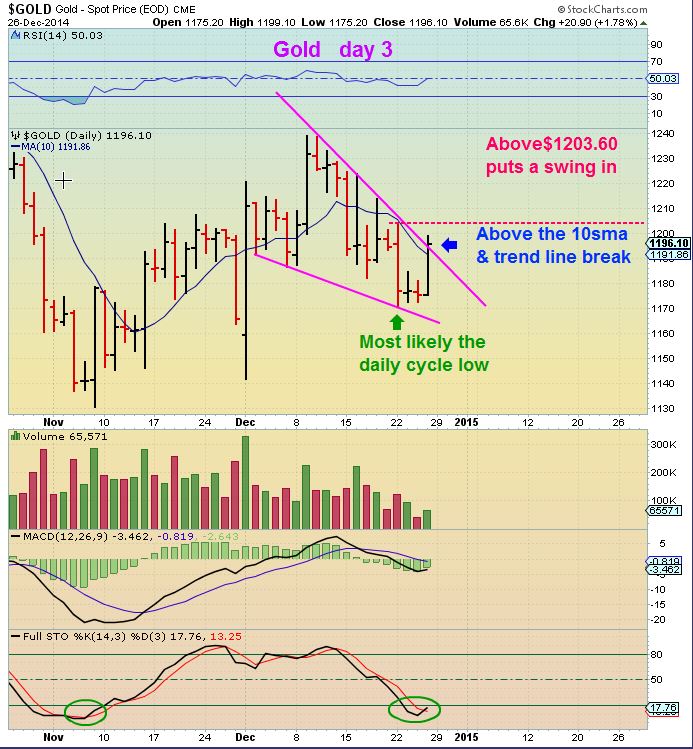
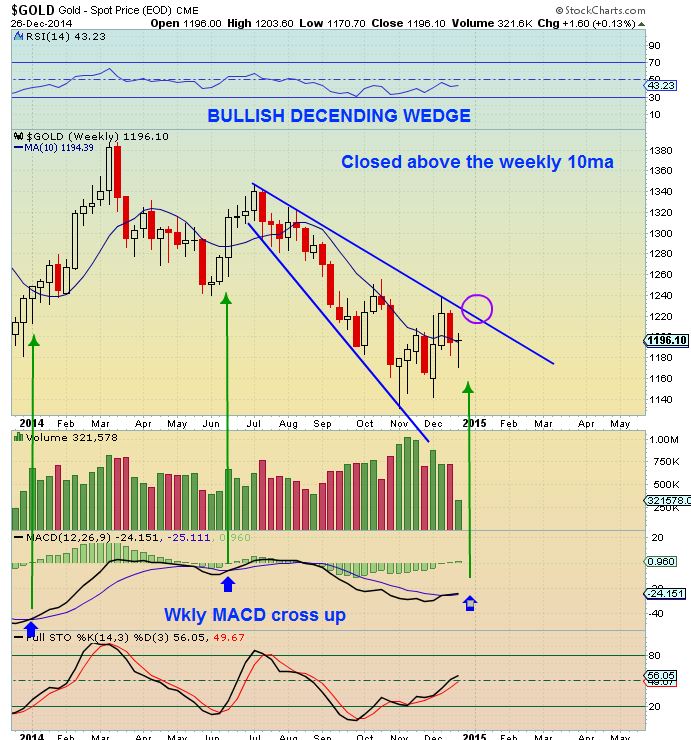
Well, that above chart was Dec 24th. This is Gold on the next trading day . Cycle timing was getting late and suddenly we see a sign of strength, pushing gold above the 10sma and through a downtrend line. We need to get above $1203.60 to confirm a Daily cycle low, but this set up is almost enough to confirm it.
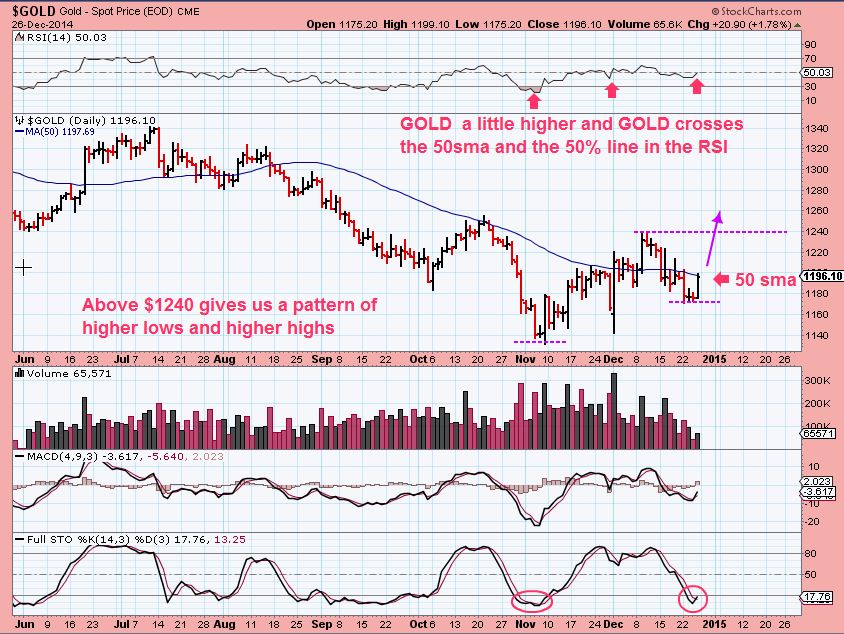
Just A little push higher improves the picture greatly- you could even say that it’d look Bullish. It’d move above the 50sma and since Gold is oversold & due for that Cycle low, you’ll have your Daily Cycle low around day 30 and room to move higher.
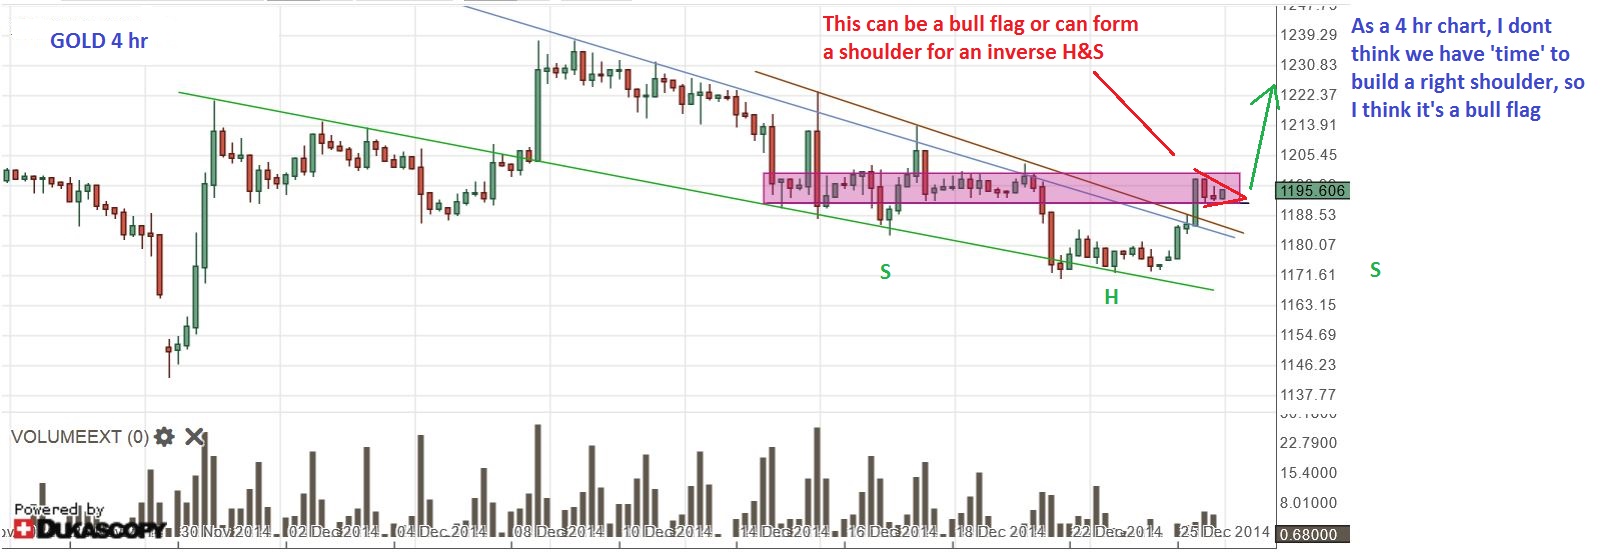
I was watching GOLD intra-day Friday and this is how it looks (sideways = inverse H&S, or maybe Bull flag, both would be Bullish)
Also a bullish wedge has formed and we closed above the 10WMA. The WEEKLY MACD is lined up for what could become a strong run higher.
I know some have felt that I am crazy looking at GOLD / Miners since some others are still calling for a collapse to $700-$1000. People think they look so weak. I believe we could get some NICE runs in Miners next ….maybe 40% maybe 60% , some could run 100% (and seriously, some have already run 100% off of the Nov lows). If this plays out, I dont want people here to miss out. If Gold bursts higher, Miners should rally nicely . AT THIS POINT, The spring looks loaded & I have targets got GOLD that are higher and may get pushed even higher as this plays out.
GOLD – WKLY Shake out recovered again! 2 possible targets short term (see chart).
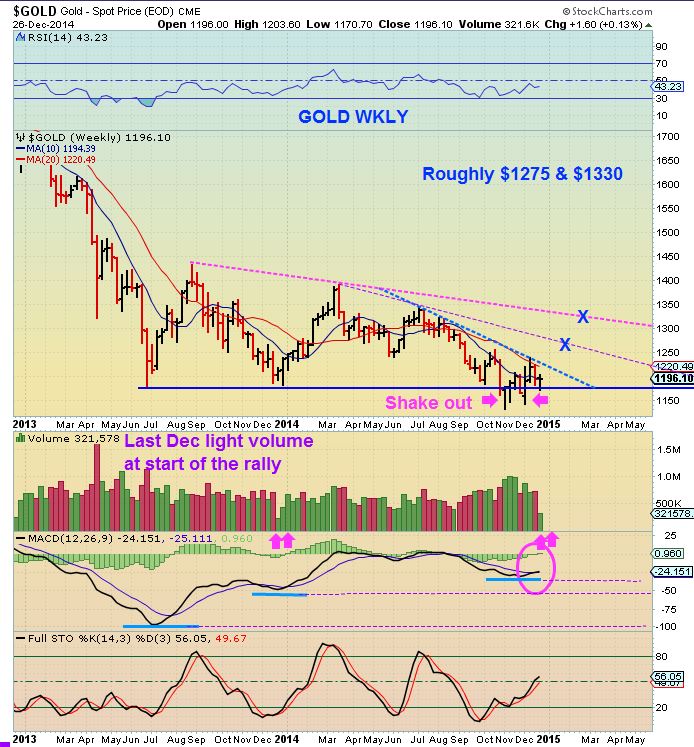
This chart is important In My Opinion, and I drew it up for all of us .
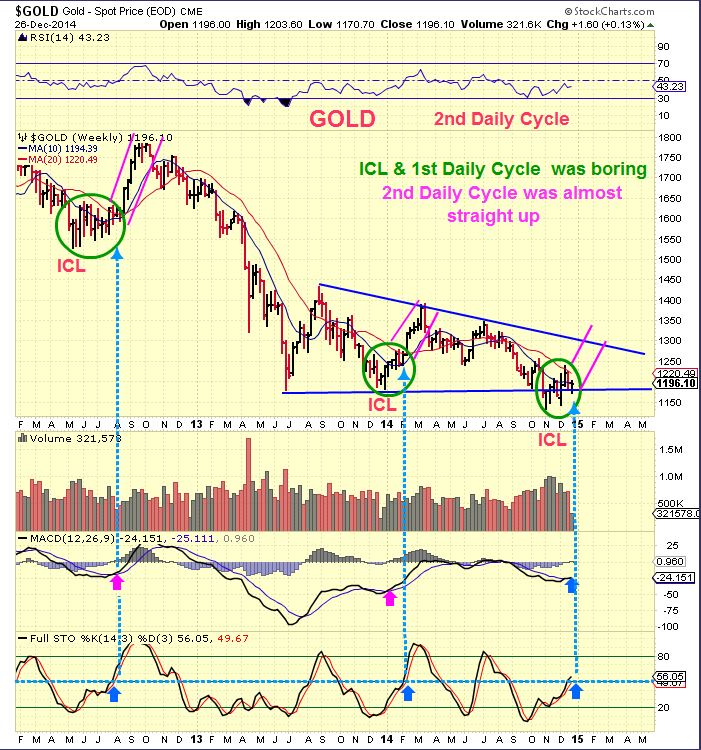
I have explained that all bottoms look different, so when an ICL forms and people expect everything to just rocket ship up – they get discouraged / frustrated / and possibly unwilling to participate when the real move finally comes along. I Admit – expected a short covering rally out of the ICL, but Miners took off and came all the way back down. THAT can still be a nice base. lets look at the 2nd daily cycle history. Please notice the ICL action and then the second daily cycle (Magenta lines). About 5 weeks straight up, so we should know soon whether or not this is going to be the real deal.
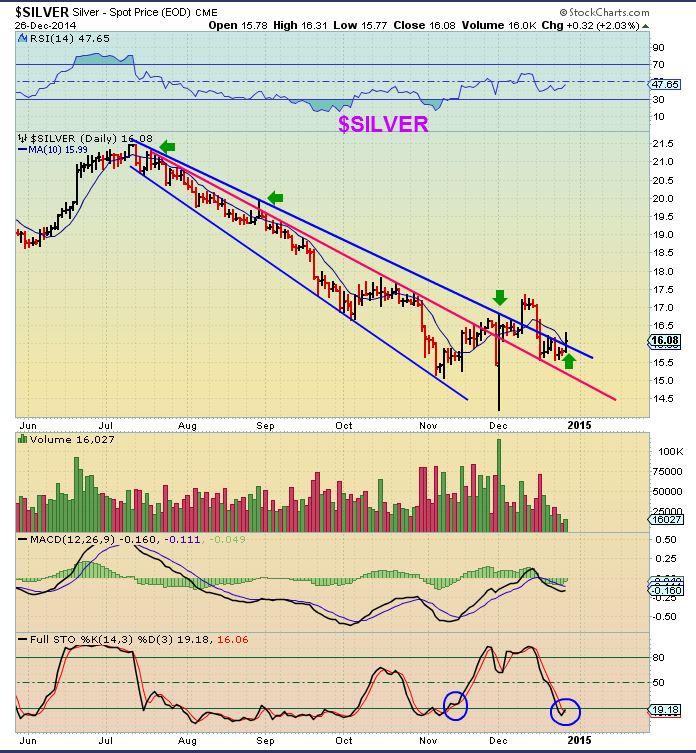
And guess what happened to SILVER Friday? I had shown this chart DEC 22
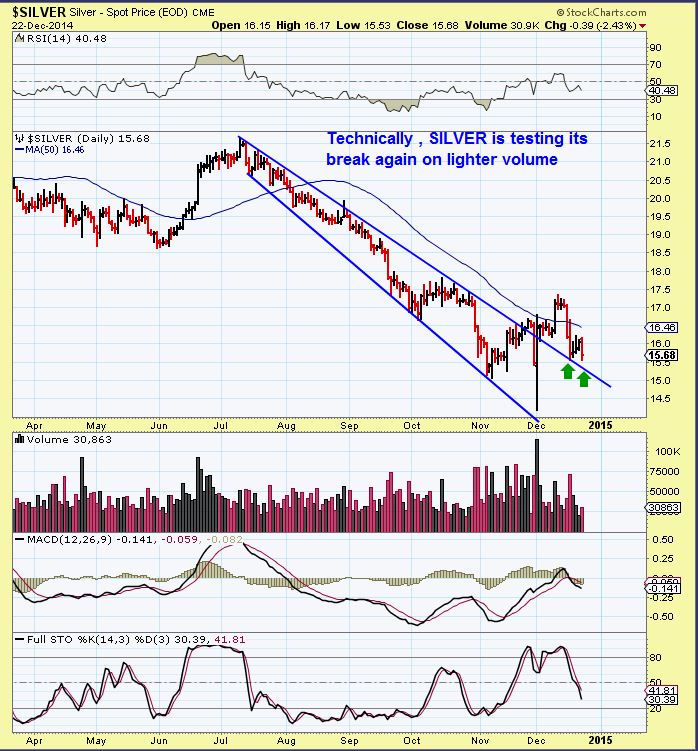
SILVER as of Friday , oversold & broke out again
and I know you remember me mentioning that HL, CDE, AG, and a few other silver stocks looked to be indicating strength was coming.
GDX still looks to have a DCL on day 28 . The DCL held last week and Friday MINERS had follow thru to Wednesdays move, but it gapped up and of course there was light volume on the Friday after Christmas. It MIGHT pull back and land on that 10sma, but it does not have to. I do expect it to break above former high if it is acting correctly. .
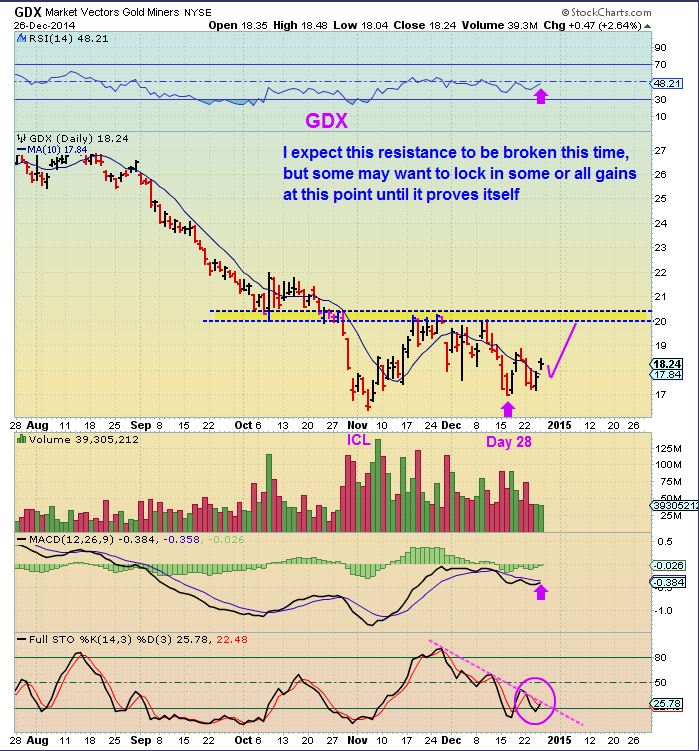
Some have said that they see nothing bullish about miners . I understand that GDX & GDXJ have pulled back to the area of the Nov lows, but they also now have decent bases that they can launch from. Bases build steam for the next move, I believe some are indicating that the move will be higher.
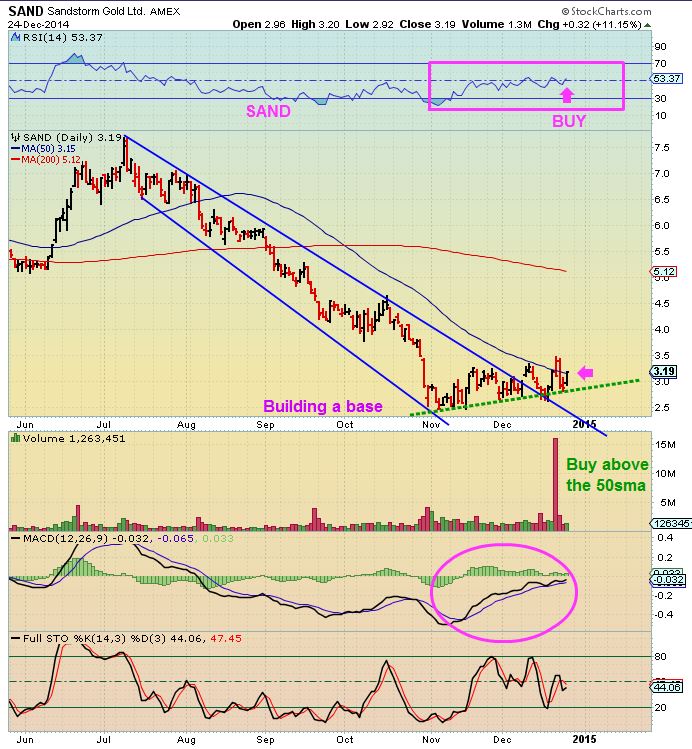
SAND for example:
This chart was Wednesday . This is a bullish set up , let me show you why.
1. Breaks out from the down channel (Broadening wedge)
2. Tests that break out
3. Friday it broke above the 50sma. It gapped and drifted lower , so it too may drop Monday to fill the gap or just keep going higher if Gold is moving higher. I like this set up, I buy Miners that are above the 10 & 50sma and have now formed a nice base. The stop is just below (maybe a little wiggle room) and the risk reward is small loss vs large % gain potential.
OK, GOLD / MINERS – nothing is broken and likely the daily cycle low is in and the 2nd daily cycle has started.The clock has been ticking and we should know very soon whether it gets a pass or fail.
GENERAL MARKETS
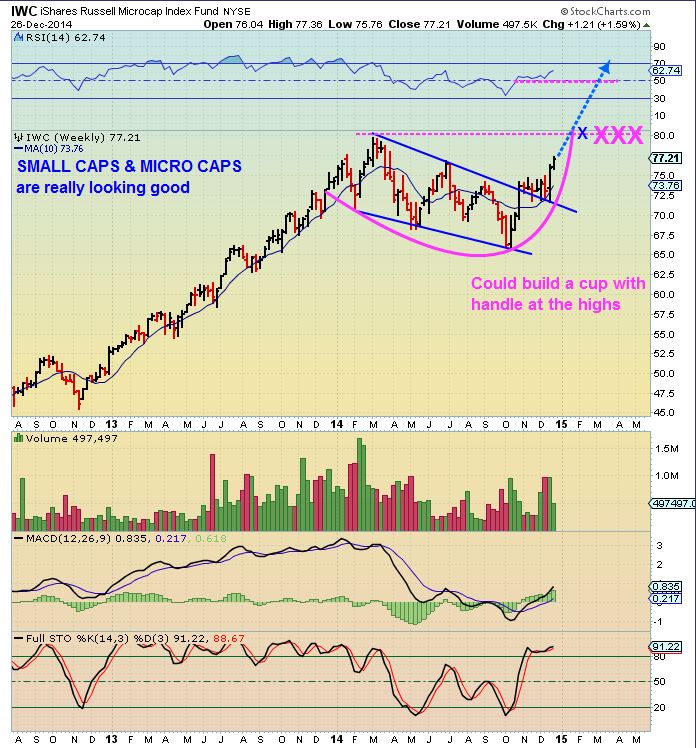
I wanted to discuss something here about the general markets. We have the DJIA, SPX, RUT, IWM at new yearly highs ( NASDAQ / QQQ & IWC, not yet). There are reasons that the markets look quite strong, but also short term reasons why it could pullback. What I am seeing is a strong sign that IWC, IWM, RUT – Small caps and Micro caps are setting up to lead higher from here. I have been watching a very bullish set of patterns form and have mentioned it briefly in the past , now I will explain in detail what it could mean for 2015.
You may recall that I posted this in a report DEC 5 . IWC possible bull flag consolidation for 1 year!
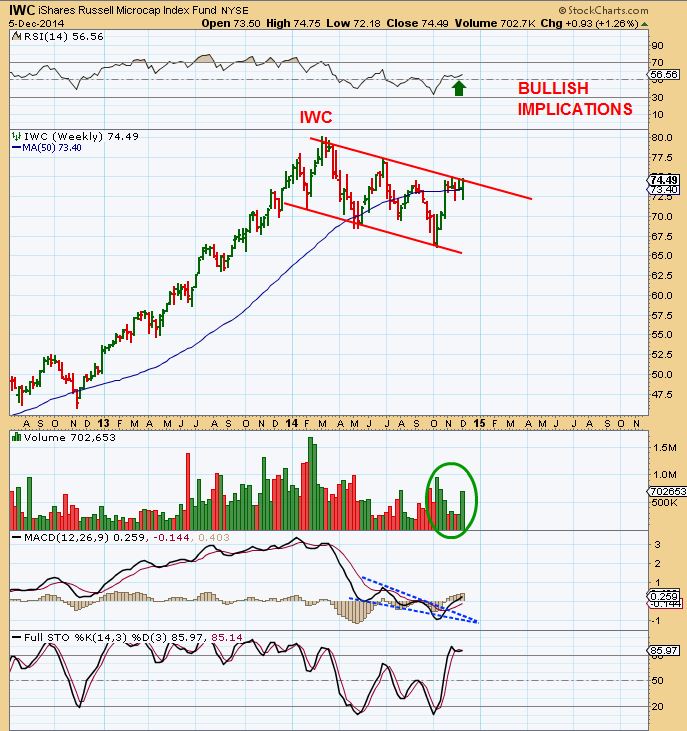
This was as of DEC 26- a break out
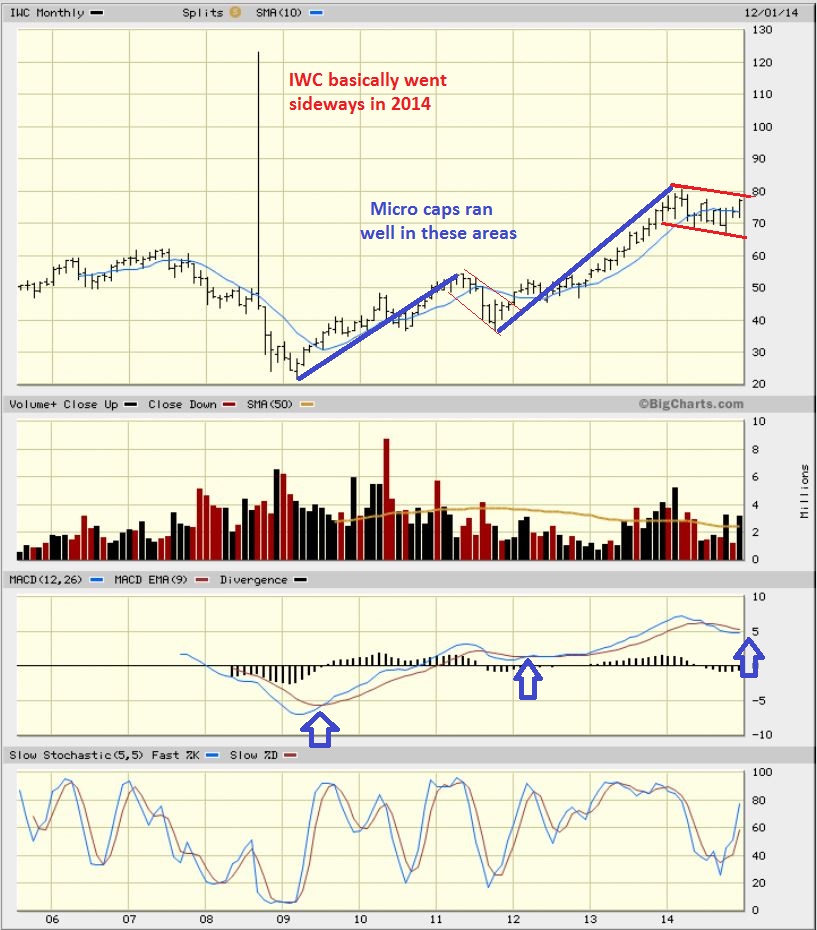
When you look at long term charts of the DJIA , SPX , NASDAQ you see that they basically kept breaking to new highs , correcting slightly , and then breaking higher again and again this year – while the small caps and Micro Caps ‘appeared weak’. This was concerning because it could mean that small caps (RUT) were showing weakness in the economy and that they all could roll over and drag down the markets. Now when I look at the consolidation that has taken place in small and micro cap stocks and see them possibly ready to break out …it looks like it may have been a healthy sideways continuation pattern like in past times.
Notice this Monthly chart of IWC- The volume looks like it wants to break higher & the Monthly MACD is preparing to cross. Sideways all year as NASDAQ / SPX / DJIA broke to new highs repeatedly.
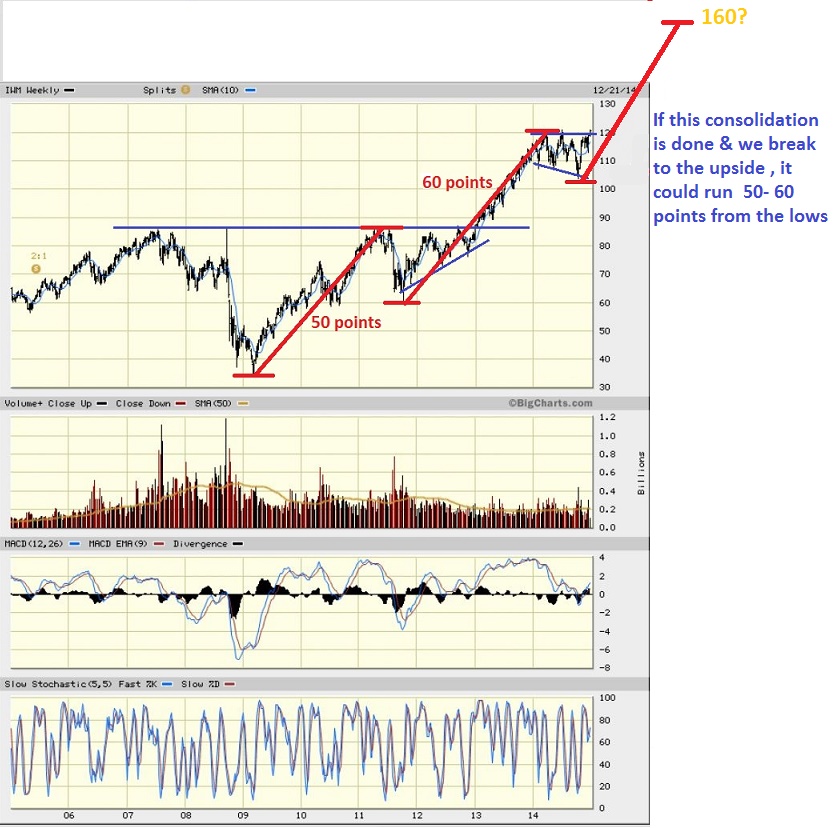
IWM WEEKLY also just turned up at the MACD ZERO LINE
That leads me to a few ideas, and it’ll take time to see how it plays out, but it really looks like it is time for SMALL CAPS & MICRO CAPS to have a good year again (2014 was sideways for many , and quite a few pulled back while QQQ was hitting new highs).
Let me think out loud for a minute.
1. SPX & QQQ etc could put in their own sideways type consolidation in 2015 and Sector rotation could cause money to flow out from there and into IWC, RUT, IWM as they break from 1 yr consolidations and make their way higher.
2. SPX , QQQ etc could go absolutely parabolic and they all run higher together.
3. Something else- we will know it when we see it
Shorter term – The markets look like they need to rest, pullback a little, or go sideways soon. This is SPX and there is weakness in a few areas. They all look a little like this .

SUMMARY
I dont want to confuse anyone, but I have a variety of readers that want a variety of trade ideas. I want to look at several different possibilities going through 2015. Right now I am focused on Miners as a potential nice %-Gain at the start of a 2nd daily cycle. I think some nice gains can be made here. AFTER THAT? It will depend on many things, so we may need to look at other trade ideas.
I also mentioned that some of the energy stocks might pullback from recent pops higher and offer good low risk entry points for another pop higher . I understand that Some here only want to know about Miners, while others may want to know about Energy. Still others want a few trade ideas for tech stocks , etc
I am certainly NOT saying that we have to take all these trades. I am showing some set ups for someone that likes Miners, other ideas for those interested in other set ups. Ask me in the comments section if you have a specific question, I can help if I see it in a timely manner.
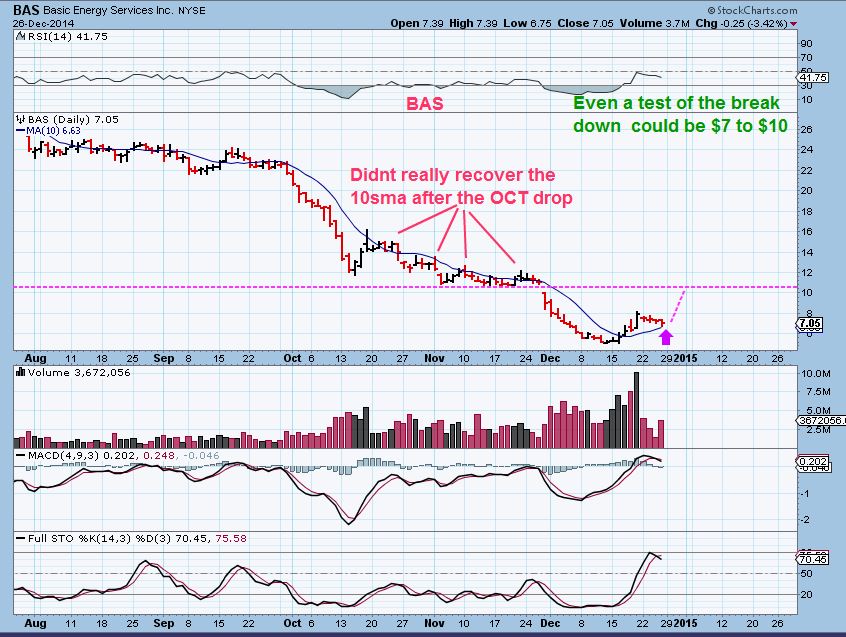
So recently I pointed out what to look for in an energy report, and some are still pulling back possibly offering a lower risk entry .
BAS for ex , bouncing around the 10sma.
I also see a lot of small cap stocks now setting up and since the IWM, IWC, RUT look like they want to move higher in 2015 , I will likely post some set ups of interesting small caps. I skimmed a few this weekend and I will just show some of the beaten down ones that suddenly look as though they may come to life.
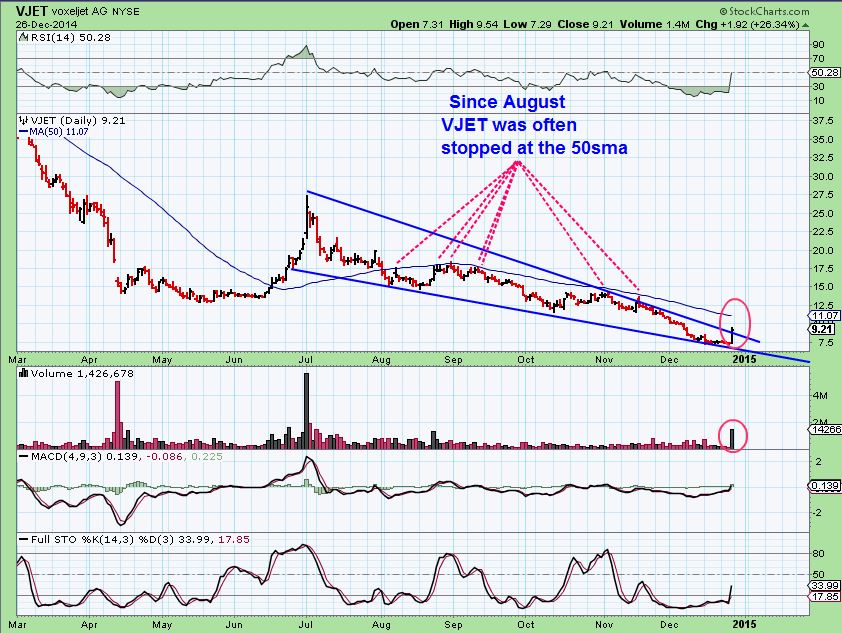
Do you remember when 3D Printers were on FIRE! We may see it again.
VJET was up 27% Friday ! I traded this around $14 this summer. It ran from $12 to $27 in a few weeks of June. Now breaking out, but the 50sma has held it back in the past. Lets see how it handles that .
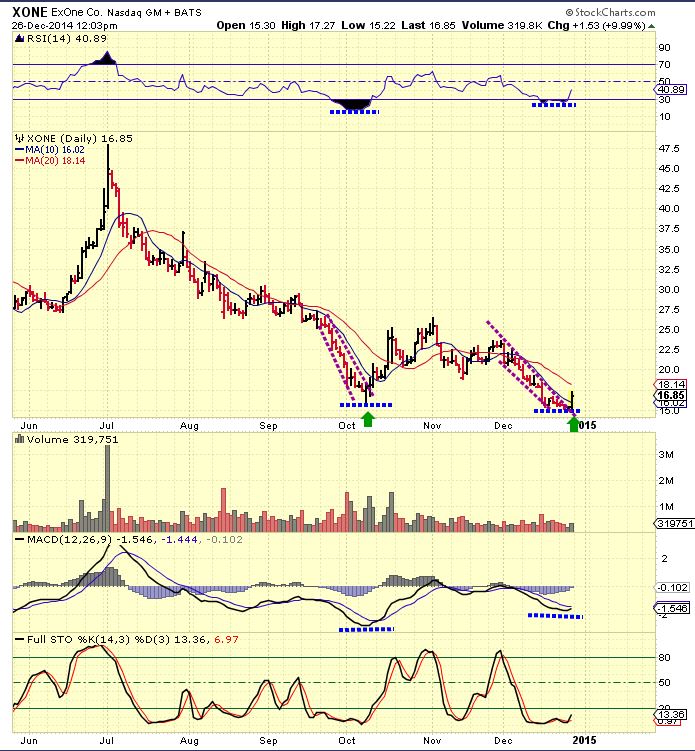
XONE – double bottom w/ MACD divergence
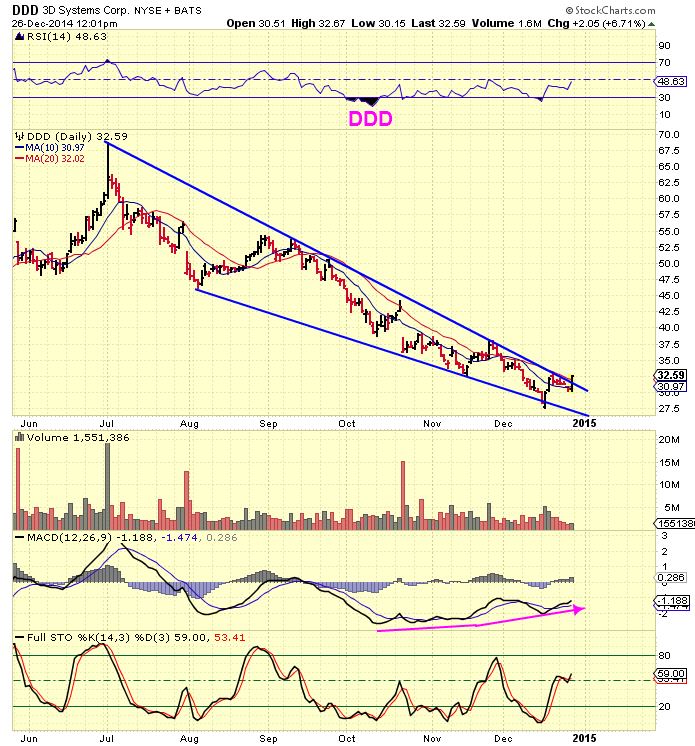
DDD – appears to be breaking out of a wedge
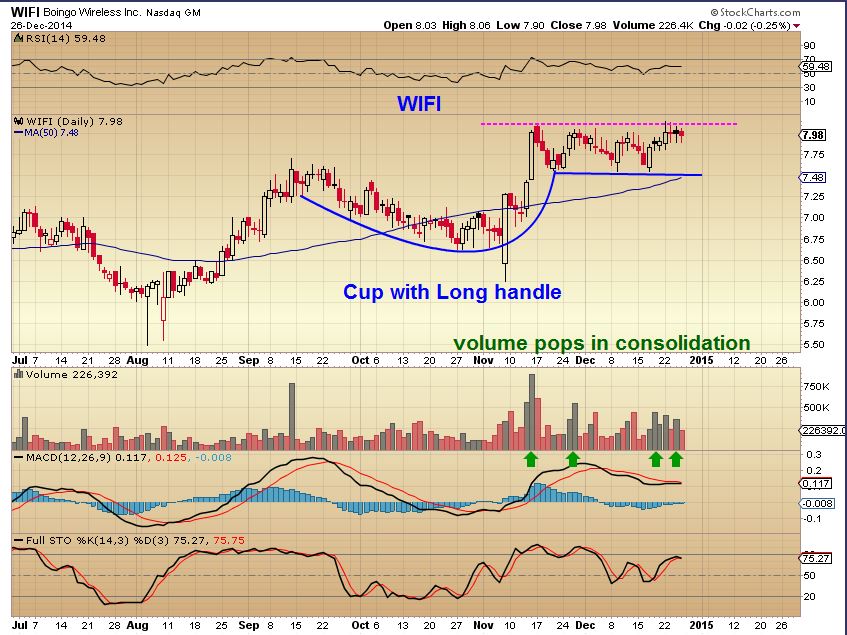
WIFI – this could break out here . If it dropped to the 50sma & tags that blue trend line one more time , that’s a low risk entry. A break out higher could be too with a stop at the magenta line.
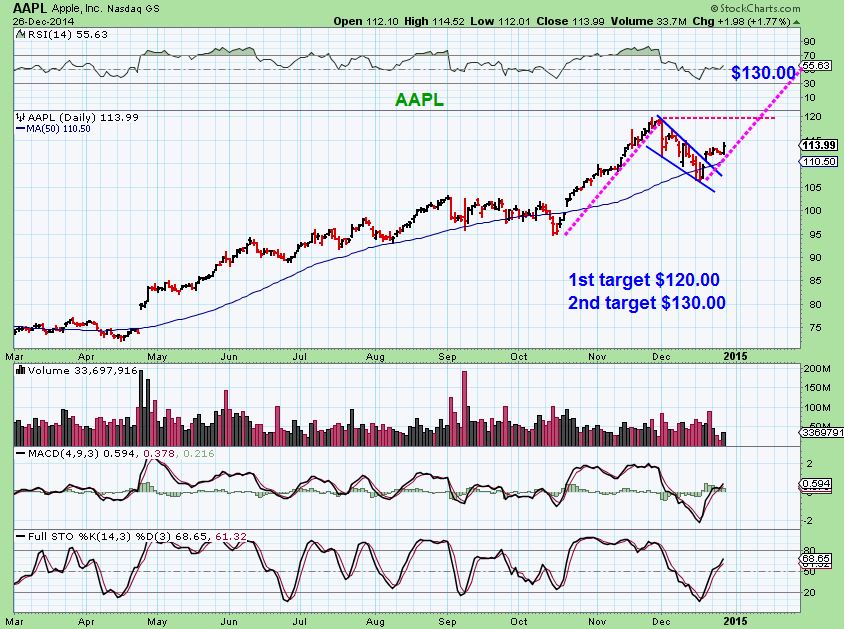
ANYONE looking for a longer term hold? Buy & Hold . I still like EXPE, MON and look at AAPL
So thats your weekend report.
1. I am basically FOCUSED on what the Metals and miners are going to do right here & now. TIMING WISE , they are due for a 2nd daily cycle and I am expecting it to be a nice run up for a couple of weeks.
2. Cant ignore the set ups in some Energy stocks. a number have made some great %-Gains on the bounce , but I am not in any of them. I do love the set ups on many and entering them above a supportive moving average offers low risk. You get stopped out maybe 3% below , your reward can be very good if they pop. As I mentioned in my energy report, OIL seems to be holding and was due for a cycle low of its own.
3. And lastly, looking forward into 2015 , I am starting to think that some ‘under-performers’ of the latter part of 2014 may make up for lost ground. When I look at some of these small caps, they ran up VERY WELL and many have just given it up as 2014 ended. After a year of sideways consolidation in 2014, some are now showing signs of life. I plan on collecting a list of them and sharing them along the way. There will be opportunities through out the year if they do as some of the Nasdaq stocks have done.
This report covers Monday. Tuesday morning I will report briefly what I have seen if anything important happens Monday and maybe I’ll also just post several charts of ‘set ups’ like I did above . It might be good for me to start posting a few charts and show why they are good set ups, then we can just watch them and see if they act correctly. EVEN IF NO ONE BUYS THEM Now, This will build confidence for future trade set ups as we all see how they play out. Thanks for being here and have a great week.
~ALEX


Thanks again for the report. What makes you decide to pick one out of the 5 potential? Is it the ones with high volume, patterns you’re comfortable with, greatest measured moves etc.?? Thanks and have a great New Year!
Hey Deshy _ Well, I was listing those as possible trade ideas going forward. I wanted to show that IWC, RUT, IWM show small caps may do well in 2015 , “so look at these stocks for example”. I have about 30- 40 set ups like that, but they are at this point only for active traders. Not really for buy & hold until we know what the small caps really are going to do.
All 3 of those ideas that you mentioned could be used . Of the 5 charts shown (XONE, DDD, VJET, WIFI , and AAPL…I would say AAPL is quite reliable, in an uptrend, but could be the slowest %-Gainer. It is also more of an investment for longer term by & hold as i mentioned. The others are for a quicker pop – more speculative .
WIFI – I mentioned what would get me to buy it, a break out higher or a dip to the blue line. That could even be a trade-able consolidation (As mentioned ) , but its only about a .50 cent range.
3 D stocks are breaking out from 6 month down trends (Not out of the woods long term yet) . In Tech analysis, IF conditions remain good , a stock with a ‘high Volume High’ often gets re-tested in time if they recover. They have high volume highs in July. It can take 3- 6 months to work its way back up there and again conditions would need to be good for 3d stocks to run higher. SO looking at the above charts… DDD would double, while VJET & XONE could triple to test those highs, so thats in the back of my mind. Also – I consider, Is it just a trade for now? look for overhead resistance, 50 sma above, etc as 1st point targets.
Will VJET get above the 50 sma this time? One could wait until it does and buy then. These can just go on a watchlist and watch how they play out. We dont always need to catch a move off of the lows, we can watch them as they play out & but the pull backs for a safe entry. I was just trying to back up what I was seeing in small caps with a few stocks that sold off the past 6 months exhibiting a possible change.
Alex-is there a leveraged micro cap ETF or is TNA (small cap) the closest we will find?
TNA is good, others seem to have no volume. You’d get trapped in them on a sell off (SMLL has minimal volume, MIDU is mid cap- also lightish volume)
OK brother Alex, does the ‘pass or fail’ fall in ’14 or will volumes stay too slim to demonstrate? thereby streeeetching the herd just a bit too far. 🙂 ? I stay impressed with Gold’s persistant creep along the 10 dmas, crawling downward then popping slightly over. With 100 contracts/ozs. what is this projecting? Have you developed a blow by blow characterization to eoy 2013? Although that was GDX head fake city, POG seems to be leading the doubt at this time?
Happy new year to all. Can’t believe it’s thursday!
Pass or fail just happens when it happens. Determined by price.
If swing lows ( DCL) are taken out – whether it happens in Dec or Jan is a fail if it gets too late in cycle timing. A move above the 50 sma is likely a passing sign.
I didnt really understand your last 3 questions. unless they were rhetorical? Have a good Monday
Meant to thanks for wonderful layout of the broad spectrum. Am engaging the smaller caps this week, including the bio’s.
Hey Beek – Got your email , your funny : ) I was out all afternoon , so just replied there. Thanks
Alex,
Still looking to get in to AG…..what’s a good entry?
If you pull up AG (Along with GDX & GDXJ ) and use the 10sma, today they dropped, tagged that 10sma & did a gap fill, and so far that area has held, so possibly that is the area to buy. If it sells back down there today you could enter there, if it doesnt that MIGHT be all the downside we get. with GOLD down $14- gdx & gdxj did a light volume dip to the 10sma. It doesnt look bad .
There is no way to know for sure whether we go down there tomorrow or not too. But below that area could be where you’d put your stop for minimal downside
Alex, GDX and GDXJ are holding up pretty well considering the pretty sizeable sell off in gold this morning. Right down about to the 10-day as you said. Stalking another entry, though with a tight leash. Will need gold to take out that 1203 swing in short order or else GDX might not be able to hold up. Thanks for the weekend update, playing out just like you said so far.
Energy looking rough – cutting losses on WTI play after ANOTHER daytime reversal to new lows. May revisit this in 2015 but I’d stay away this week, no chance until volume returns.
Wasnt WTI up for the day? I watched EXXI, BAS, WG and a few others and they seemed to be holding up above the 10sma. I thought WTI looked strong too. I had to leave for the afternoon, just got back in . Havent had a chance to look at much else.
And yes, the $USD just wont die. I had a 92 target on it , but seriously thought it would roll over first.
No, crude reversed hard at lunchtime. Settled 53.61 for WTI at 5 year low, Brent also at lows. XLE somehow tacked on 39 cents, but I would be scared to start a position until stability if not already in. Miners looked good considering, have decent concept of stop for them. Maybe tomorrow you can cover line in the sand for gold. As u stated, it’s about out of time.
I thought you meant the stock WTI (W&T offshore…it was up 3%)
Nice. No sorry West Texas Intermediate. Can they go up without oil? Sure, you have shown that already. But remains high risk if Crude doesn’t stabilize. Same with miners and gold!!
Any new thoughts on the dollar? Dang thing just absolutely will not roll over! As you stated gold has done well out of oversold conditions in Nov against $$ but actual uptrend will really be hard if it doesn’t get any reprieve at all.
Hi Alex, thanks for the report.What is your view about GDX and GDXJ after todays drop? We may see bottoming here, or more downside? Sorry for the stupid question, I´m new here and I´m jut learning this stuff 🙂
Hey Arigee – No question is stupid, honestly. Glad your here.
I just checked the charts and they look ok, holding above the 10sma and seem to have drifted down to do a little gap fill. Not bad with GOLD down $14 . The only thing that stood out that I didnt love was high volume in GLD. Its a holiday week, so I didnt expect it.
We have 2 more days of possible tax loss selling, so I’d really like to see GDX / GDXJ hold up thru Wednesday.