Comfortable- But Never Overly Relaxed
Right now I am comfortable with the present information indicating that we did see an ICL in Early November. It also appears that when we look at Gold and Miners, they have moved forward in what is likely going to be a “Right Translated” daily cycle. There is no way to KNOW this ahead of time, but what This means is that it “Peaks” its highest point in that Daily Cycle more than halfway through it. That also means that it will break to new highs once it has found its daily cycle low and reverses higher. So while I am comfortable that things are still lining up properly… I never like to get Overly Comfortable. The markets can do anything , so we stay alert . Lets examine what the Gold/ Silver/ Miners are looking like after last week, and then discuss a few other things.
Gold On Friday after the jobs report ended like this –
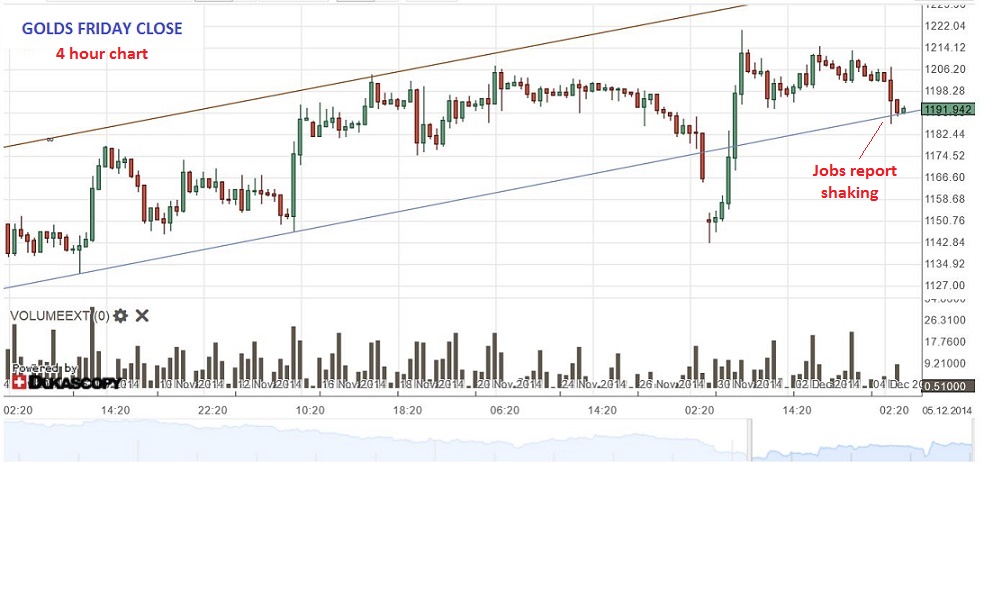
Notice this important fact about Gold …
AUDIO here Click here, click “download” , then click “OPEN and when you hear my voice, return here to follow charts
This has been a steady climb higher even with all of our Friday Shake Outs, Scary news events like the SWISS VOTE , $USD strength and so on. HOWEVER, that was the start of our ICL move off the bottom. As we now face possibly dropping down into a Daily Cycle Low, this can begin a break lower. It doesnt have to, but it is normal to see a deeper dip that expected as we drop into a Daily Cycle low. I still want to see price close above that $1179 on a WEEKLY close.
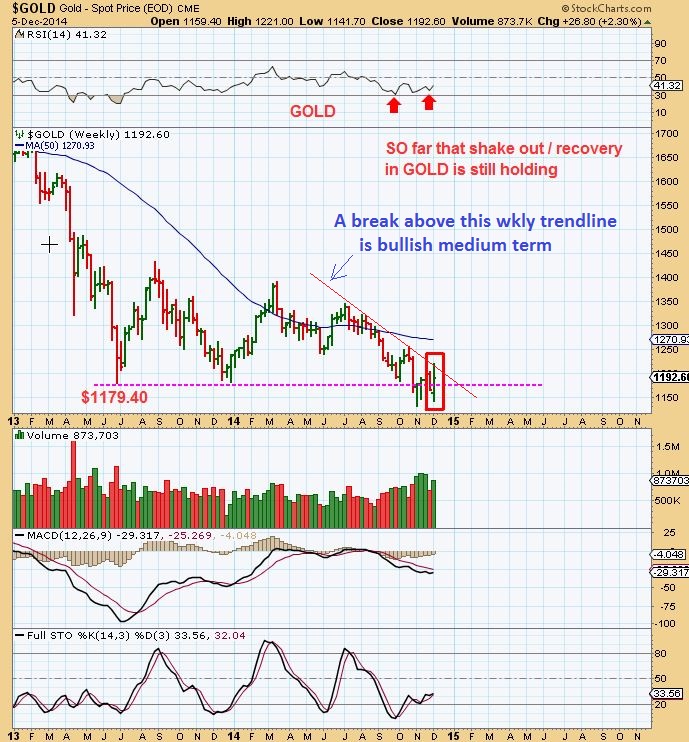
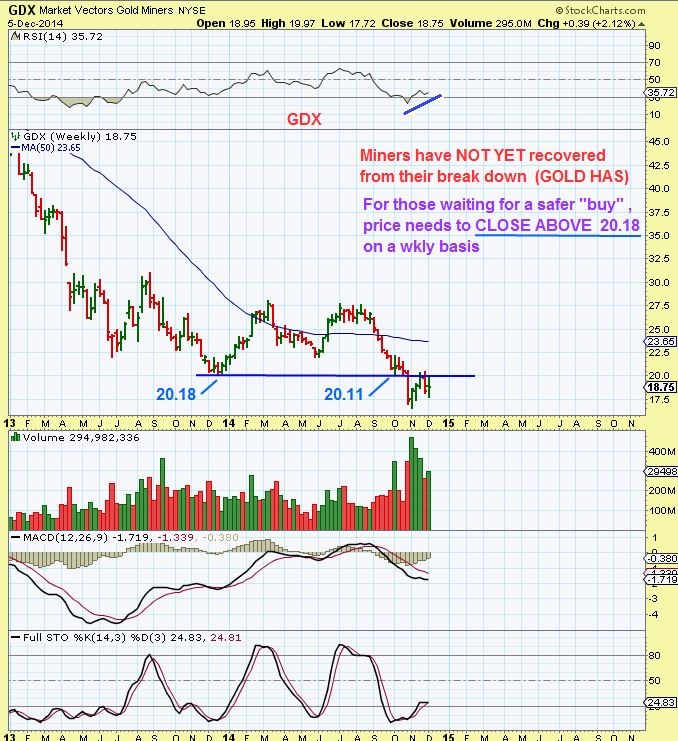
What I do like is that GOLD on a weekly basis has had its deep break down of that $1179 support, and recovered. Again, this is a classic Shake Out type move. Note the trend line overhead too. A break above is bullish in my opinion.
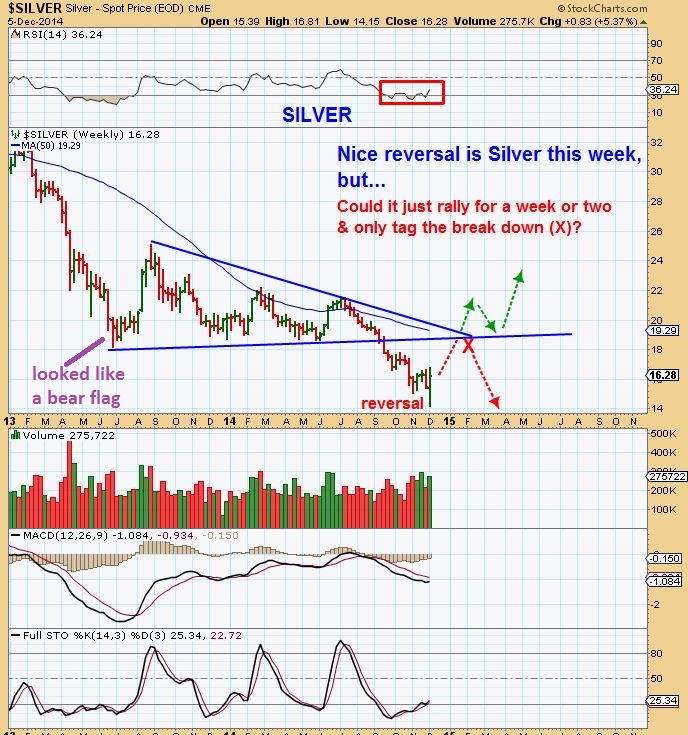
When I look at SILVER, it put in a strong weekly reversal and that’s bullish, but it still needs to prove itself. See the 2 possibilities here.
Just a “test” of the triangle break down, or will it burst through it?
Also Miners havent RECOVERED from their recent break lower. I think that will happen in the 2nd Dcycle, we need a close above $20.18 for me to be just a little more comfortable. Notice on the weekly chart that a dip for GDX to $17.50 would hardly matter. It COULD happen.
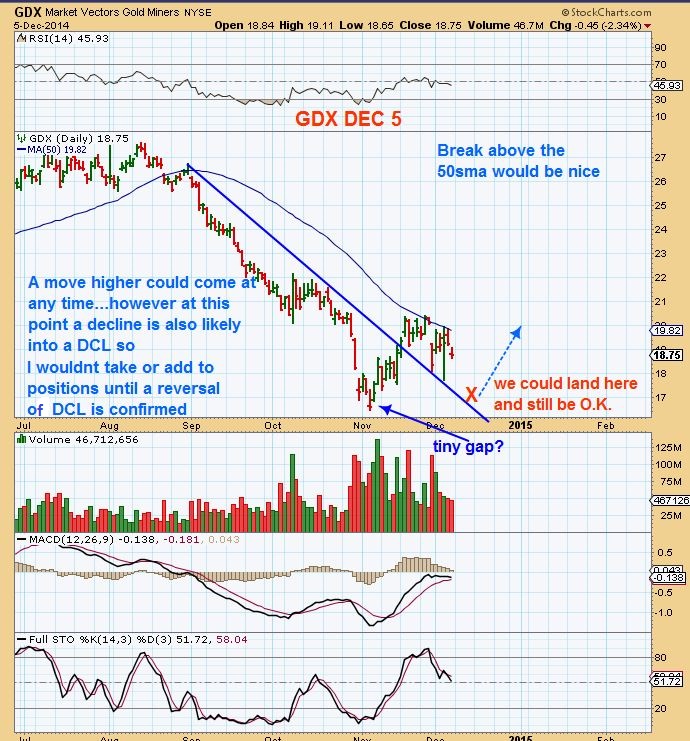
GDX DAILY CHART ( Note: Owning some Miners is Not bad here, I am discussing on the chart not adding to positions until we get a reversal).
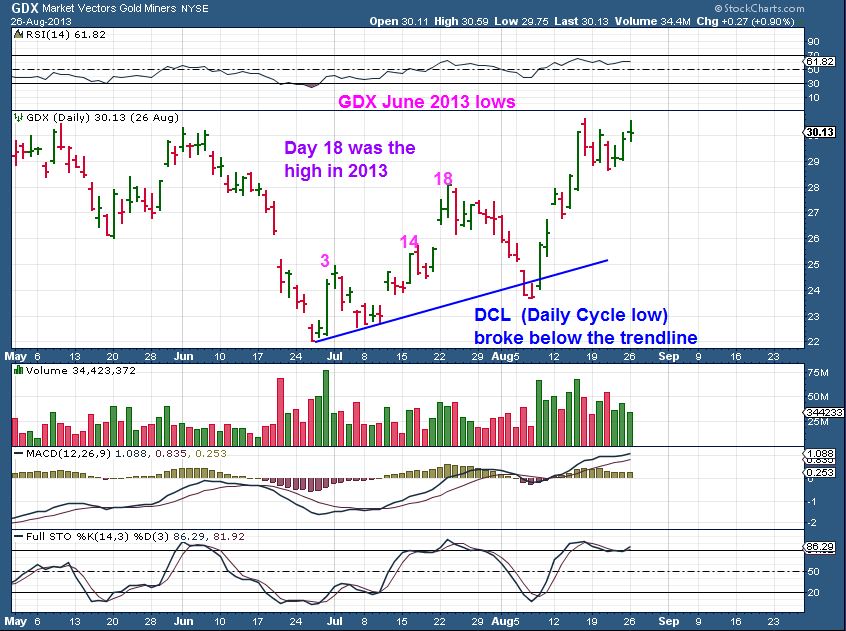
I am again showing the JUNE 2013 GDX lows. People get nervous as Miners drop into a Daily Cycle Lows. Please Note 8 red candles down (2 weeks of trading !) was then corrected in 3 days up out of the dcycle lows. Currently I think GDX is buliding steam to try to break above the 50sma and it may drop to do that. I am comfortable with that, but it cannot break the early Nov lows.
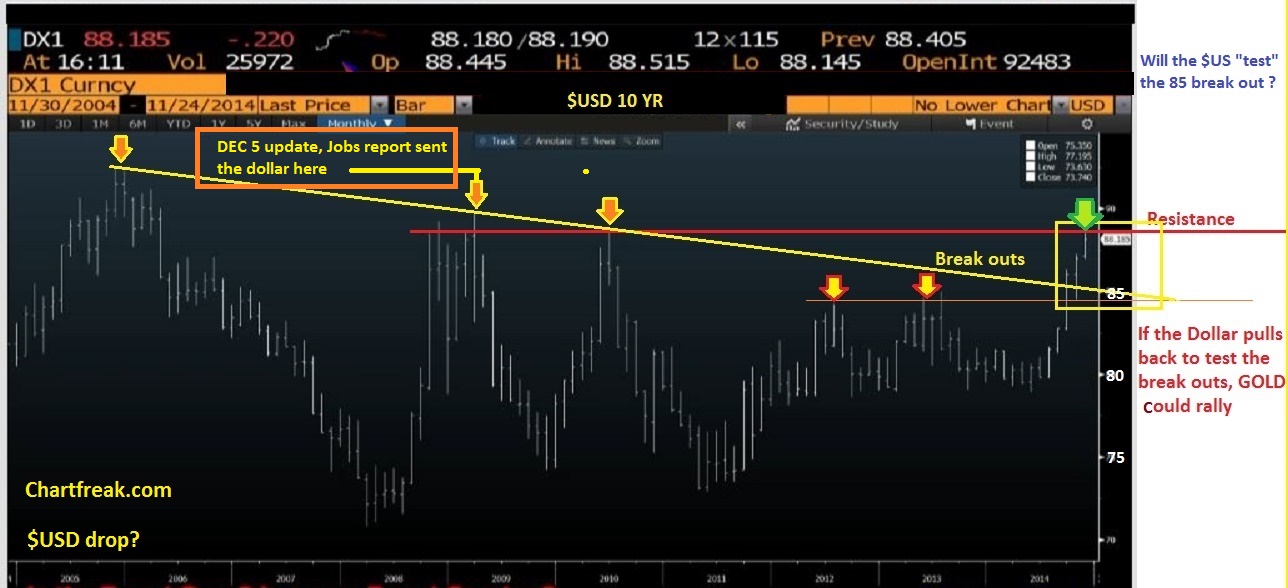
I have expected the Dollar to dip. I must say it looks BULLISH, but it always has before such a dip. Lets re-visit the dollar. This was my chart last week…I was thinking that we hit the 2010 highs ( Red line) and could pullback to test the resent break out near $85 ( I DID mention that it had a higher price target, but I expected a dip )
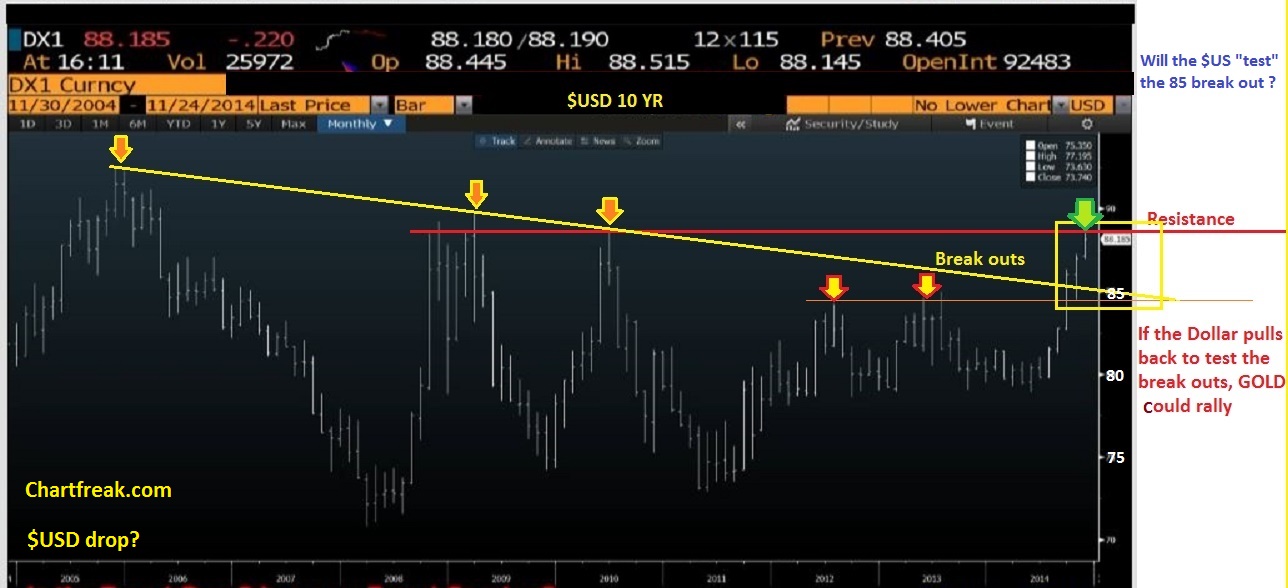
This is an updated version of that Chart. The $USD has broken a tad higher and is now at the 2009 highs . See the orange Box on the left
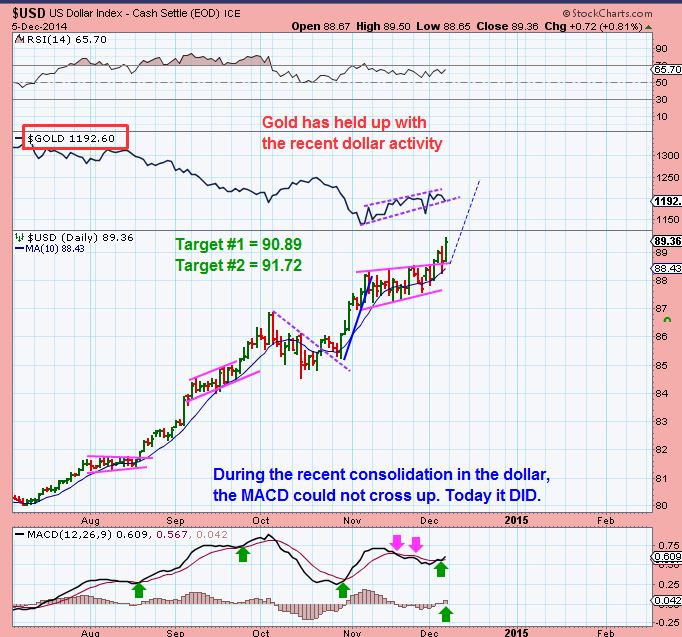
This shows the $USD now. It doesn’t make me feel OVERLY COMFORTABLE. Notice that-
1. The Dollars rise (Large middle box) is not killing Gold like it used to ( Box above it ) .
2. There is No Doubt that This looks like a bullish set up. The $USD MACD crossed up, it broke out from a consolidation, Target in the 90’s again etc. however…
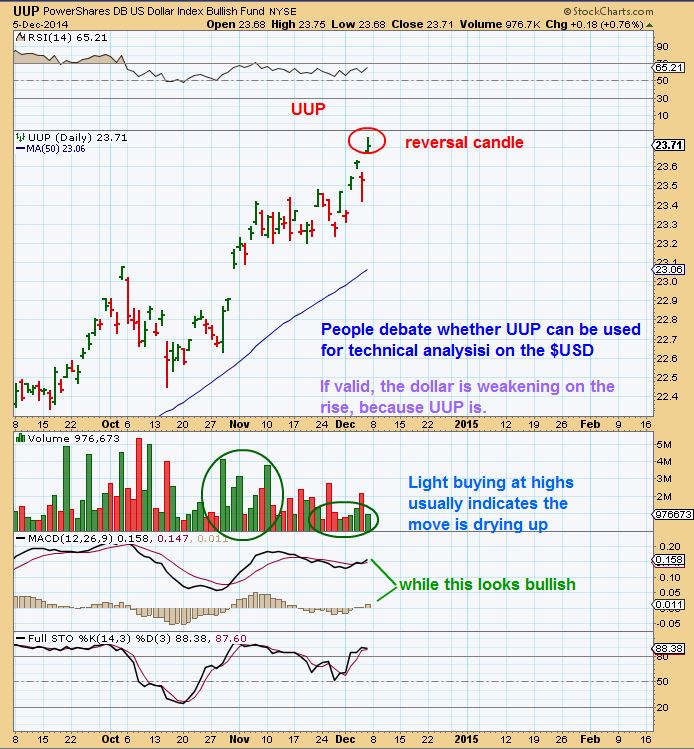
Can UUP be used to get a look at internals? It is often debated. When I do look at the UUP , I’m still not seeing real conviction. Breaking out on light volume is usually a tell that a pullback is near , buyers are drying up.
Theres a reversal candle Friday If I used candlestick charting. SO we wait and see what the Dollar wants to do.
SO NOTHING HAS CHANGED BASICALLY> We need to see how Gold/Miners wants to pullback into a DCL, and go from there. Nothing has changed at this point.
OIL is so oversold, that it is really due for at least a Shot covering rally or Bounce. When it starts , it could possibly take the shape of these 3 scenarios, but at this point I have no edge on which way this would play out. This looks like a capitulation bottom though.
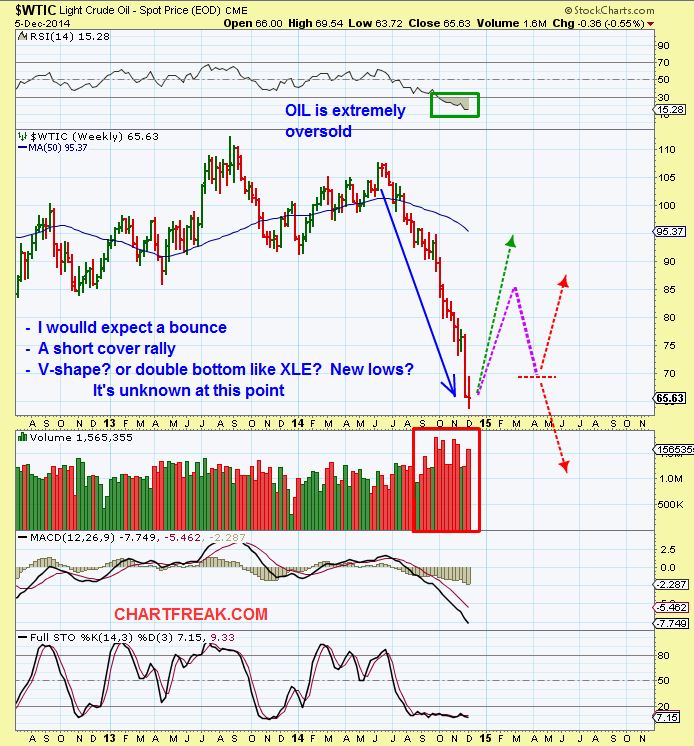
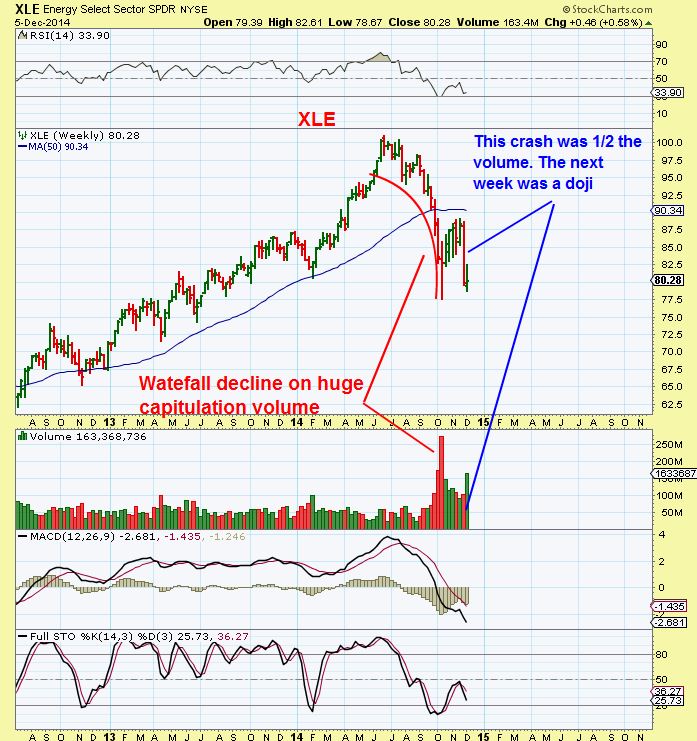
I favor the purple line on the OIL chart above , and XLE WEEKLY basically played out that way so far too. It had a Slam DOWN 2 WEEKS AGO WITH THAT OPEC DECISION TOO. It then reversal last week after a second leg down that had lighter selling forming a doji. XLE may be setting up for a run higher, but a Doji is a weak reversal , it needs more confirmation..
IF we are in the process of dropping into the DCL in Miners, there should be some nice set ups presenting themselves soon. I look for them and will share them here.
FRIDAY in my report I pointed out 2 such set ups that I liked . Lets review here and see why I lik e these explosive type set ups. I posted these 2 charts (Along with a couple of others)
HIMX
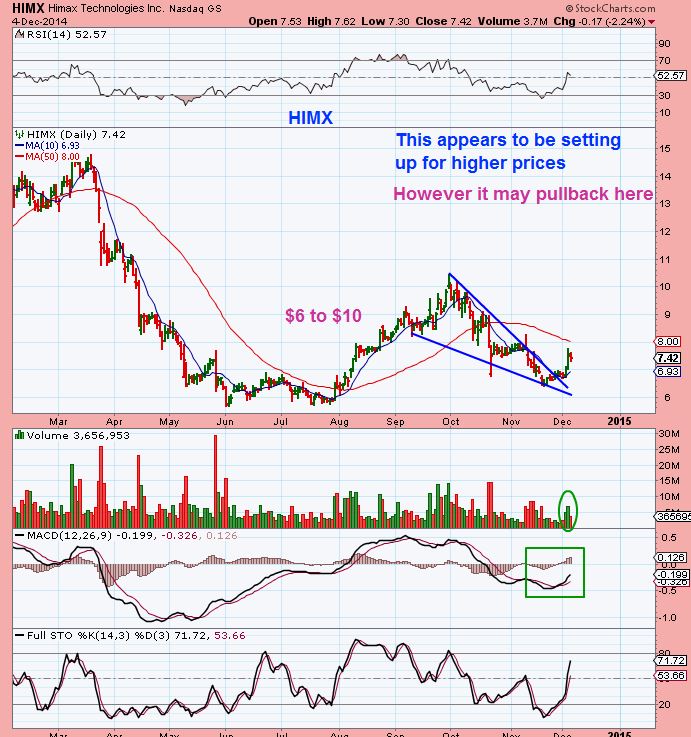
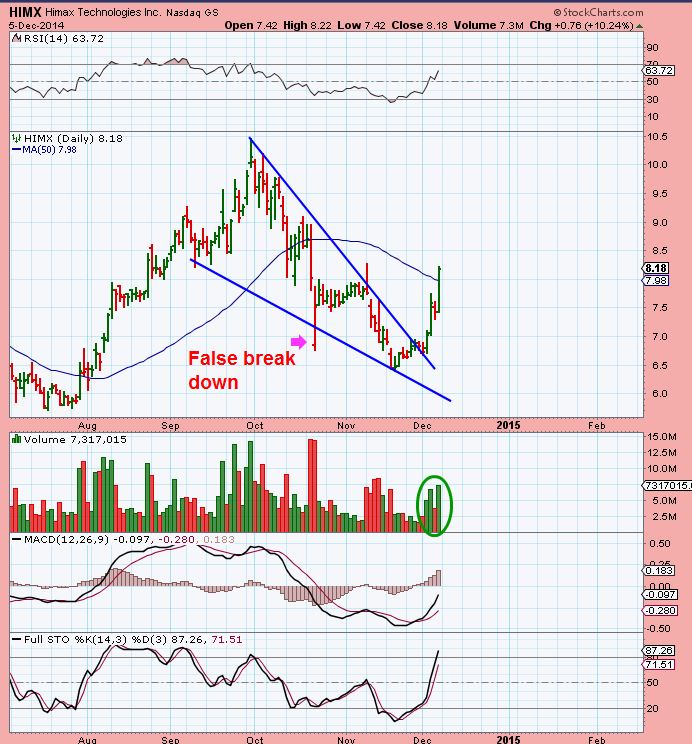
This was Friday end of day (10 % higher)
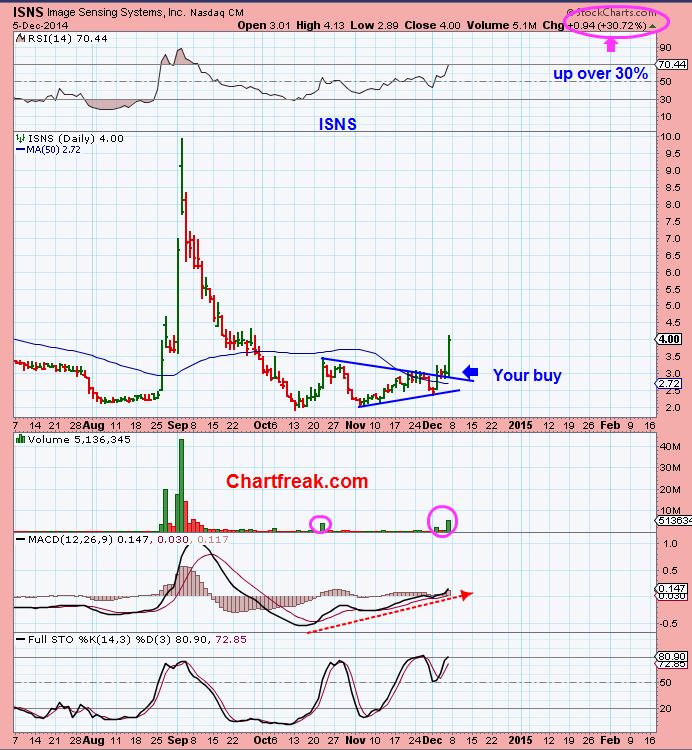
Check this out : This was ISNS Friday morning (We may find a Miners set up like this soon)
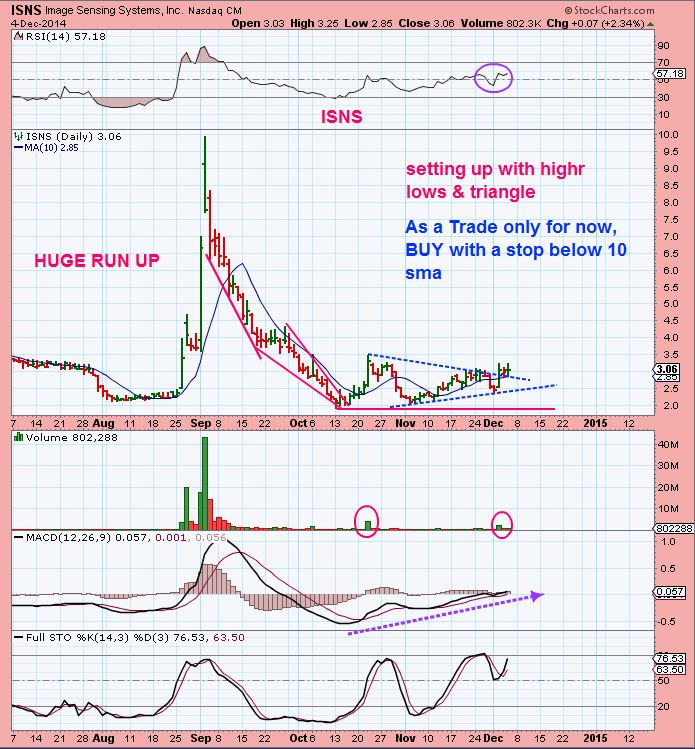
ISNS same day (Up over 30%)
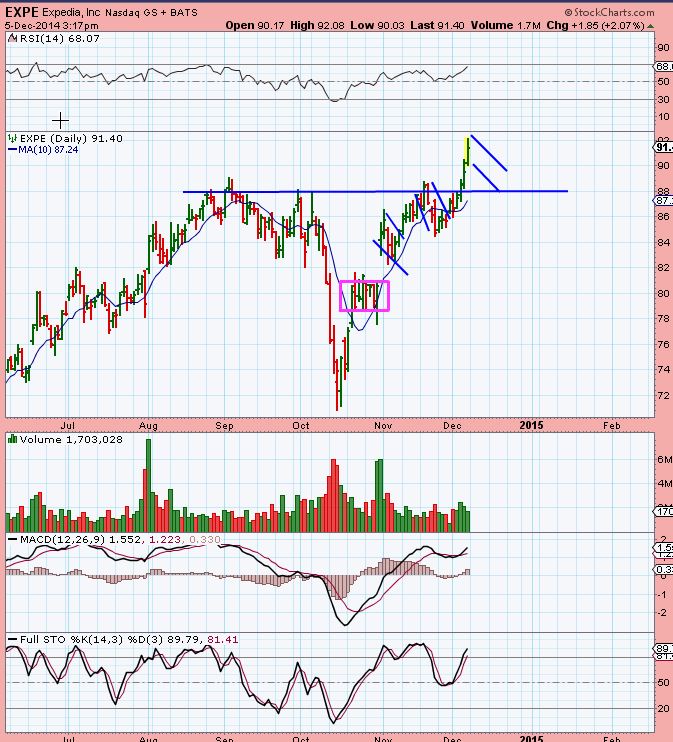
I also covered EXPE and MON as longer term break outs, buy & ride types. This is EXPE now as it continued higher. A reader here emailed me and said they bought it. I mentioned that It CAN pullback & test the break out, that often happens, or it may just ride higher, but it still looks like it will get to $100 .
I have other trade “Set ups” that I am watching and like a lot. I also really Like MNDL and a few others for example, so I may post later this week if I see some set ups . MNDL is starting to run, but it “MIGHT” pullback like RADA is …and could offer another entry if it continue to act correctly
So what I am saying here is that things still look good in Metals and Miners. There are certain “Set ups’ that I like to find and grab fro just a quick POP. Sometimes they POP & GO , other times they linger too long and I move on, but often these set ups come after a run up and then some selling / bottoming. Some Miners may start to set up like this and I will try to keep my eyes open for those set ups and post here. Longer term BUY & HOLD in MINERS are still the pullbacks that come in RGLD, RIC, FNV, and I like LSG over the past 1.5 yrs too.
Instead of posting this weekend report Monday Morning like I often have, I wanted to get this before the GOLD Market starts trading Sunday night, because if I am thinking that we may need to dip down further and we do that tonight, I want you all to understand that things are still in place for an ICL to be in place from the lows in November and a possible DCL in the near future. We are in that timing window for one to take place anytime, but again, its a pretty wide window . I am still looking for a higher low and have showed you a fw things to look for. ABove the 50sma in Miners would be great. A trendline was drawn on the Gold chart – a break above that would be a buy I.M.O. too. I will post if anything happens worth talking about Monday, but likely Tuesday Morning I will post to discuss what happened Monday . Thanks for reading along.
-Feel free to ask questions in the COMMENTS section of these reports, I will check it through out Mondays trading
~ALEX


If one is out of positions in gold, what would be the right level to re-enter with minimum draw down? A swing low? Or around 1160 if it at all presents itself.”?
Hi Rishi
If I focus on the part of your question that states “Minimum draw down” I would say a close above the 50sma on Miners. The only reason I point out the 50sma is that you can get a 1 day reversal and then 1 day up, then 2 more days down to the real lows. A close above the 50ma in GDX for example likely means that the real reversal is already in & the run up has started. GDX hasnt closed above the 50sma since this summer.
If that didnt answer your question good enough (Maybe you didnt mean Miners?)
hi Rishi,
Curious how long you’ve been out of the PM’s and what piques your interest a.t.t.
Hoping you might describe the substantial drop in volume in GDX this last week.
Also, been hoping you might share your decisions (or decision making process) of moving on, out of a ‘pop and go’ or a ‘ride higher’ out of the inumerable choices you’ve suggested in your home promotion page.
A whole lotta kittens for this old guy to be herding, although some of those have certainly been exemplary.
Hi Beek-
Some of the tight set ups or patterns that I have posted over the last year here are not Buy & Hold, they are just quick trades . They have a stop closely below in case the fail, but are set up likely to POP higher, and then some will run. By knows means is trading for everyone, and I think you’ve said to me that you dont like to trade. I post those set ups because many of my readers look for that and do take advantage of it. For those who arent traders and decide to take a set up that “Pops” , just sell the pop. It was 30% in one day for ISNS, 10 % for HIMX. . It is at that point that it can run strong or dip back, but its not always straight up. . Take a look at DGLY for example. POP & dip, POP & then Dip (Chart below)
Compare that to IDRA. There is no real way of knowing what it’ll do from there, OFTEN they return to former highs, so the trader decides to take profit or hold for more , Sell 1/2 & Hold, etc. Hope that helped .