
January 3rd – Friday
6 a.m. Eastern Time EDIT: With the airstrike last night, we got a large Jump in OIL, GOLD, Silver futures,and the General Markets dropped too. Oil shot up about 4% to $64, Gold was up to $1551 or roughly $20 ( almost the highs of the last intermediate cycle), and I saw the Dow futures down over 350. The funny thing is that it just seemed to accelerate what we have already been discussing. I’m not going to change anything in this report, which was written Thursday night, but I will mention that ‘News Events’ that cause a big reaction can exhaust or reverse quickly in the short term too. We’ll just have to see how this plays out. Enjoy the Friday report.
.
Once again it is Friday, the last trading day of the week. I am going to cover about 20 – 30 charts, mostly for trading ideas. It is important to realize that NO ONE CAN OR SHOULD BUY THEM ALL. I DO NOT buy them all, but I have short term traders, scalp traders, etc that request these ideas from time to time. Some traders want Something quick to buy and sell in a day, a few days, or maybe hold for a week as a break out & run type of trade. If you are loaded up in Miners and happy with the gradual gains there, it is certainly fine to just stay put and enjoy that ride.
.
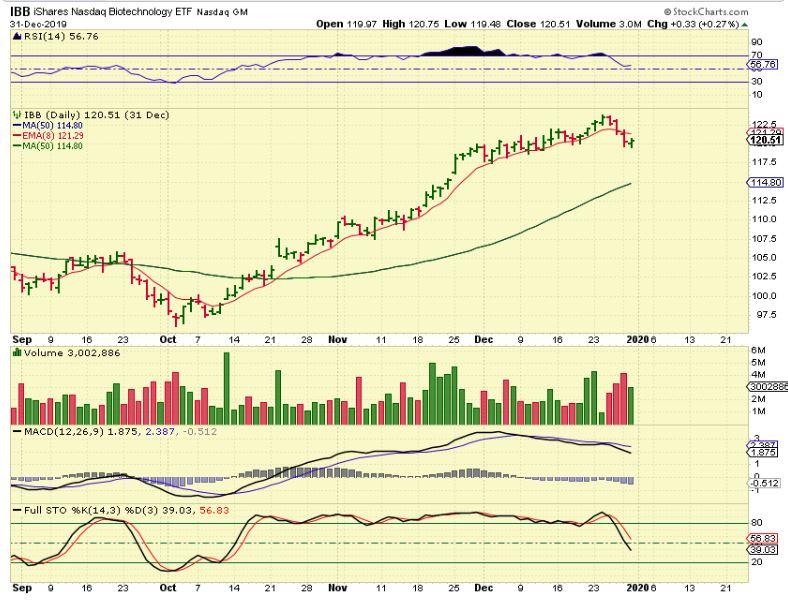
Review from yesterdays report: The General Markets & XBI & IBB could be due to short term top & drop into a dcl. We saw the XBI break the 8 ema, but it then reversed higher on Tuesday, so I said yesterday that now we’ll see if IBB can recover or will it be held down at the 8 ema? The MACD looks weak.
m
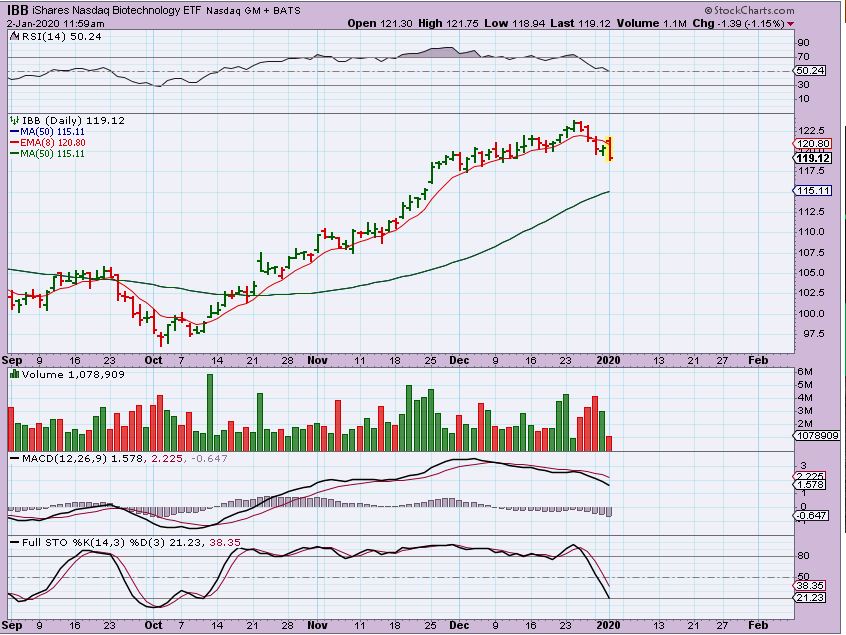
IBB – IBB dropped after gapping open, closing under that 8 ema again. After a very strong run from October, some may be taking profit here. This looks like a top.
m
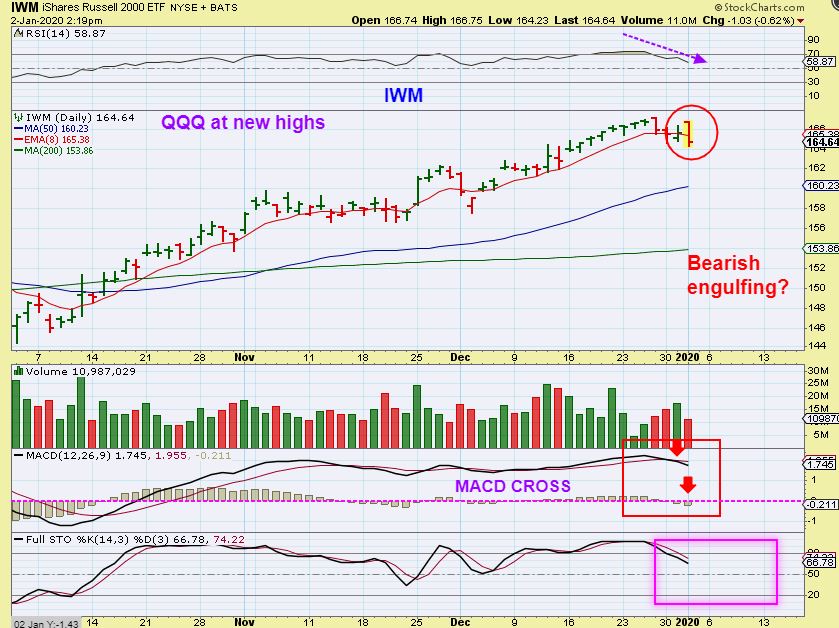
IWM – I then noticed that with the SPX, DJIA, QQQ at new highs, IWM was looking like a bearish engulfing midday. I posted this in the live area & Tweeted it out. Would things close that way? If so, it could be a bad sign short term…
m
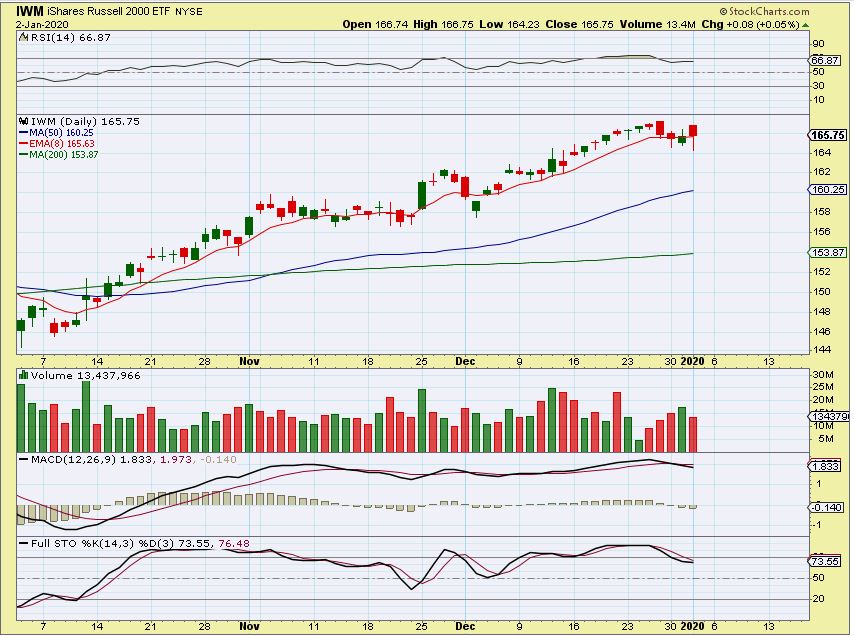
IWM – By the close, it reversed and actually regained that 8 ema, but this might be a hanging man ttype of topping candle too. Now I want to see what Friday will do with the General Markets. And …
m
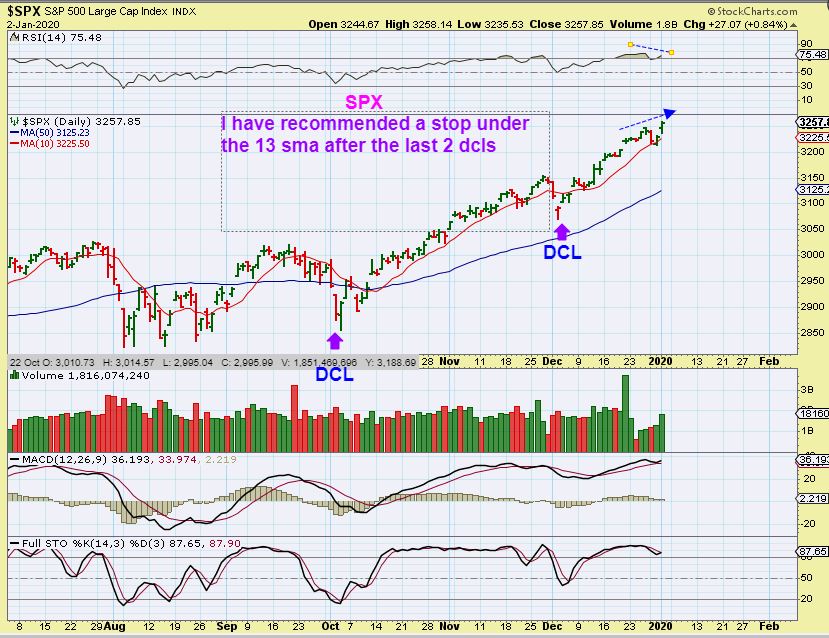
SPX – I have mentioned in my daily reports that after buying a reversal at a dcl, you can simply trail a stop around the 13 sma and you’ll remain in the trade , unless we get any sharp drops that recover quickly. So far that strategy has worked out well since October. I do see early signs of divergence now though in the RSI. This could start getting choppy.
Some of the stocks in the General market do continue to act well. I had posted semiconductors AMD, MU, TSEM weeks ago- they are still strong. There are other strong looking tech stocks too, like the software sector and Chinese stocks too. That was also mentioned a while ago. They may be due to rest though- let’s take a look…
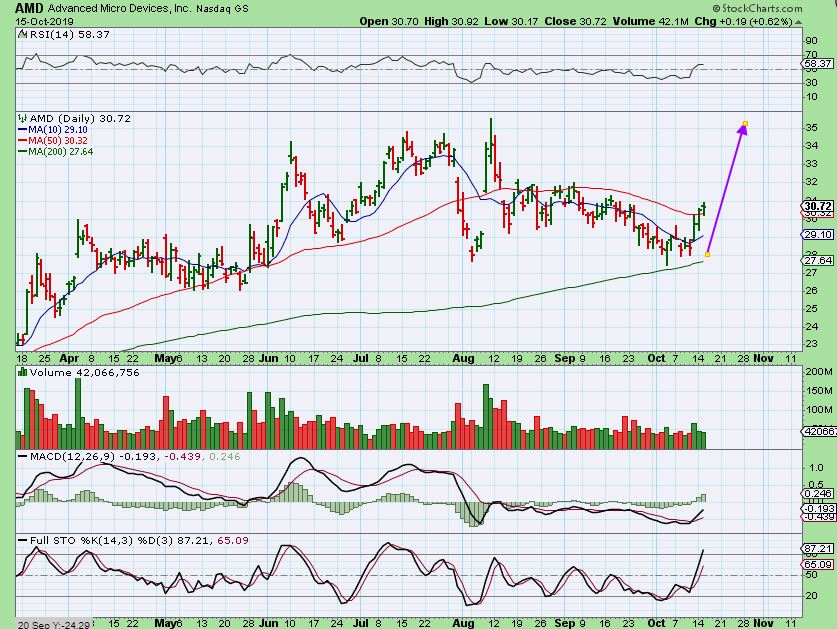
AMD was a buy at the 200sma reversal at $28.
,
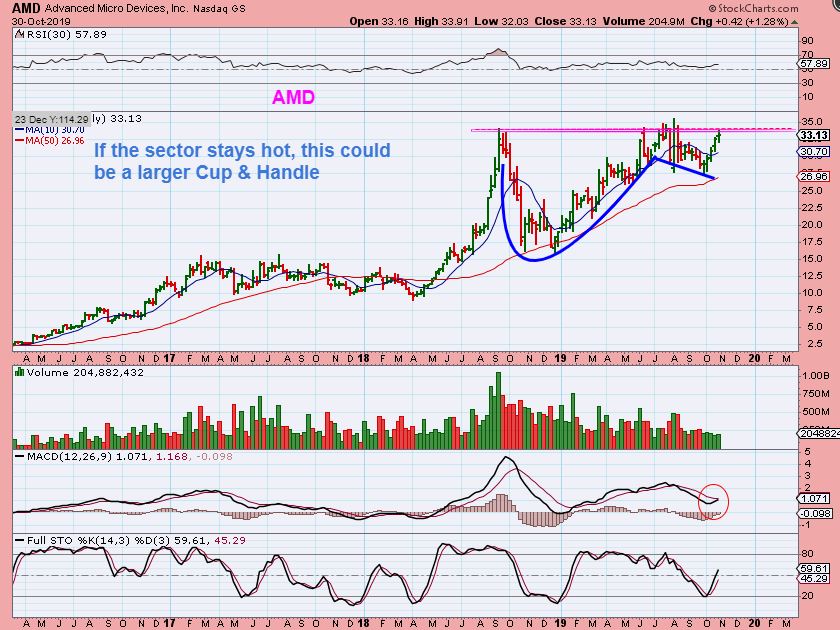
I actually posted it several times as it rallied higher. This was now a rough Weekly Cup & Handle at $33.
.
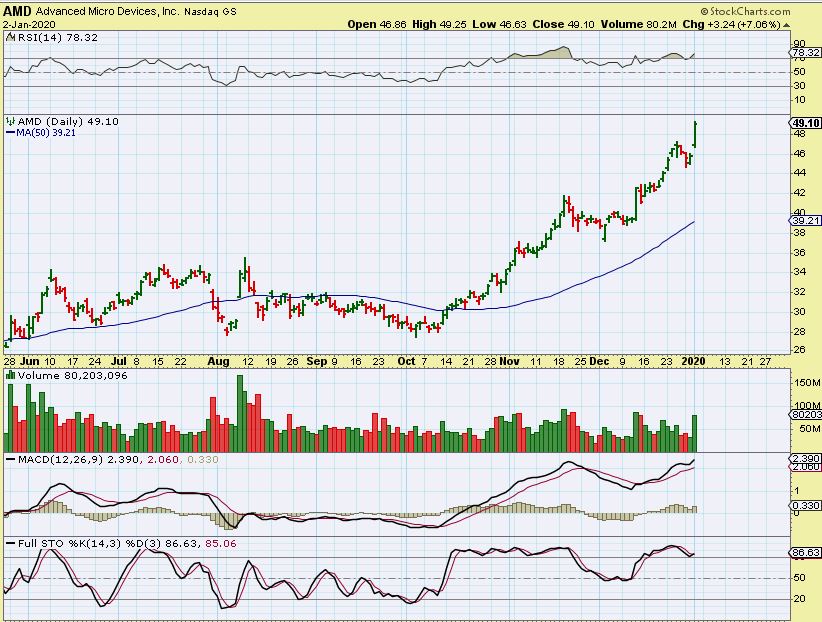
AMD– Now reaching $50, so some of these are running swiftly higher. It is possible that this will eventually dip down to the 50sma & Fill this gap. $28 to $49 has been an excellent run.
.
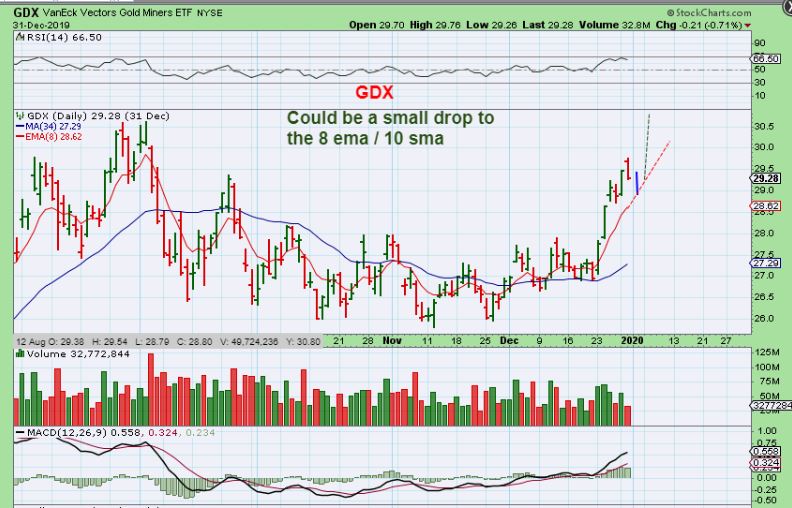
YESTERDAY I WROTE THAT WE COULD SEE GDX DIP FURTHER – I drew this & wrote, “GDX gapped open and slowly sold off. We could just see this flip higher and continue to rise, or it may just drop to the 8ema or 10sma as shown. That was not a sign of weakness, we have to expect up & down days in a run higher.”
.
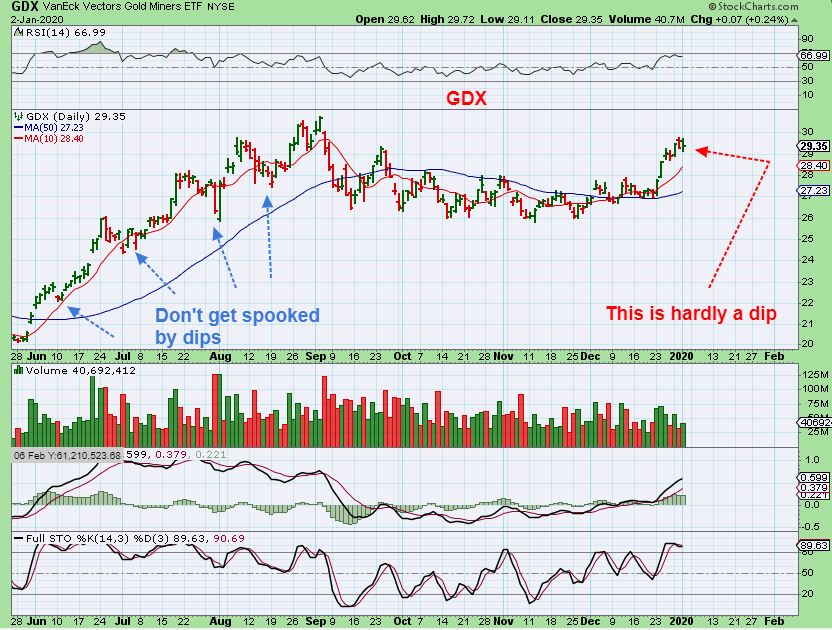
GDX – This is hardly a dip. It actually looks like just a pause along the way so far, so it could still dip even further or just run higher. That 10sma may be a target, but in Bull Markets- the Surprises do tend to be to the upside. 🙂
.
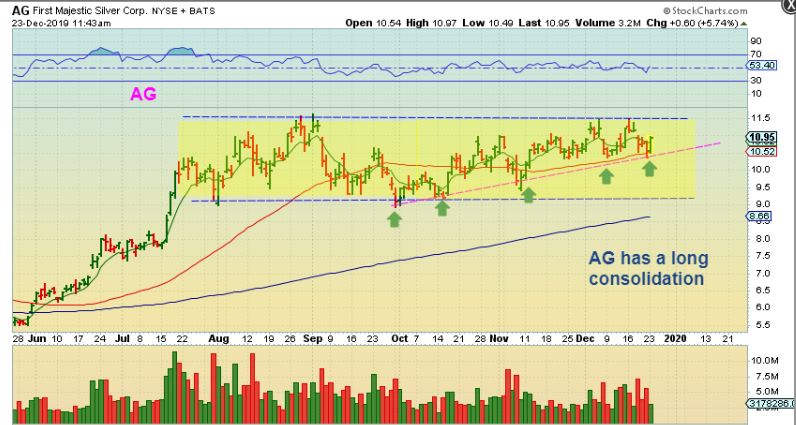
AG – So with AG we had this long consolidation and I mentioned that I owned it.
.
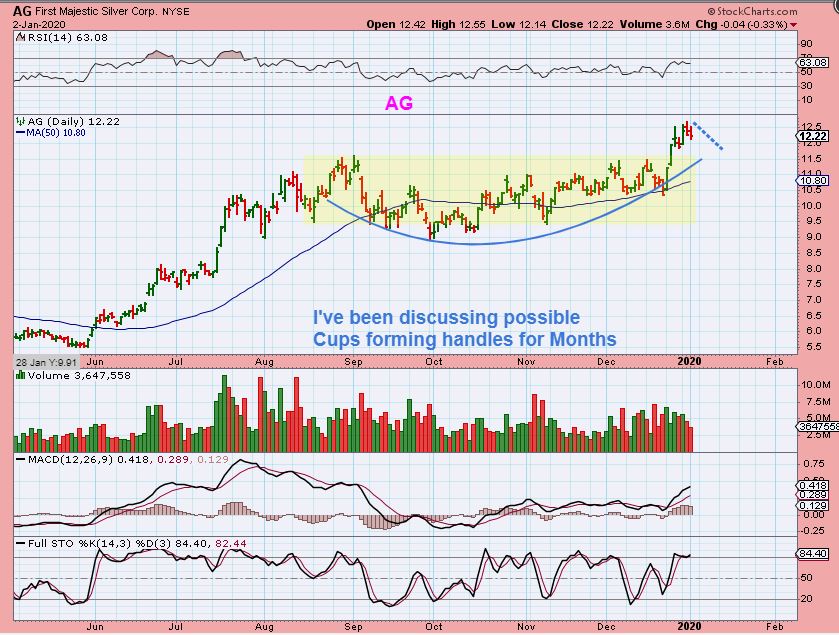
AG – I was asked, “Did you sell your AG since it isn’t performing well? I’m wondering if I should sell mine.” I understand that thinking, especially if you have lost money in Miners- so I Hope that I can help you with this: I have mentioned that I think AG can go to $18-$20, so I want to ride it from $10 to $20, even if it pauses along the way. Nothing has changed.
.
AG – The problem with watching the markets day to day is that if you are not used to that, you may not realize that stalling, dipping, and pausing are part of a normal run, and it can last for days & days. Look at the left side of this chart. Was that run straight up day after day, or did it chop sideways for 10 days at a time? It is 3 or 4 days up, 10 sideways . Maybe seeing that in the last run will help. It doubled on that run too.
.
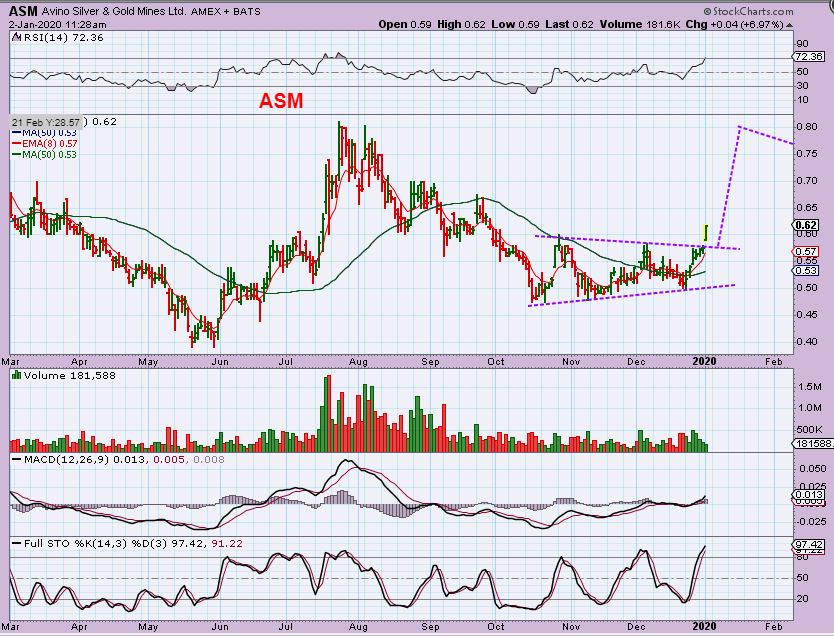
ASM – A recent PICK that was lagging but had a bullish pattern under that 50sma.
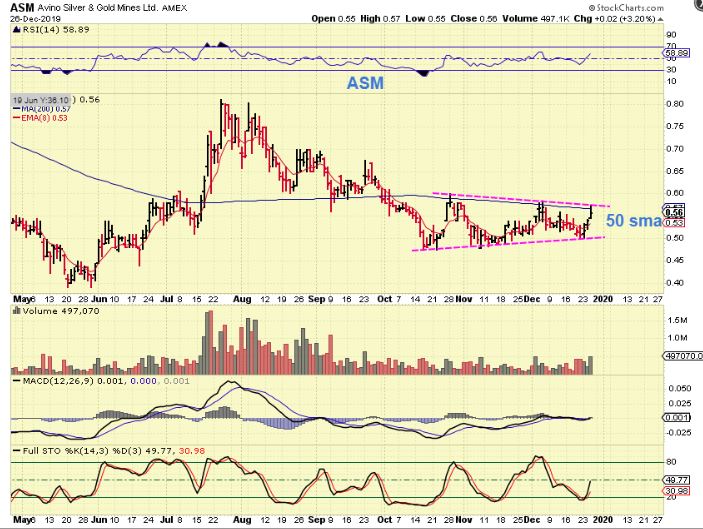
.
ASM – It popped 7 % Thursday after forming a bull flag under that 50 sma. Surprise to the upside for a laggard.
.
I discussed the MJ Sector in Thursdays report. There are bases forming and signs of life. Let’s take a quick look again…
.
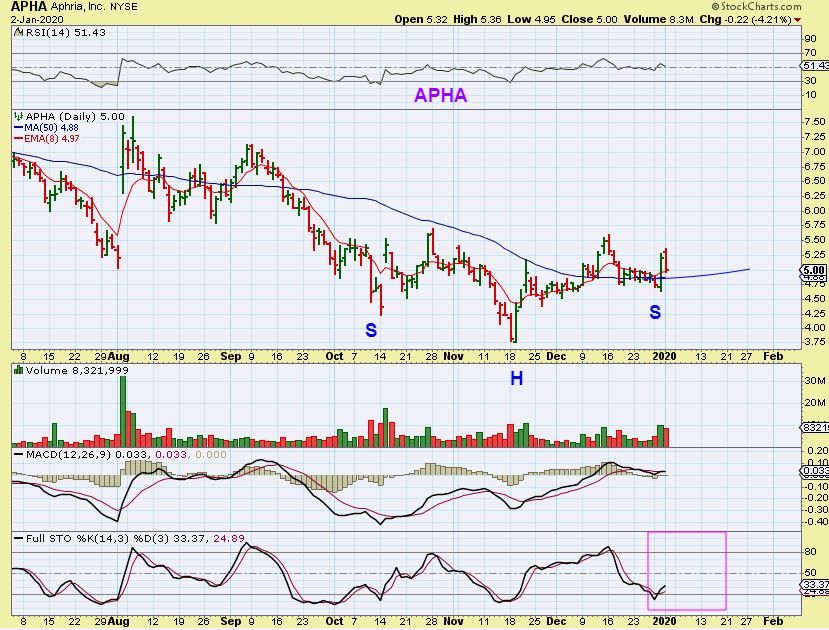
APHA – We got a pull back in APHA, CGC, and others from the report yesterday, while others pushed higher. Is this going to break down or reverse at the 50sma? I like it right here, with a stop loosely below that 50 sma, but it may crawl for a bit too if markets sell off.
.
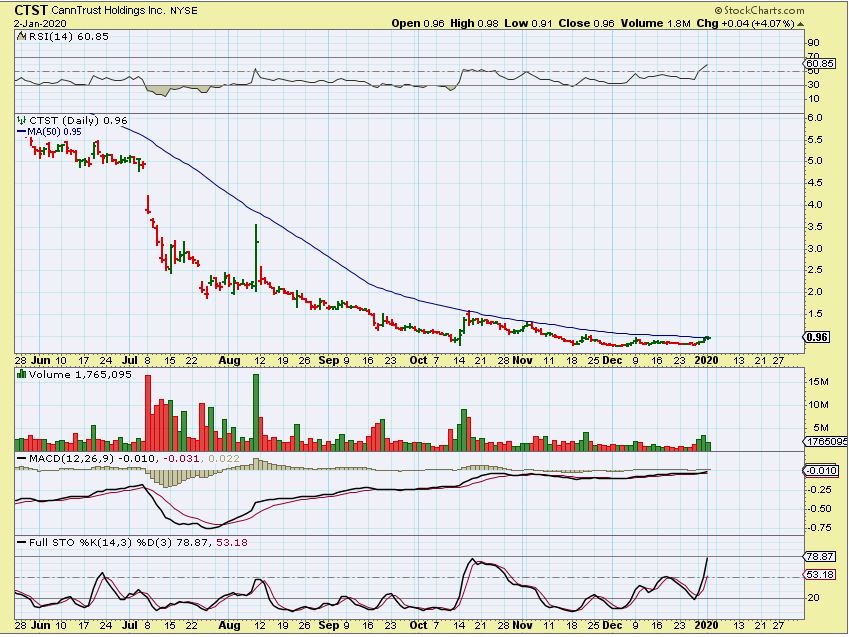
CTST – I discussed CTST yesterday too, at the 50sma. I like that base & RSI, so if it breaks out, one can control risk by starting small and adding on a break out.
.
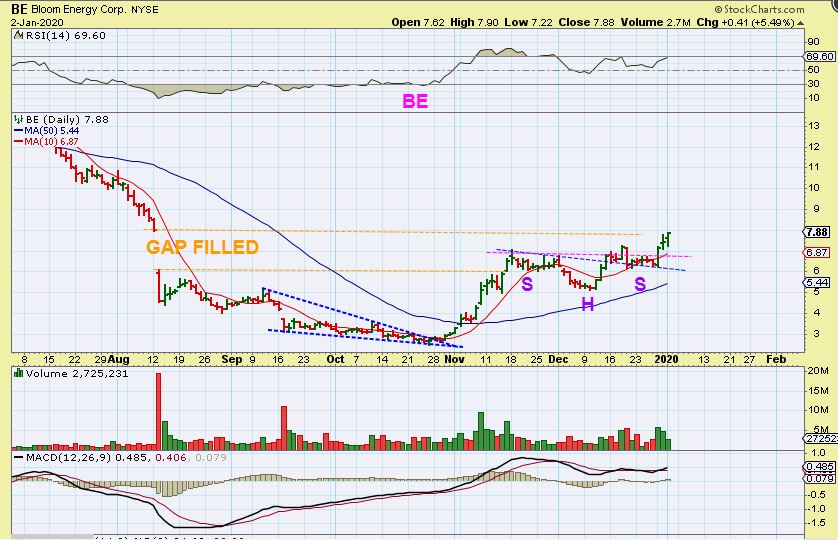
BE – BE sold off in the morning but closed up 5.5% again. I am getting slow progress with this one and that Gap finally filled, but I’d really like to see the volume grow & not continue to shrink as it runs higher.
.
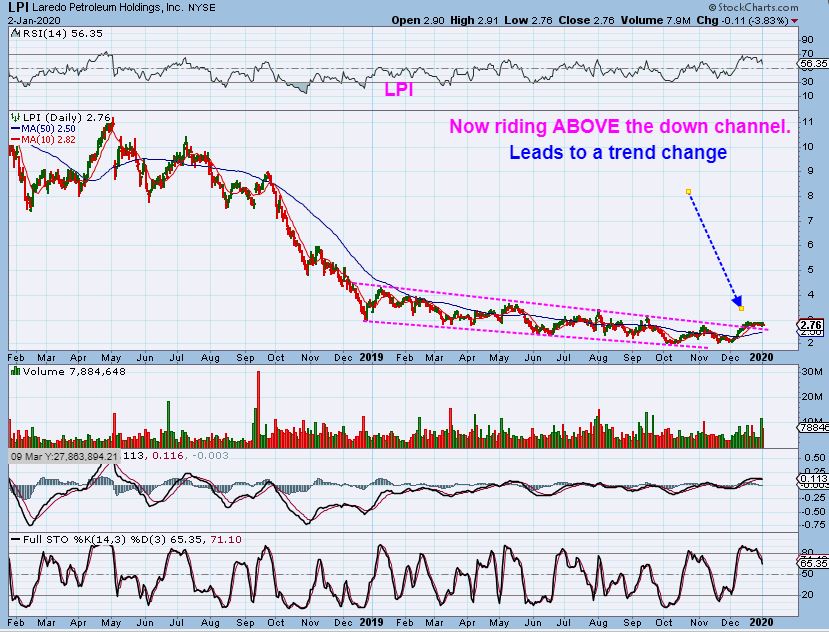
LPI – I am watching Oil stocks for a pull back, but they aren’t pulling back very much. I like what some like LPI are doing. It is a bullish crawl or bull flag above a down channel. If I wasn’t Very Heavily into Miners, I would have bought this. I like PUMP,TUSK, WTI, WLL, OAS, and others too.
.
I have discussed the recovery in the Chinese companies after a crash down during the Tariff wars.
.
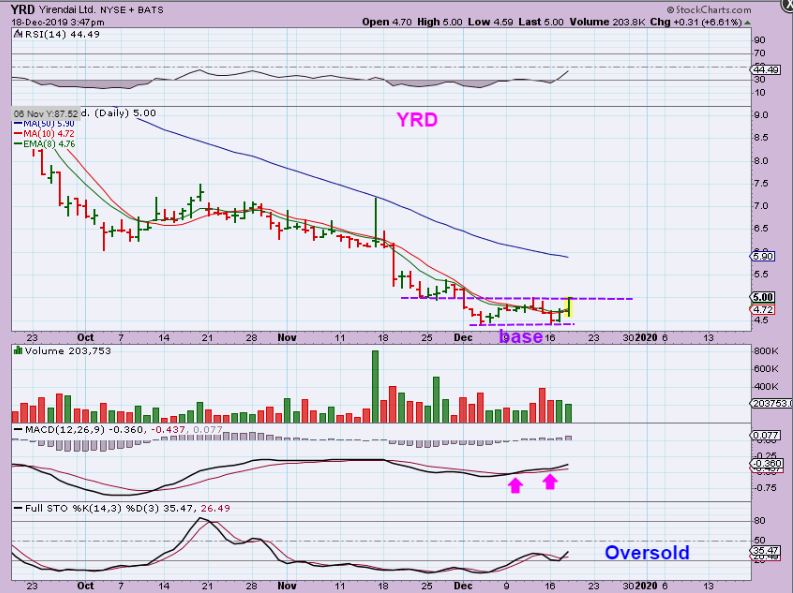
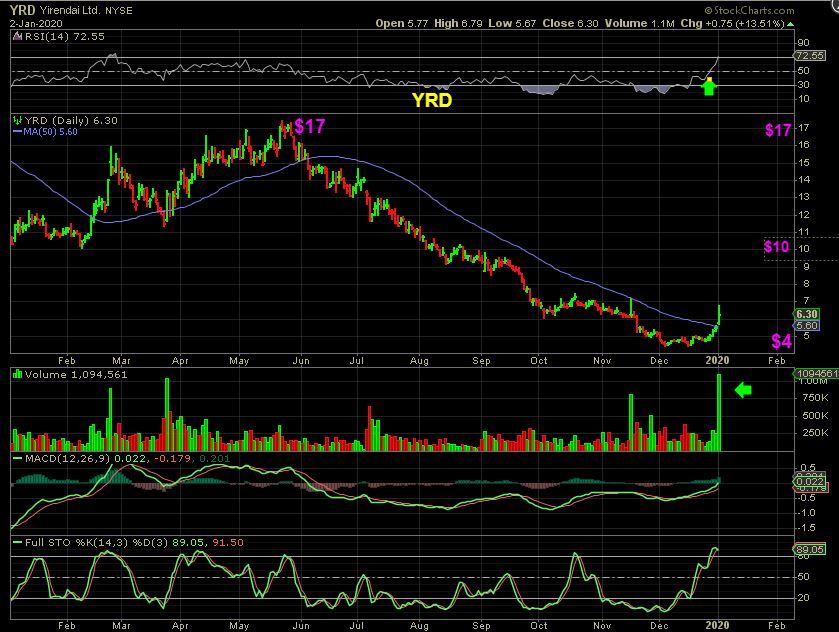
YRD – I posted YRD as a buy at $5 on December 18th as a low risk buy.
.
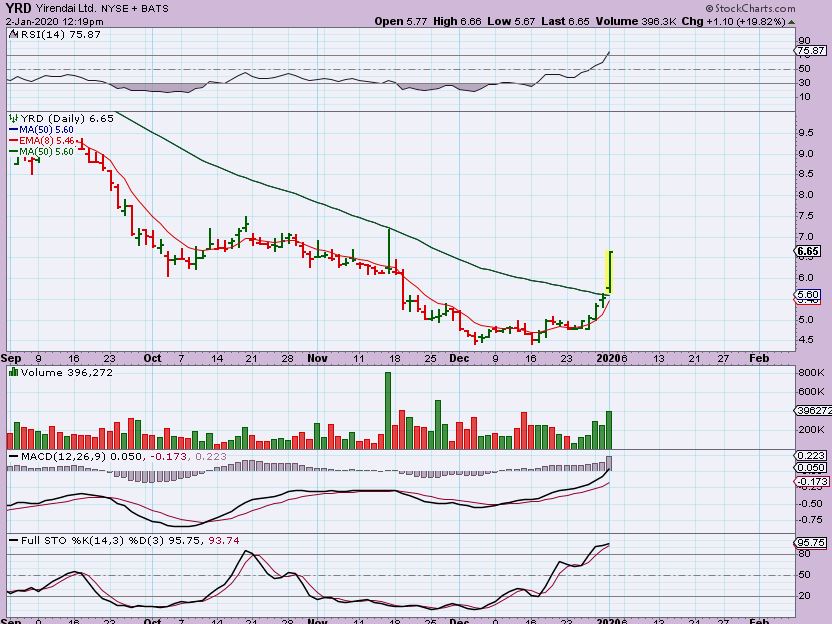
YRD -It ran to that 50sma & POPPED over it with strong volume, so I wanted to show the Bigger picture today…
.
YRD – It was formerly trading at $17 just 6 months ago. Volume closed out at record levels, so this may be in recovery mode. Hang on, it may get bumpy.
.
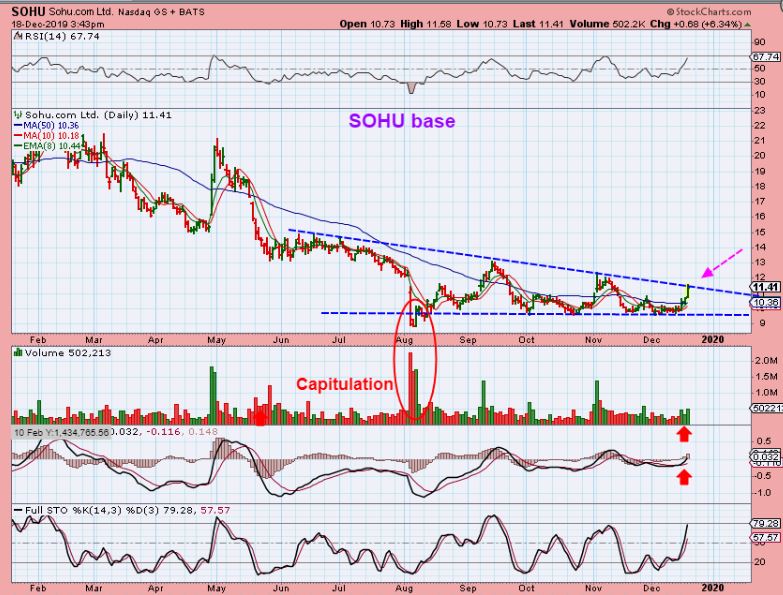
SOHU – While discussing this sector as bullish, I posted a SOHU Base with a capitulation low. This was a BUY at $10 & a break out is a good place to buy or add too.
.
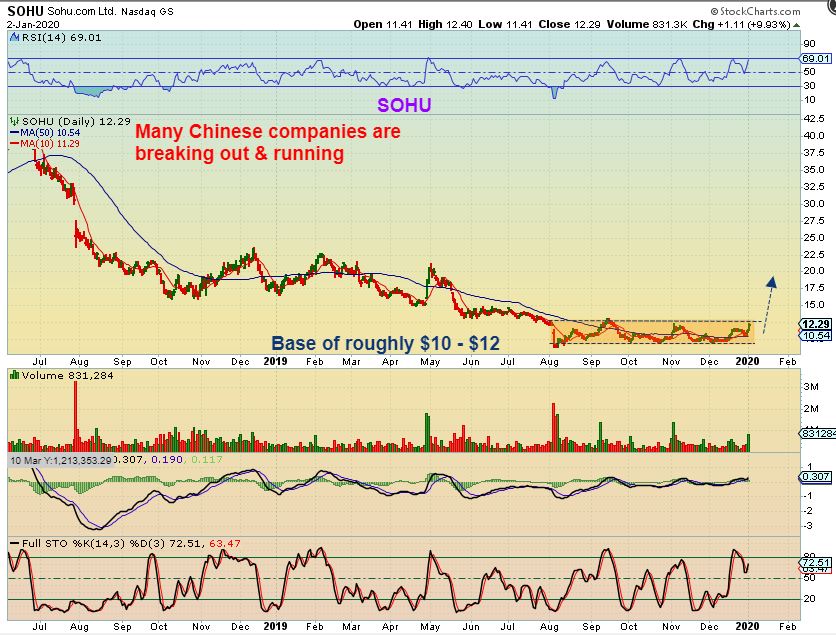
SOHU – It was up another 10% Thursday and the prior peak of that base has almost been reached. With volume coming in strong, this can run strongly if this sector remains bullish. Look at the potential here. It actually traded at $70 2 yrs ago, it now bottomed near $10. For this sector you can look at VIPS, JD, BIDU, YRD, HUYA, QD, CGA, and more.
.
In the General Markets I want to see how the markets trade once we get into 2020. I will discuss this in the weekend report further, but I see a few things that concern me ( Maybe only short term). There could be profit taking in January, but I am watching many stocks in this sector. I will post charts next week if things still appear to be moving higher .
.
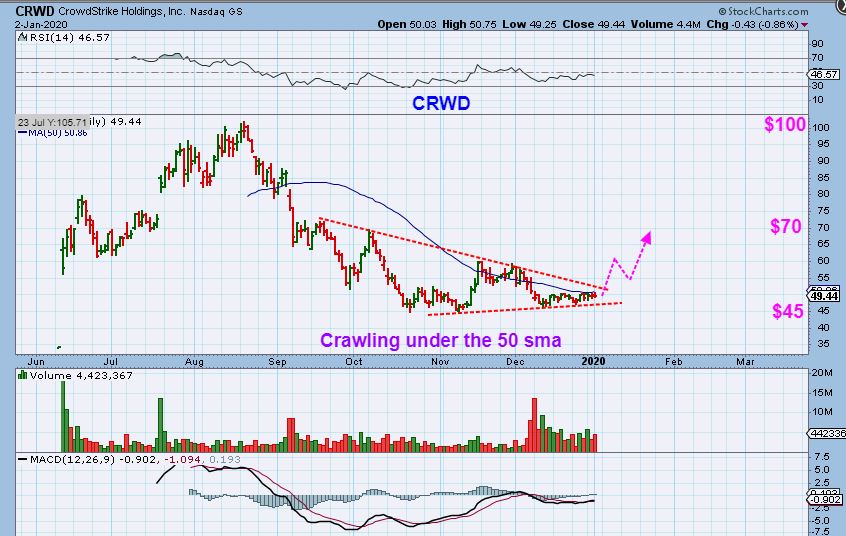
CRWD – Stocks like this catch my eye. Also BOX, SNAP, COUP, SQ, UBER, TWTR, SNAP, ETC
.
TGB – This is one that I said that I liked and bought on Dec 11. The base was tight.
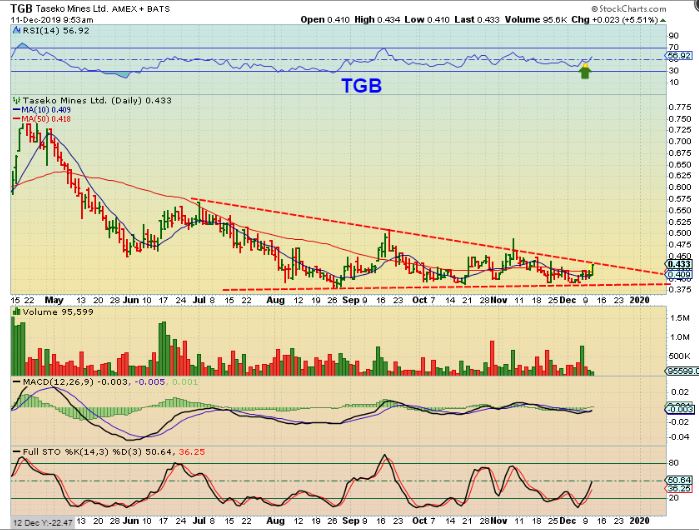
.
TGB – It broke out and stalled but started to push higher Thursday, and…
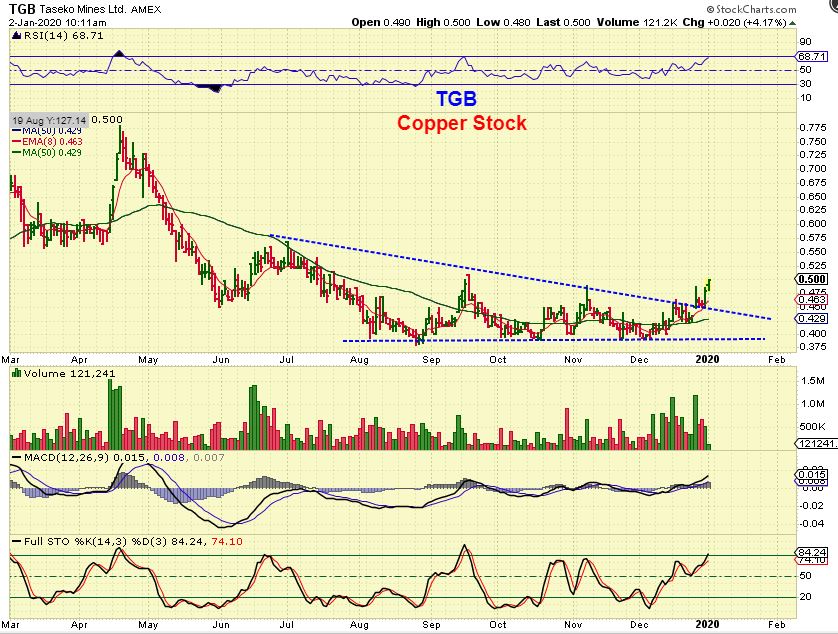
.
TGB – by the close it was up 10.5%. It got choppy after the break out, but patience pays off.
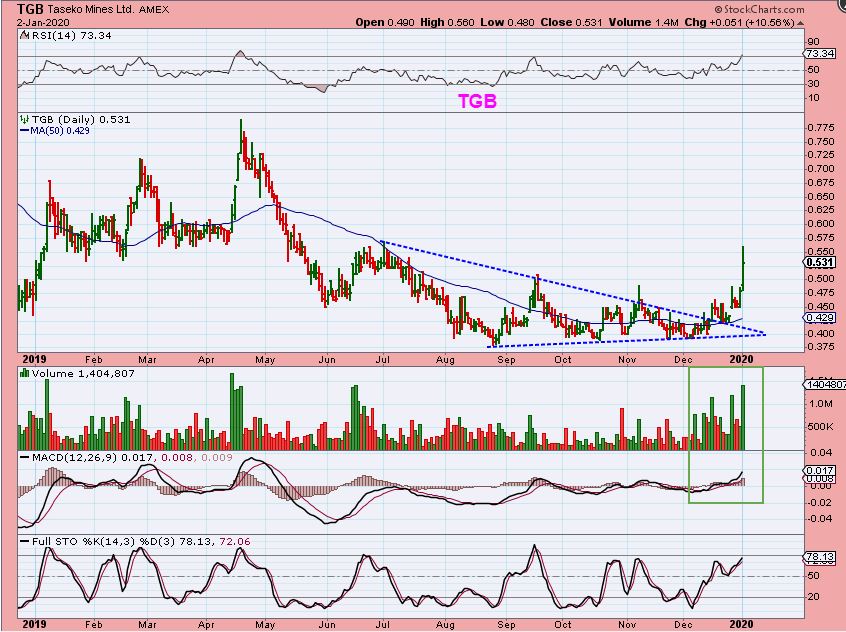
.
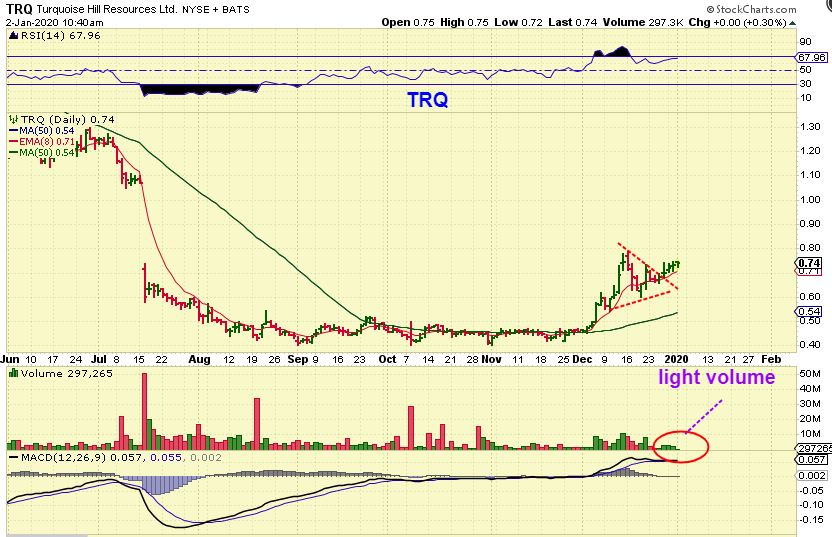
TRQ – TRQ was also a buy, but it is rising on light volume. If you are holding it- you want to see a good push of volume soon, or it may be running out of gas. This CAN suddenly surge higher with volume, I have seen that right as it breaks out.
.
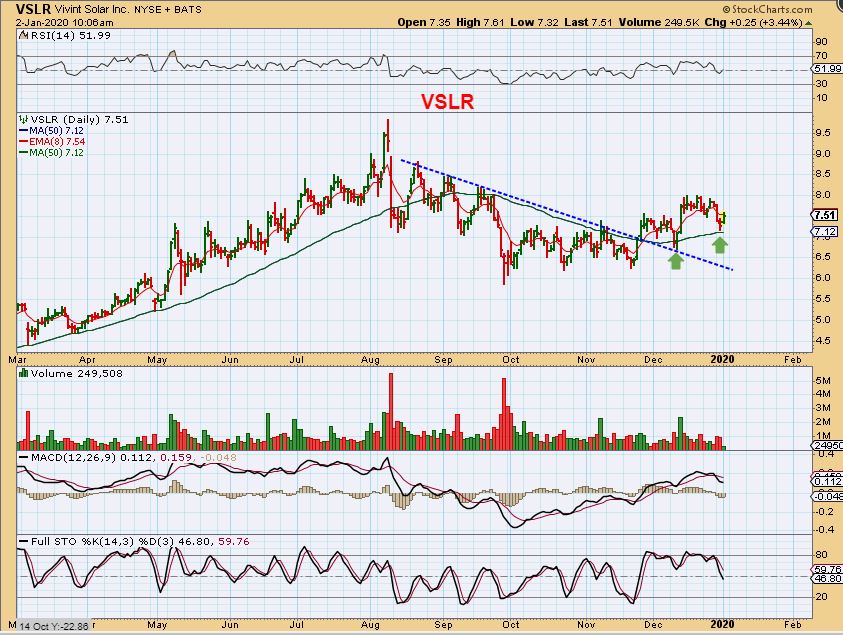
VSLR – Closed a bit higher than it was here after reversing off of the 50 sma. This is a buy again here at the 50sma, and I think it will form a cup and should get to $9.50 over time.
.
.
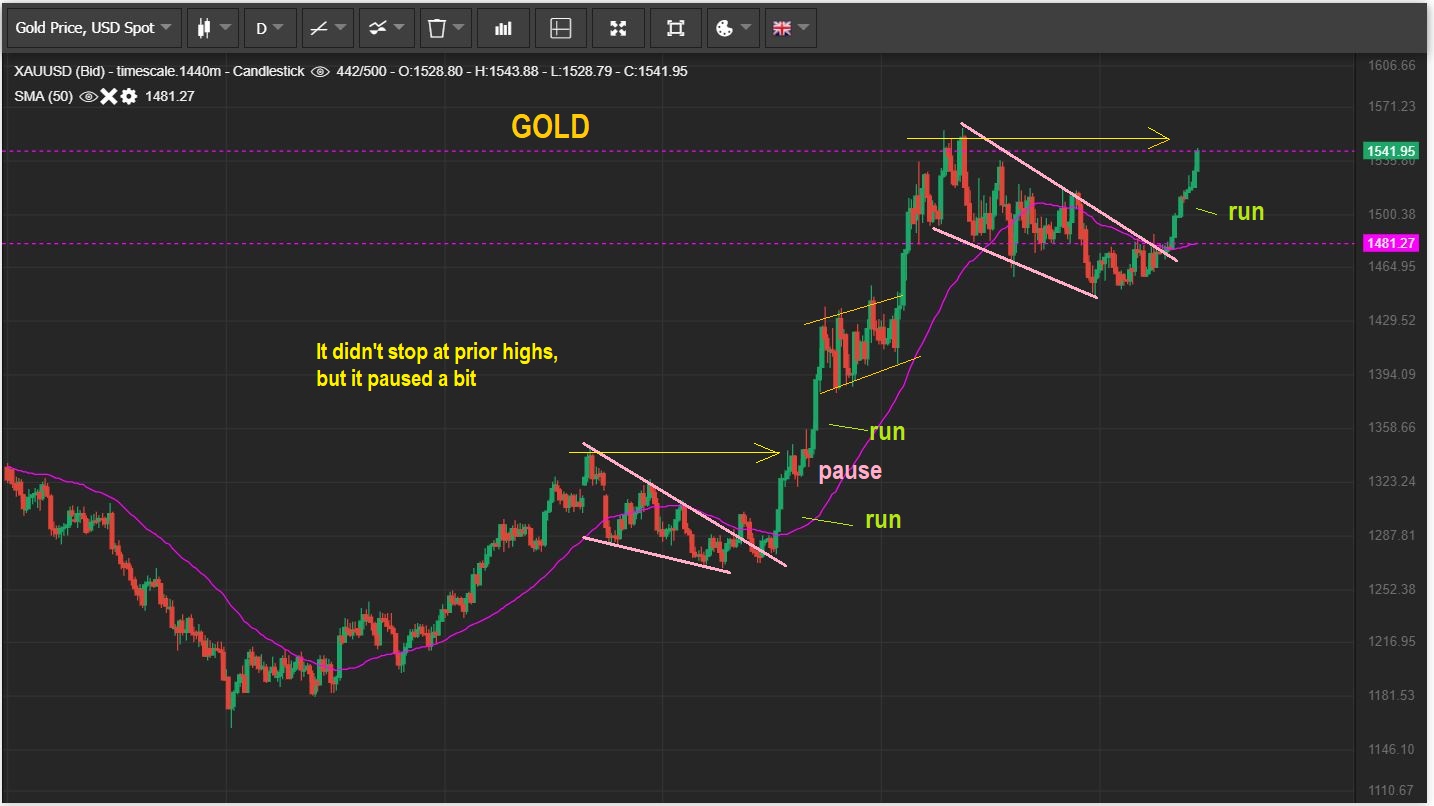
As I write at Midnight Thursday Eastern Time, Gold broke and finished the cup like formation that we have been watching. Notice what happens when I zoom out & we compare the run to the last move out of the ICL. It ran to prior highs with a straight shot. It paused, and then did another leg higher. COMPARE THIS CURRENT RUN TO THE LAST ONE. THEY ARE VERY SIMILAR.
.
Enjoy your Friday trading & your weekend!
.
~ALEX
EDIT: With this pop in Oil & Gold, Monet may start to flow more heavily into these sectors from the general markets too. This is something that I have been expecting for 2020 anyways, with the Big Picture Weekend Reports pointing out those Very Bullish set ups, but this may speed it up a bit. As for oil Stocks? The delay in Oil s pull back may mean that Surprises to the upside are now taking hold in the Oil sector too. Enjoy your Friday and Weekend!
.

