Friday Jan 18 – Options Expiration
Today is Friday, the last trading day of the week. It is also “Options Expiration,’ and that can affect pricing and volumes a bit, but so far things continue to play out pretty much as expected, so lets just get into our Friday report…
.
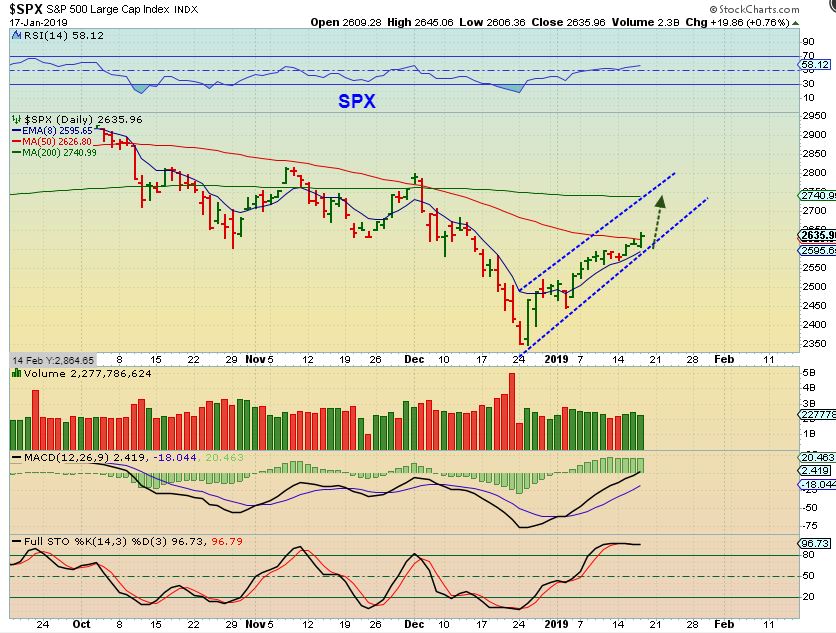
SPX – After about only 4 days sideways, The SPX , DJIA , NASDAQ , etc are slowly pushing above the 50sma. It does look like the SPX held the 8 ema, and wants higher price, so that may become the lower trend line. The 200 sma is the next likely target.
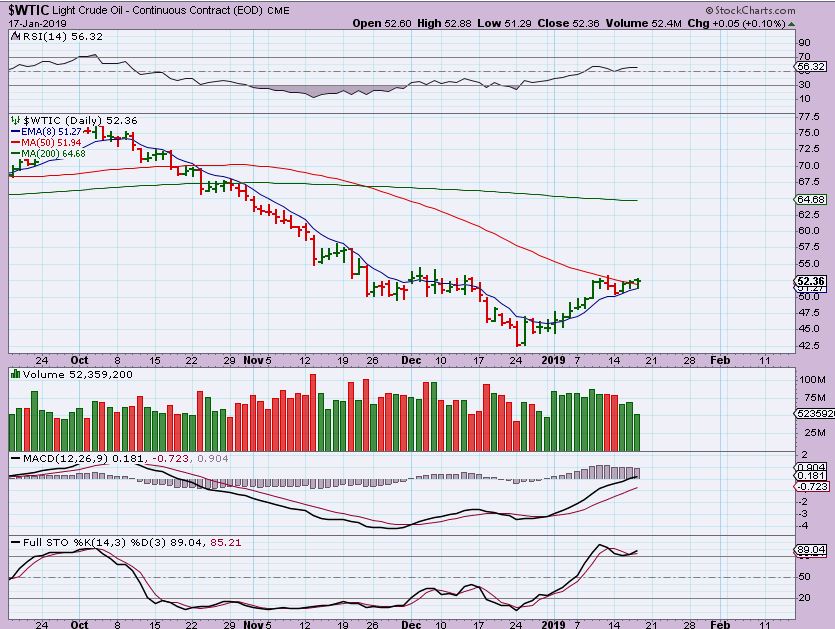
WTIC – Day 16 of what could be 40+ days of a daily cycle. Oil has lighter volume this week than the first push out of lows, but that may be that short covering was a part of the first push higher. So far Price does seem to want to push higher above the 50 sma too. I want to note that if Oil rises to the 200sma on lighter & lighter volume, I WILL BE EXPECTING A DROP to follow.
GOLD – I posted this in the comments, just showing how GOLD does not want to sell off, it has formed a triangle so far.
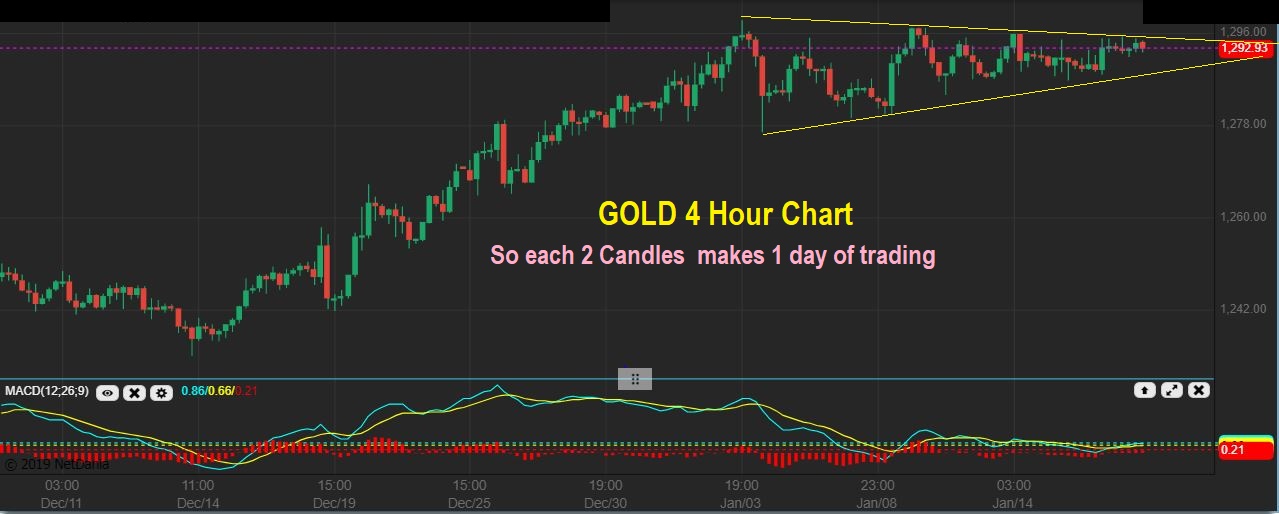
GOLD #1 – I have stated in the past that ‘TRIANGLES’ usually mess up daily cycle counts, so I just focus on what is in front of me. At this point, it is a Bull flag chewing away at consolidation on the far left ( May / June trading). I would have expected a back test of the 50 & 200sma, but so far it just wont sell down.
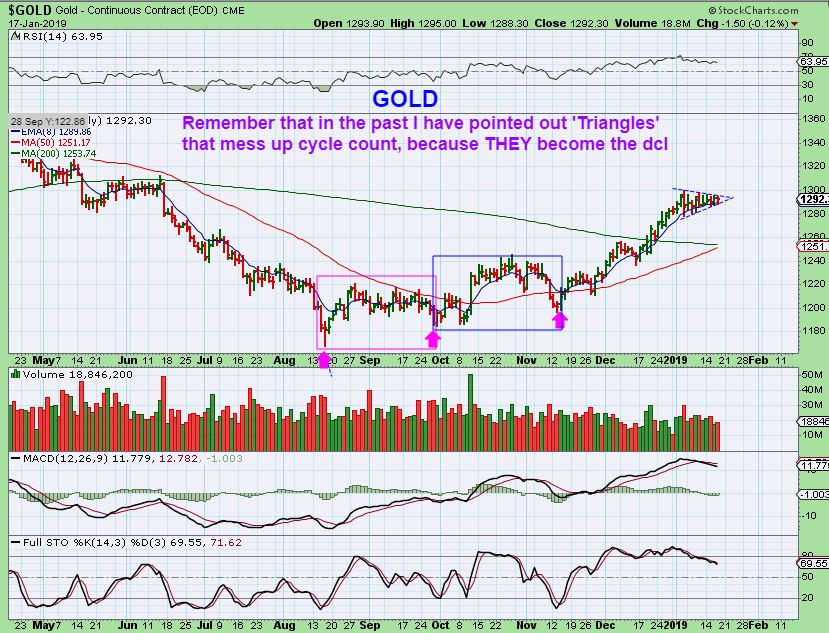
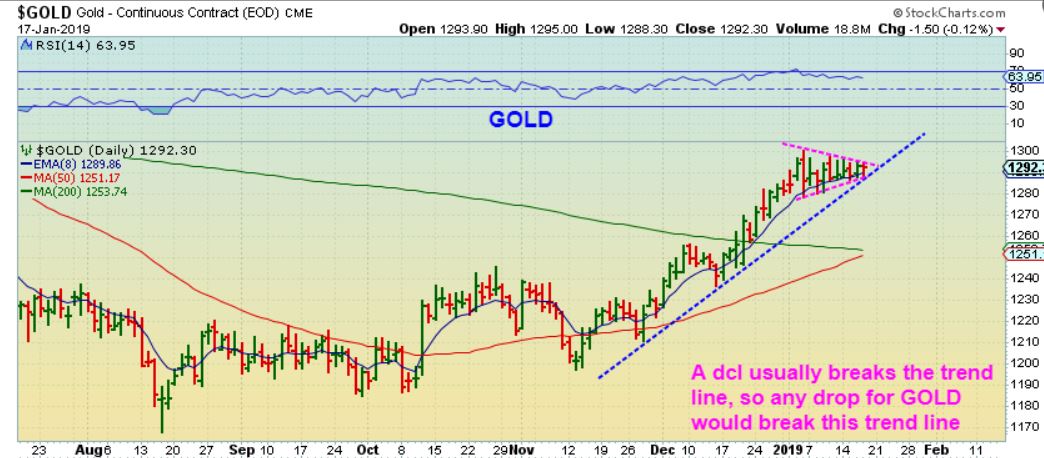
GOLD – We are in the APEX, so this has to break up or down now. Breaking down would break the blue trend line, and usually that is what we see as a dcl, so look for a break of the blue trend line, and a reversal higher may indicate a dcl. Honestly though, I ignore cycles when triangles form & Bullishness persists.
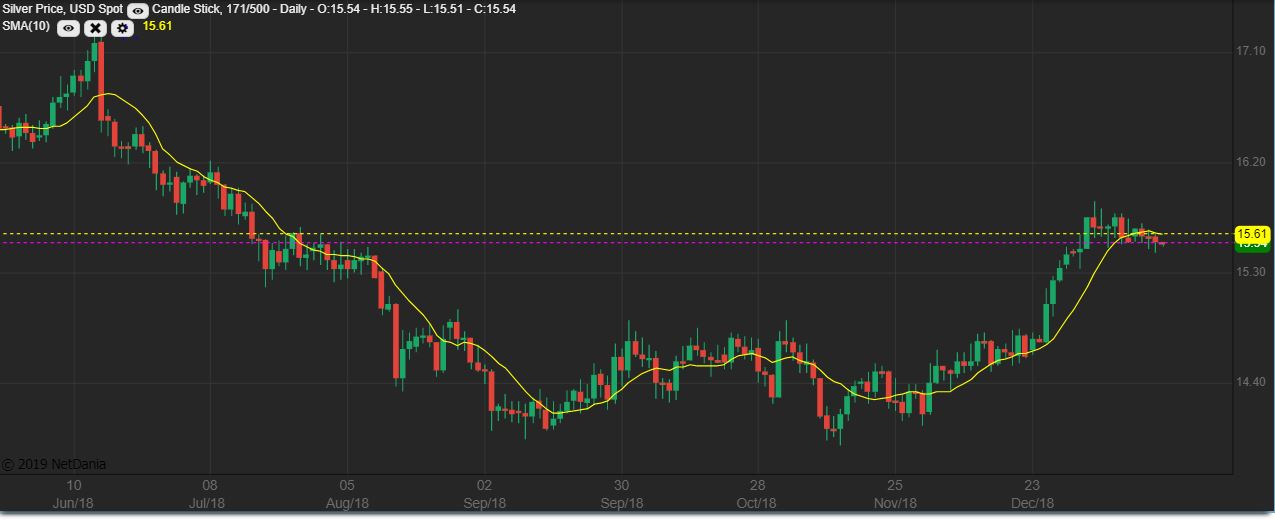
SILVER 10 sma – Silver broke below the 10 sma, but it also looks like a bull flag, so…
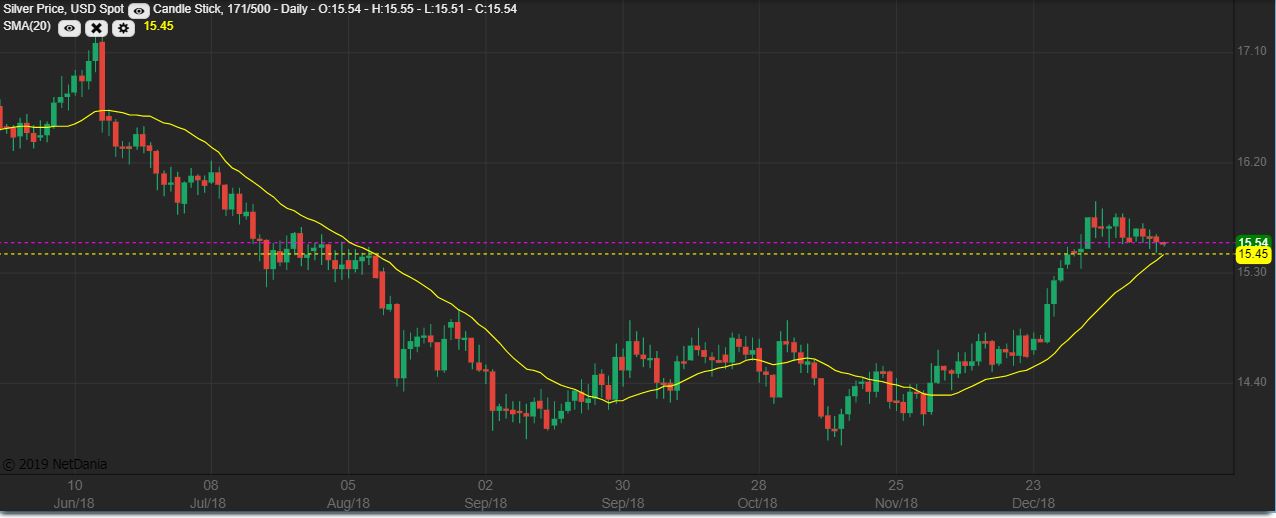
SILVER 20 sma – Let’s see if the 20 sma acts as support, price did not break the 20sma on the run higher in November.
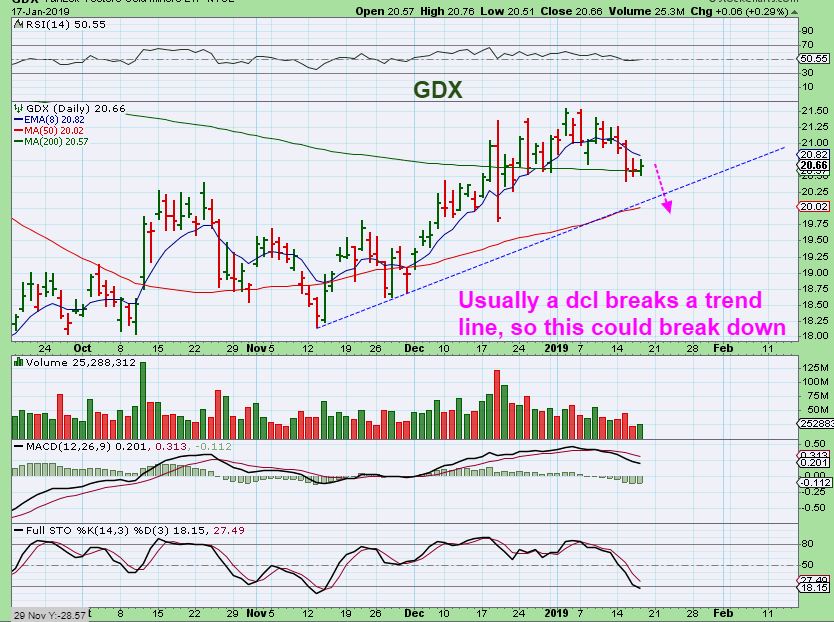
GDX – My current thoughts : I know that GDX held the 200 sma lately, but is it a mini bear flag? I think that this can drop to the 50sma. Notice – It is under the 10sma, the 10sma is curled down, and I would normally expect a break of the blue trend line. So I’m still watching for a tag or break of the 50sma. IF THIS BREAKS OUT HIGHER above the 10sma, you can simply ‘adjust to that’ and Buy it with a tighter stop under the 200sma, or a loose one under the 50sma. .
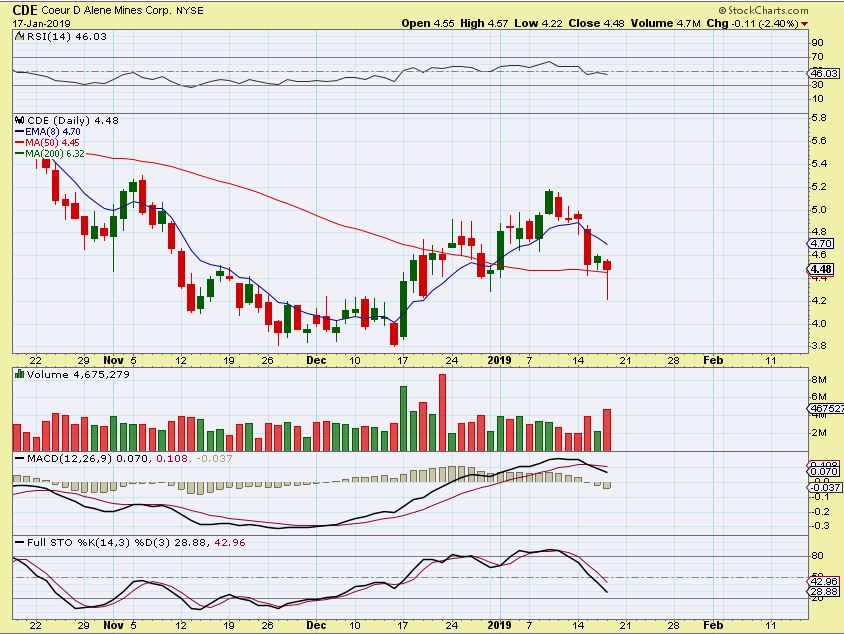
CDE – Many Silver stocks sold off and put in Reversals, and that looks quite bullish. CDE actually recaptured the 50sma, so I am ‘watching ‘ for lows, but I haven’t been overly excited about the action yet.
I want to discuss trades that we have already mentioned below, because some are playing out and there is still time to take advantage, even though it is Friday. The set ups look promising, so let’s take a look.
.
Enjoy your Friday trading!
.
~ALEX
.
Side Note: THE US STOCK MARKETS ARE CLOSED MONDAY. Most sectors are leaning more bullishly than bearishly, so I am not personally cutting positions back based on that. The 1 problem is that GOLD is the sector that could either
1. Break out of a bull flag & run higher Sunday through Tuesday while markets are closed, or
2. Gold could start to Pull back like the Miners have. this week.
So that sector is at a bit of a Tricky point, with Markets closed Monday
.
Trades: I mentioned that the ‘Metals’ set ups looked quite Bullish, and I really do like the set ups here , at this point.
.
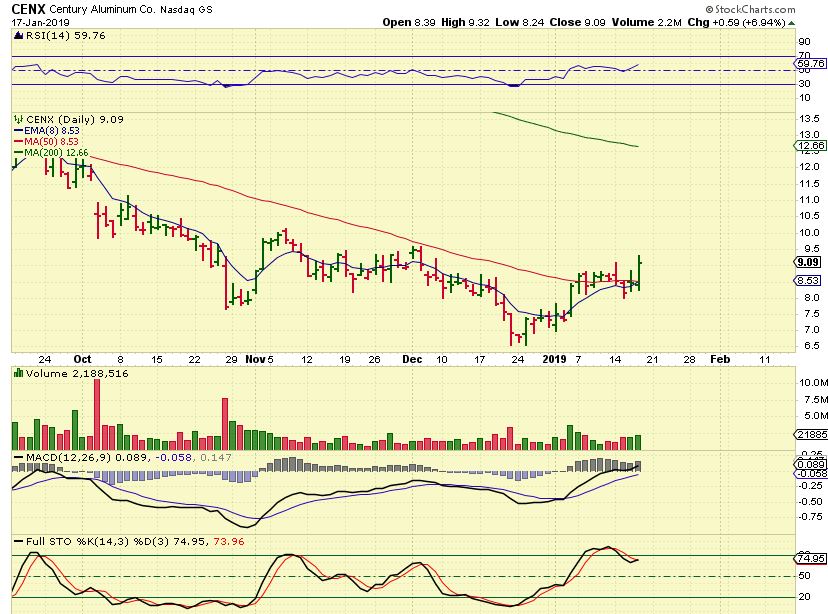
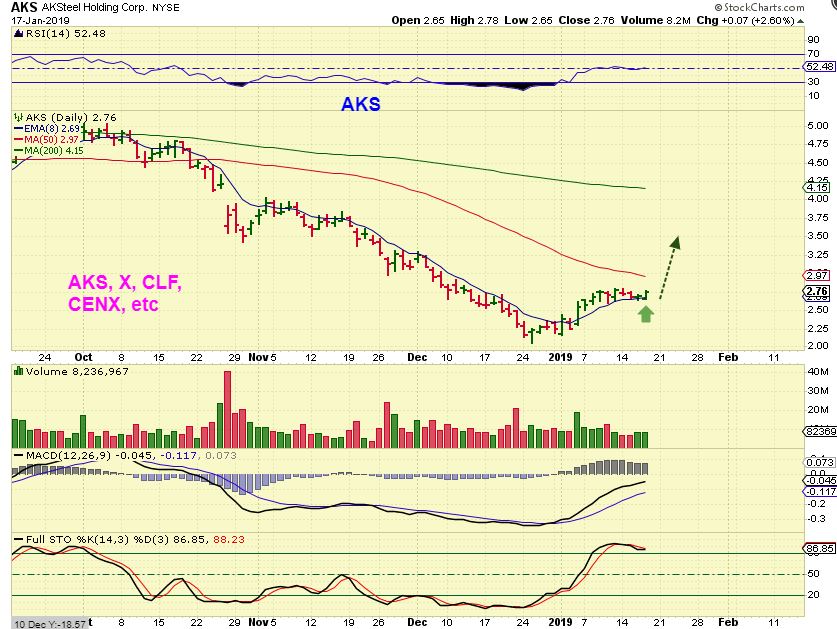
CENX – I love this set up, it got some follow through, and is safer using a stop under the 50sma.
ZEUS – And Olympic Steel also is gaining traction above the 50sma. This is encouraging news for the same set ups that we see in X, AKS, CLF, STLD, etc
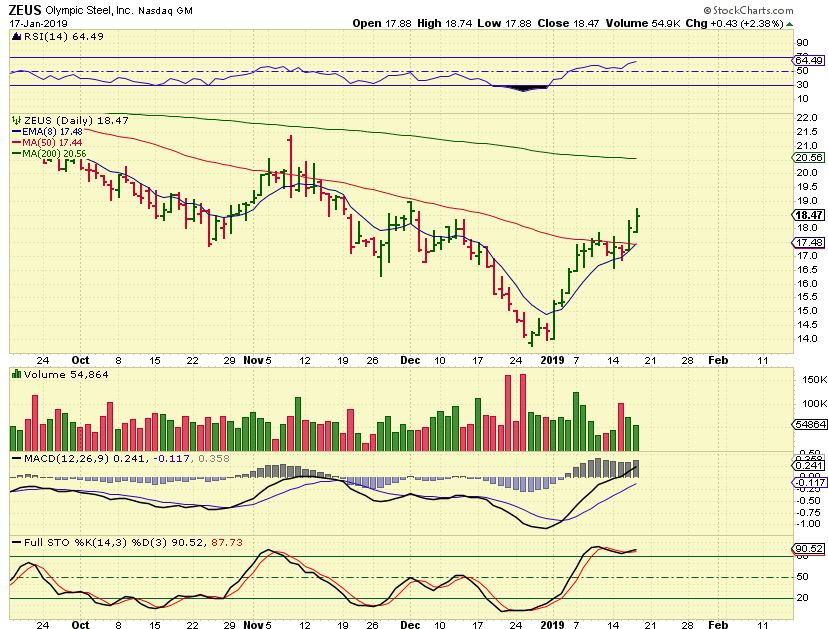
AKS – This looks like it may be next, and STLD & X look even a bit better. THESE ARE BUYS.
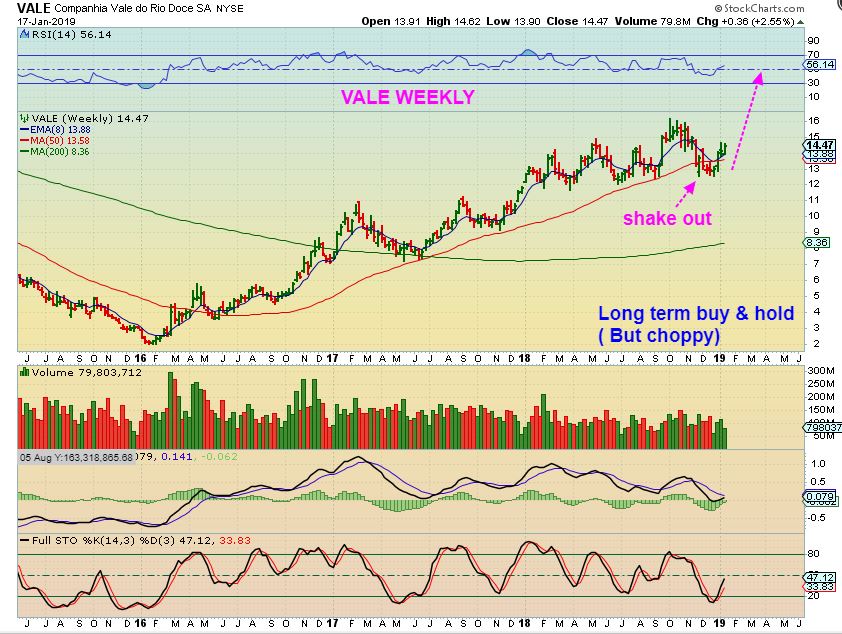
VALE WEEKLY – VALE broke higher too, but I wanted to show the weekly chart also.
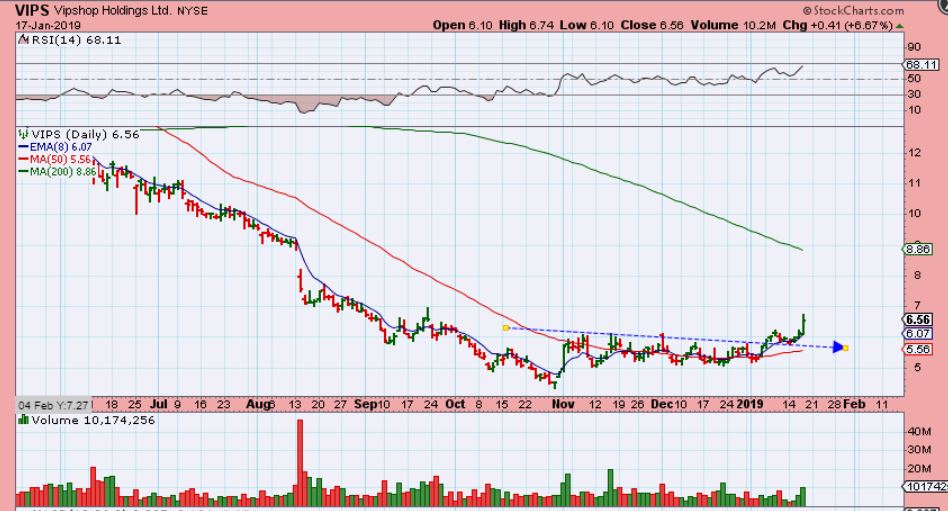
VIPS – This is a good base, and I have recommended it twice…
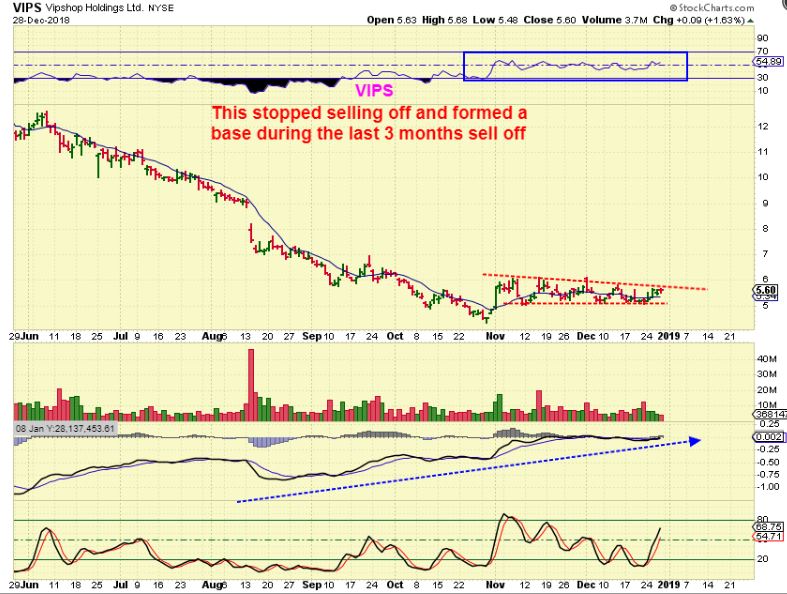
VIPS – Up almost 7%, I was asked, ” Should I sell the pop?” . I say no. It MIGHT flag or dip on Friday, but I see higher price for this one. I would keep riding it. This is similar to the VHI trade.
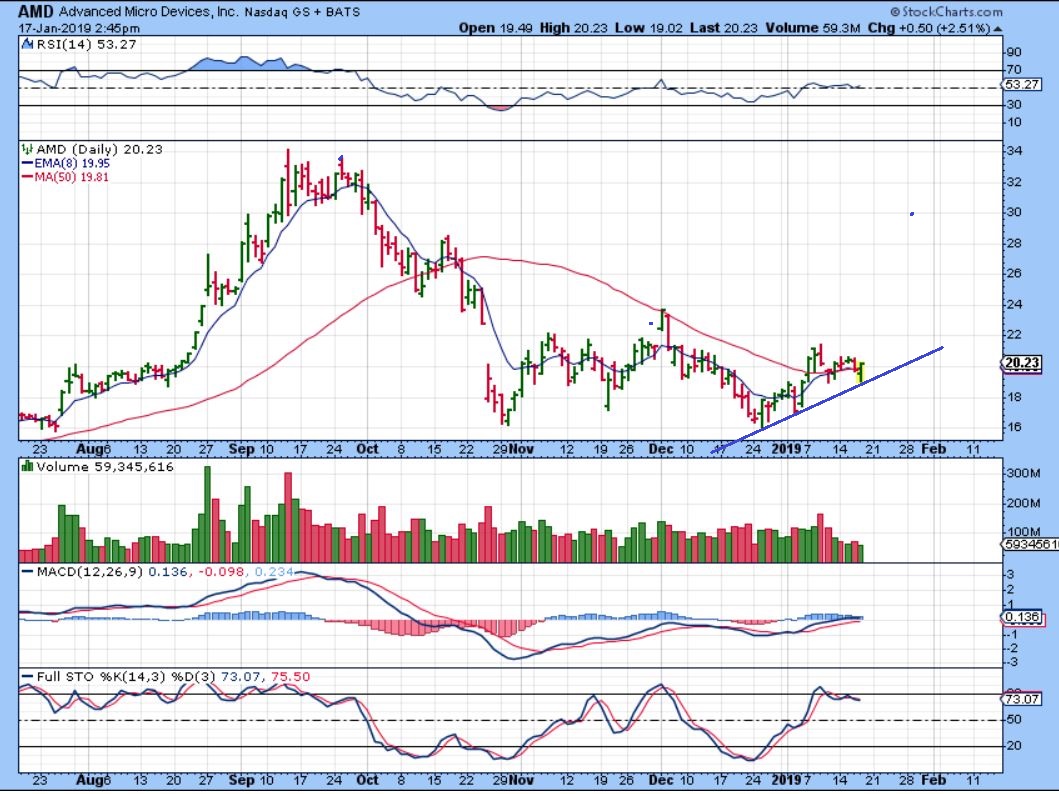
AMD – I posted this as a buy an hour before the close in the comments. I like the reversal and AMD looks like a buy with this reversal.
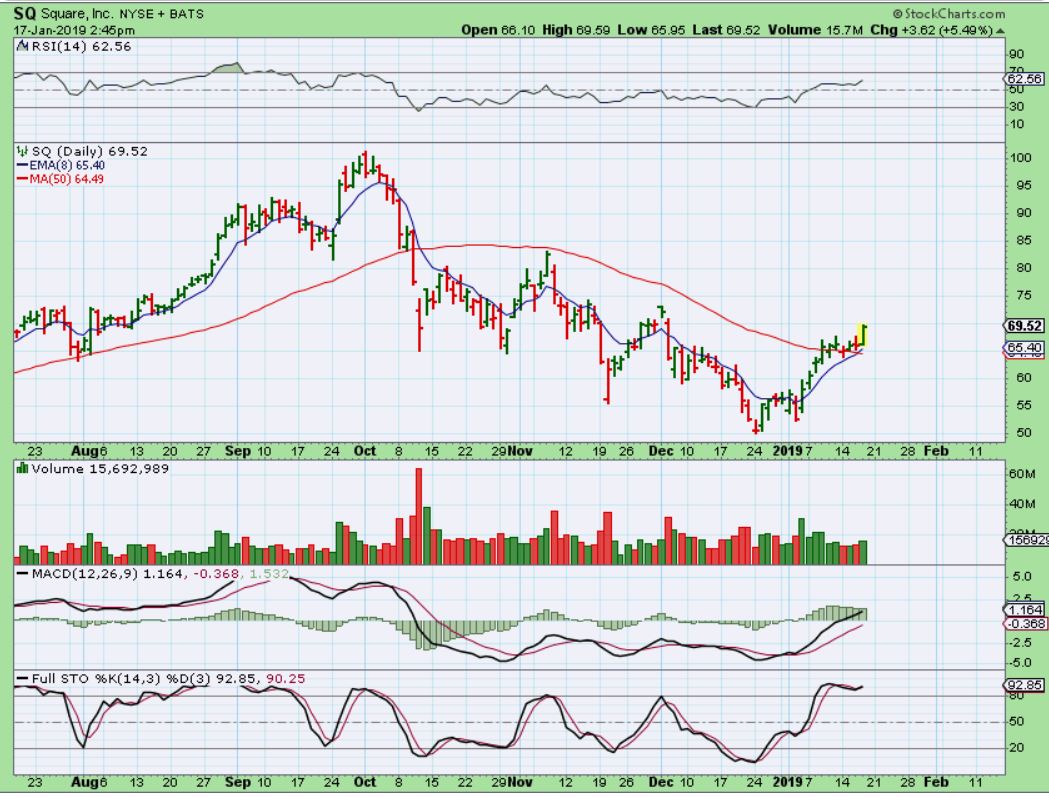
SQ – This looks great too right? Good news, it closed a bit lower at $68.84, and is above Both the 50 & 200 sma. THIS IS A Buy too, in my opinion, with a stop under support.
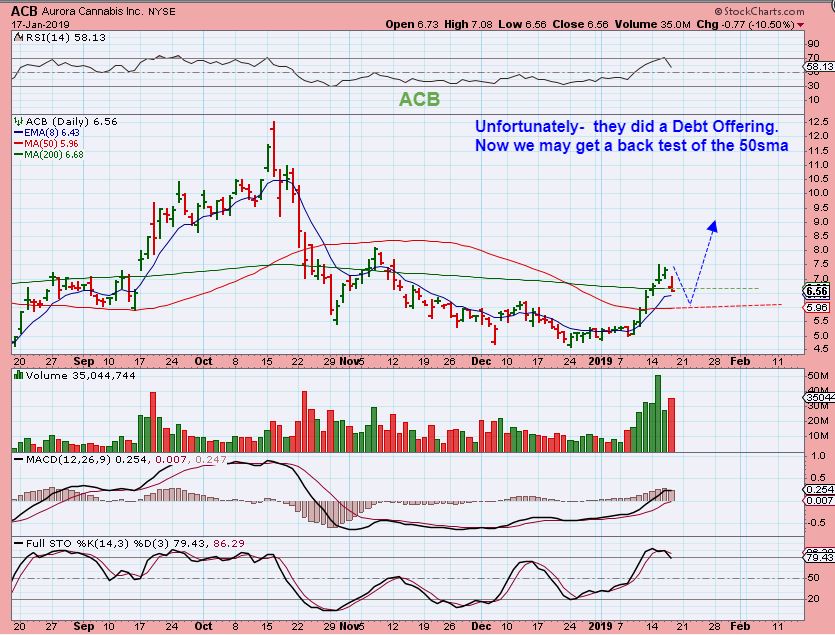
ACB – ACB, unfortunately , came out with a notice of a Debt Sales Offering, so it dropped a bit , bounced, and then sold off into the close. It isn’t long term bearish, it is a bullish company, but I feel that ACB could drop to back test the 50sma as a result of that news . That said, I sold some yesterday on the bounce, and mentioned that in the comments live. I still own some, I like the company and may add again if I like what I see later.
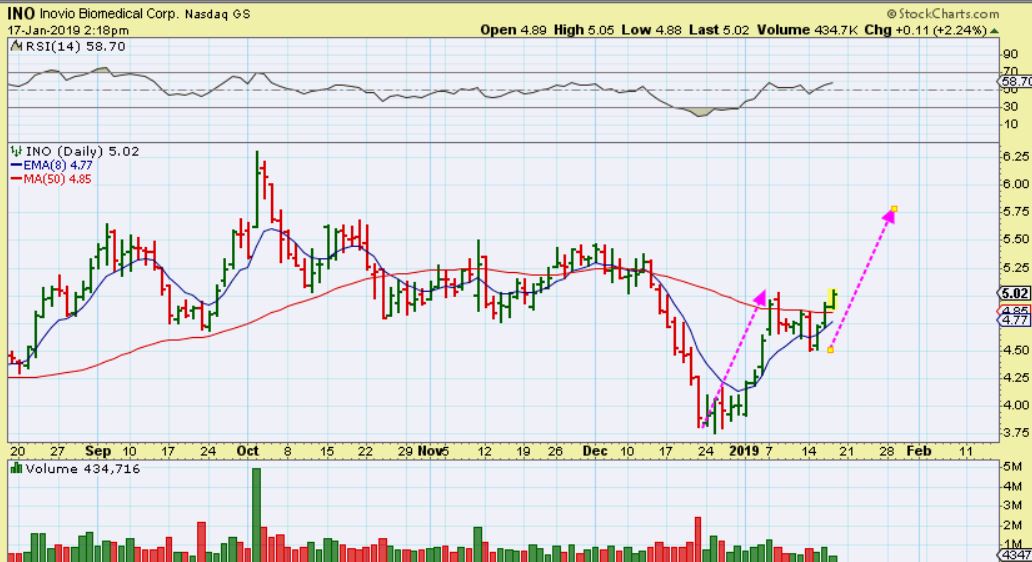
INO – This is also a buy. I mentioned it pushing above the 50sma and now it has some follow through. It is Biotech / pharma & they can be news driven (FDA news or ‘test results’ ) , so use a stop.
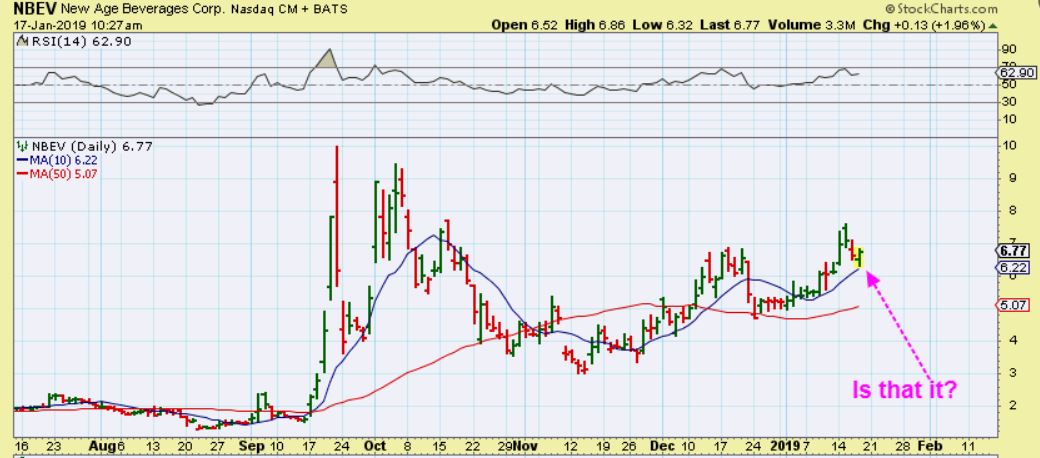
NBEV – I posted this in the morning, and NBEV traded all over the place yesterday. THIS may be support that now holds going forward, I will look for follow through. I own NBEV.
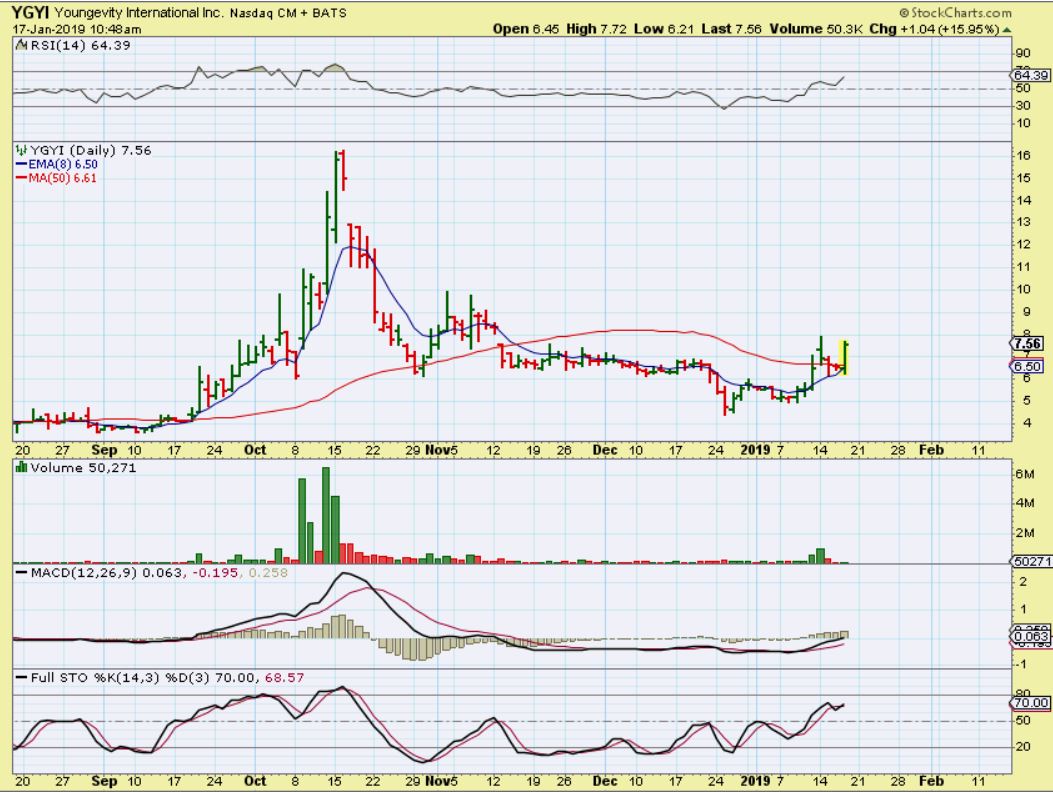
YGYI #1 – I loved this at the first hr of trading & posted in the comments, but unfortunately it didn’t last. YGYI did close above the 8 ema though, and I have owned YGYI for a couple of days, so lets go to a chart of the close .
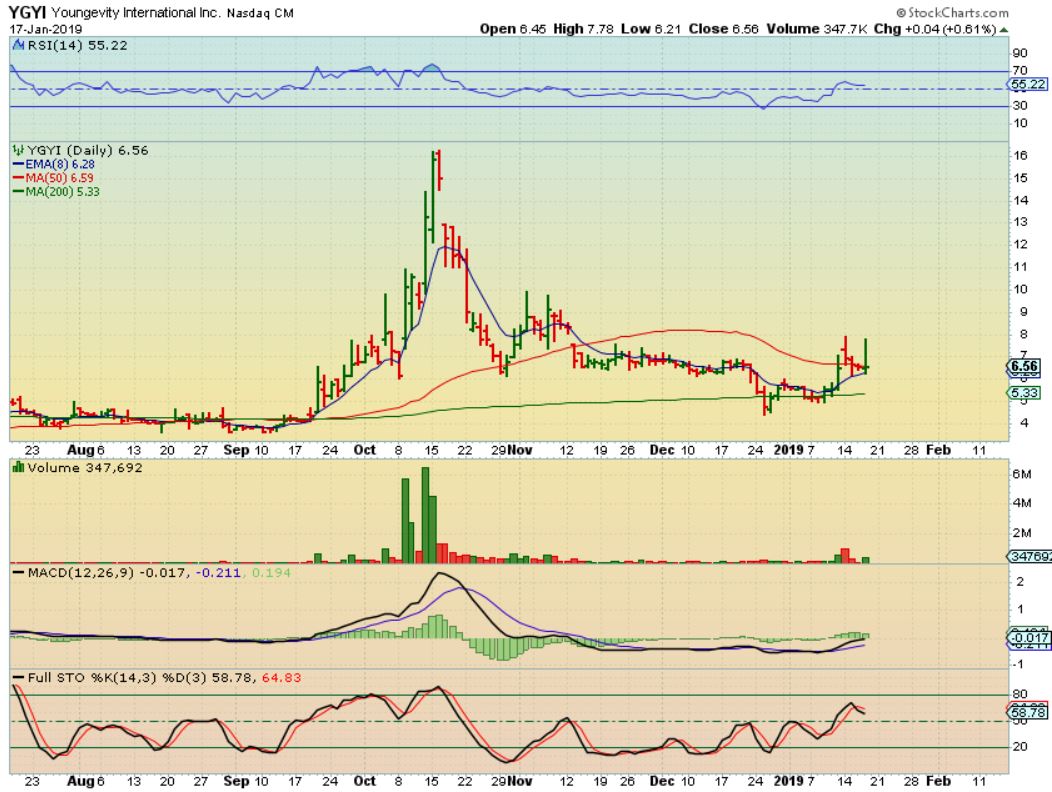
YGYI at the close: Can it tag the 200sma green line? Yes, but I am not expecting it to. I would watch and see if that 8 ema holds as support and price starts higher. I have warned that THIS is a tough Buy & hold. I have traded this a few times, and it has never once been easy, but I have made good money ignoring it and having patience.
BY REQUEST:
.
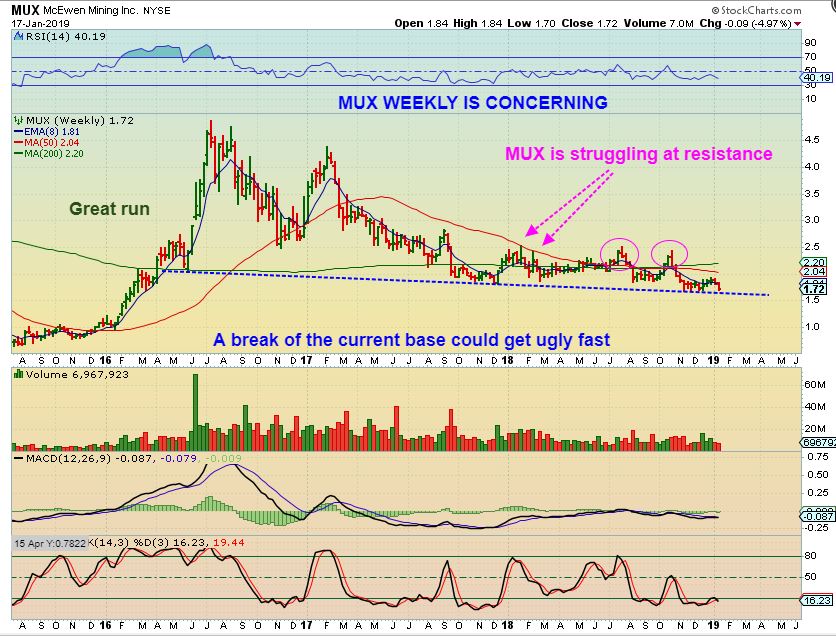
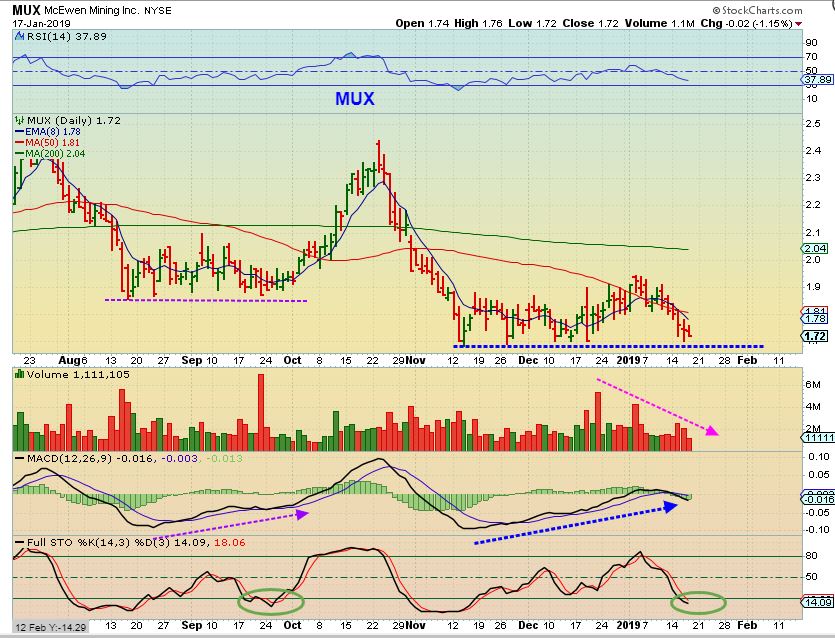
MUX – Yes, it has had some troubles getting off the bottom here, and has given up the 50sma repeatedly, obviously not good. If one took a buy & hold approach, it is disappointing being back at the lows, but the MACD is rising, divergence is bullish, and selling volume does appear to be easing up. If BAD NEWS comes out (watch for earnings) this could break down, so I don’t want to give false hopes that everything is going to be o.k., but currently it looks like this is in a base, and may try to break that 50sma higher again on the next run. October was a good run, but since October, the 8 ema held it own and this base is the next chance at firming up. HOWEVER, another thing to consider…
MUX WEEKLY – Read this chart for the sobering truth if this lower line gives way. We have seen 2 false or ‘failed’ break outs above both the 50 & 200 weekly ma (circles). Mux is almost near 3 yr lows. I would say that this base needs to hold, or the drop could get serious. With Gold due to move higher, I would expect it to hold up, but so far Gold HAS been Bullish and MUX cannot break out higher.