Friday Jan 11th
Today is Friday, the last day of trading for the week. It really has been a great couple of weeks of trading , so let’s discuss a few things…
.
This was in yesterdays report…
.
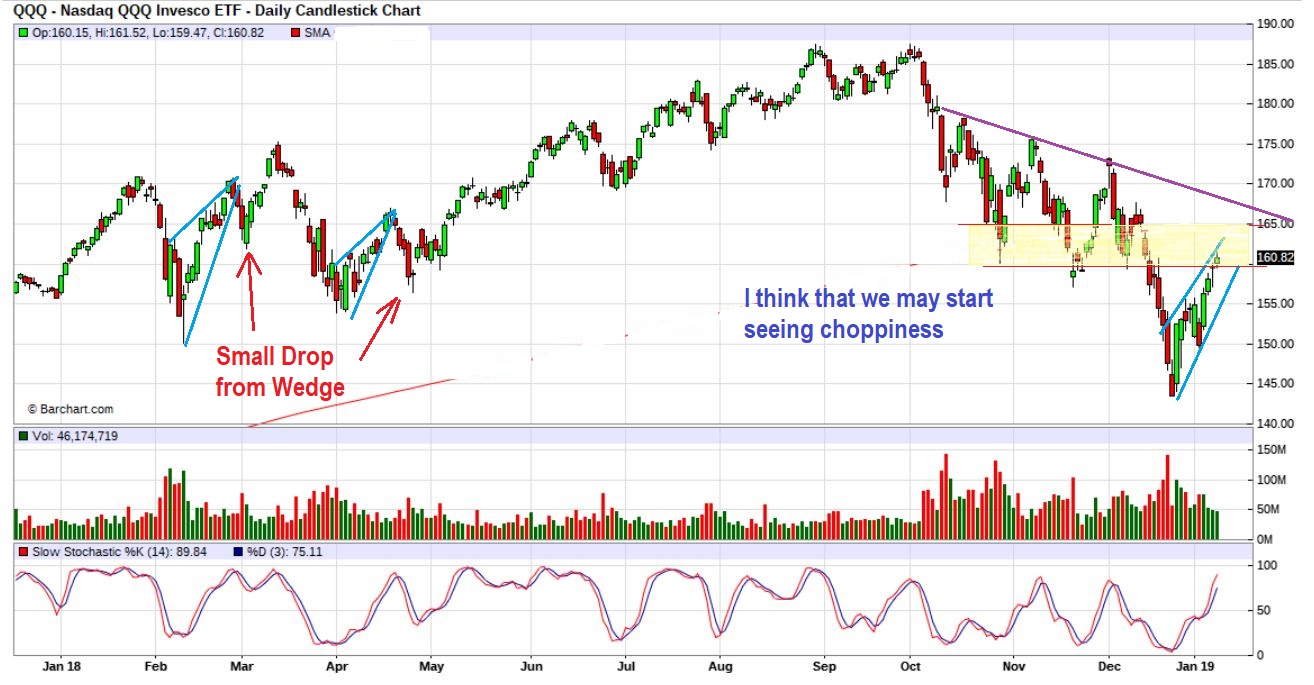
QQQ – I am also starting to see what look like rising wedges in The Nasdaq. This can push higher, but keep an eye on it. These can be short term bearish, and often break down, an example of this was seen last February and April.
QQQ – The QQQ tagged the 50ssma and the wedge remains in view. Read the chart.
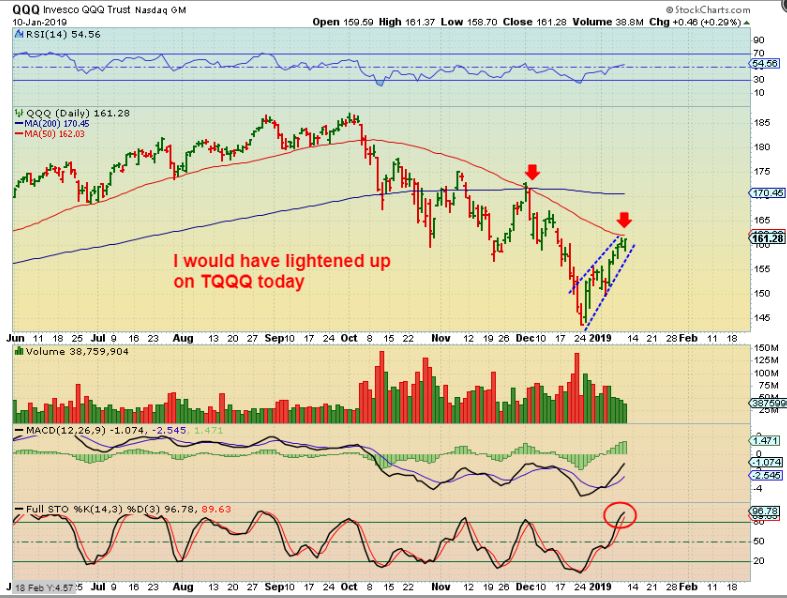
I do not expect another massive sell off to start HERE, I expect something choppy, but I think I would have closed my leverage ( or partial) and watched from the sidelines.
.
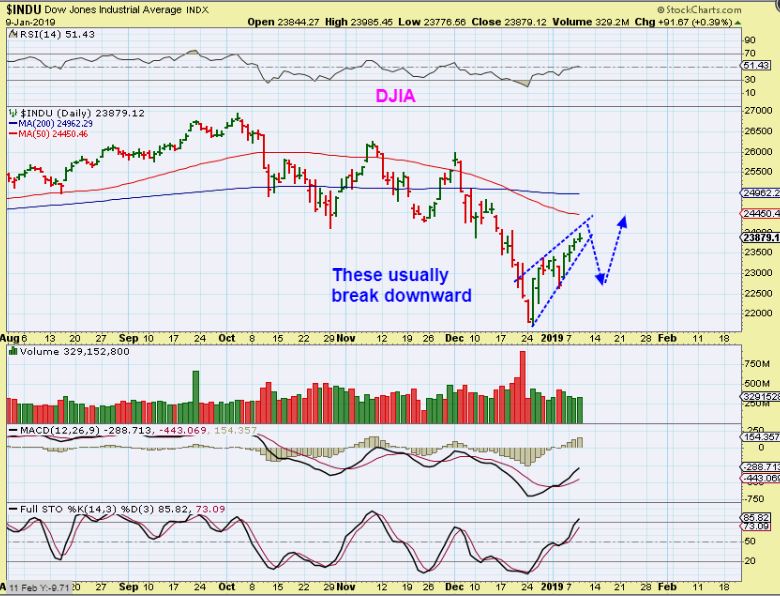
YESTERDAYS REPORT HAD THIS DJIA – Approaching the 50 sma, this really looks like the run is almost ready to drop for a bit. I almost always see these rising wedges break down.
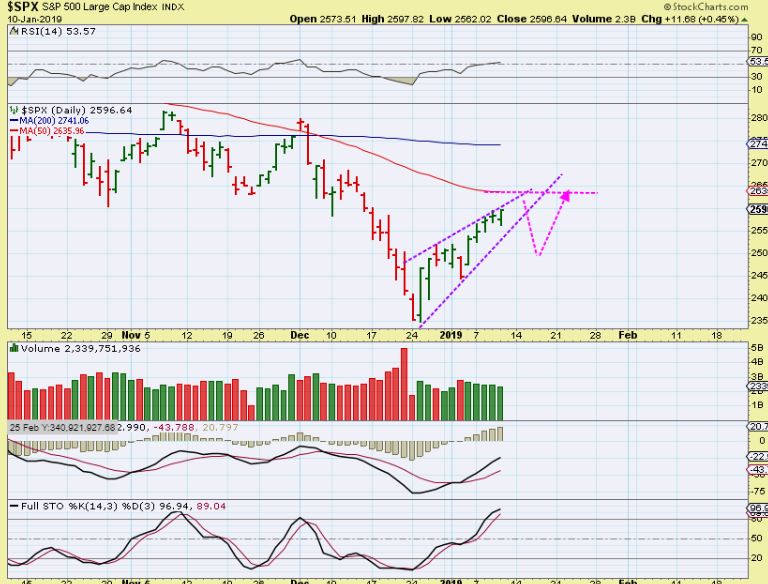
SPX CLOSE UP – Not quite at the APEX or 50 sma, it can move a bit higher.
WTIC – Oil is hitting a resistance area too. The 50 sma ( at $53.26) and a prior small congestion zone. If you look at the MJ Stocks ( and we will in this report ), you’ll see that there are times when Price can just break through resistance and continue to the next level. With this kind of volume, Oil may be able to break through, or just pause and bull flag before continuing higher. 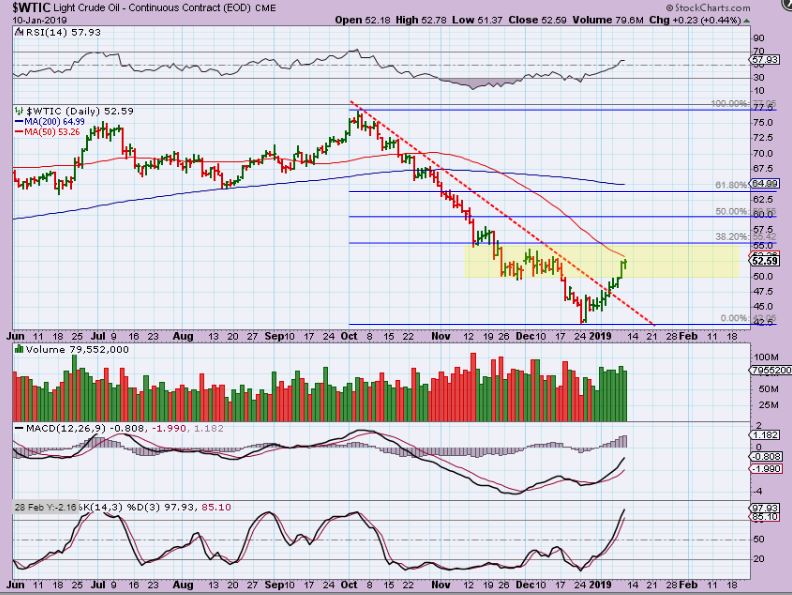
Note: Most here know that ‘Taking some profit’ is the way that I play a move off of the lows. I go in heavy at an ICL, especially the kind of Strong reversal candle that we had with a stop below. As price rises to resistance, I lock in some gains. If things continue to play out bullishly, I then might watch the pull back and add again ( say it just Bull Flags or lands on the 10 sma and reverses etc). How you play this going forward is up to you, and will probably be based on how it acts.
GOLD – IN YESTERDAYS REPORT
.
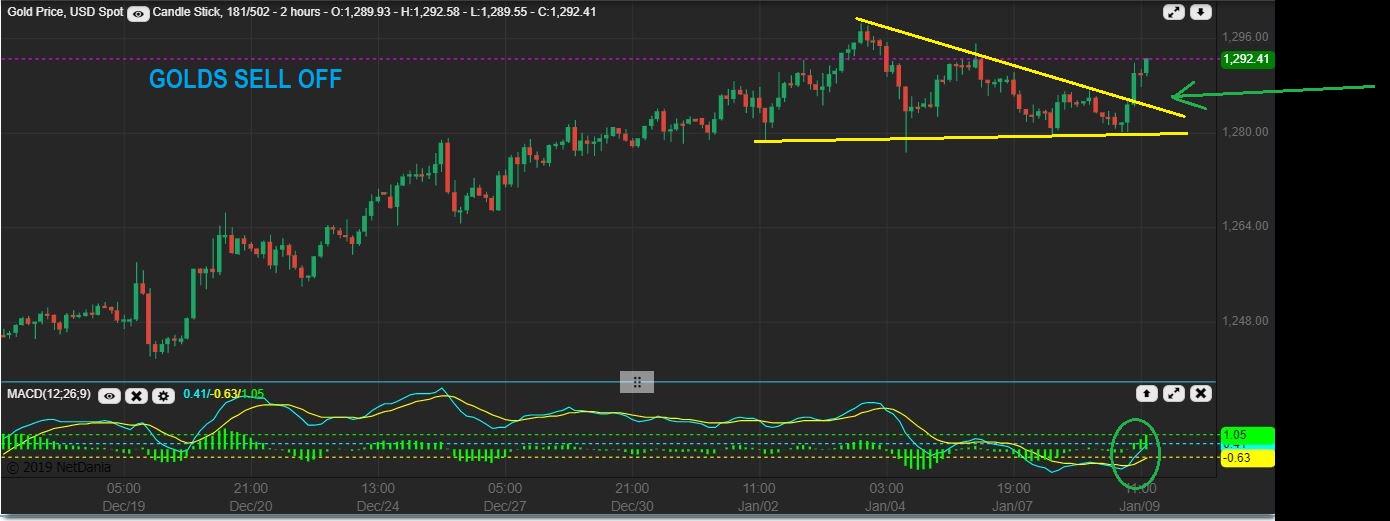
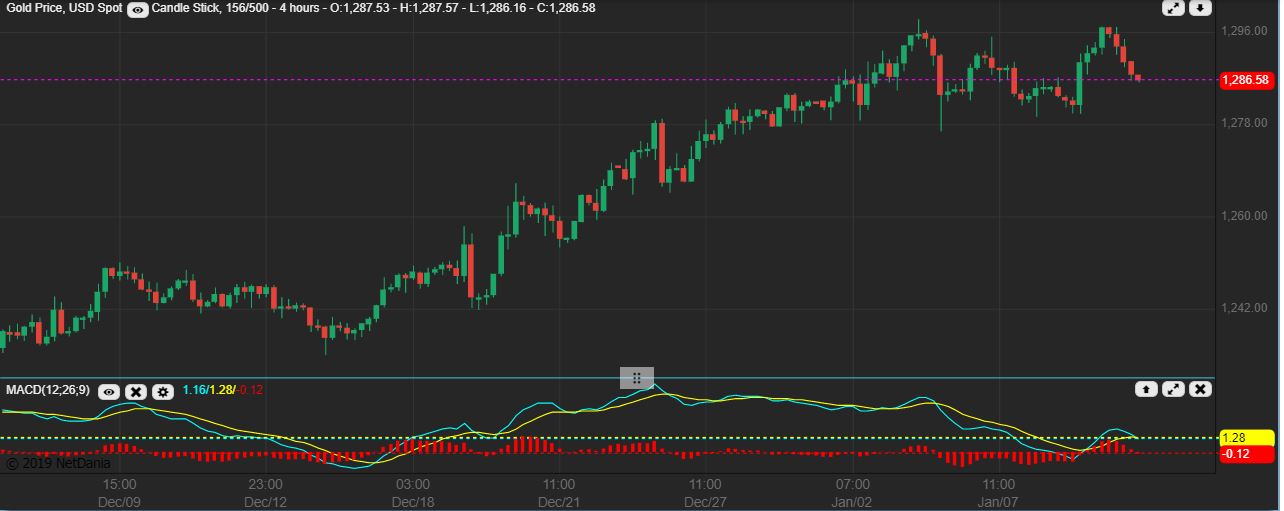
GOLD INTRADAY BULLISHNESS – Gold was down pretty good in the morning, but again, golds sell off forms a bullish wedge and was bought back up. I posted this live shot in the comments to show that Gold is still “Surprises to the upside“! Don’t even think about shorting the yellow metal lately. This pattern looks like Gold wants to run back to the highs.
GOLD – It ran to the highs and started to sell off.
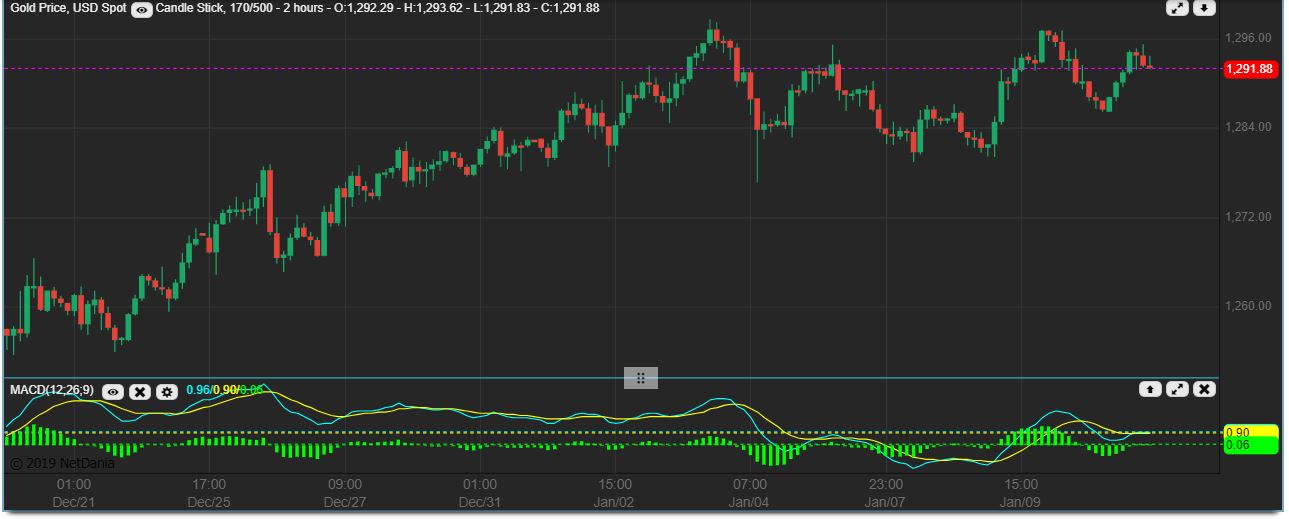
GOLD – As I write at night, Gold is moving higher again. Though this sector is overdue for a pull back, I have stated that at this point, Gold is not a ‘low risk short’, it is choppy at this point, and tends to surprise to the upside. IF THIS BREAKS OUT HIGHER, this consolidation might be all we get for a pullback.
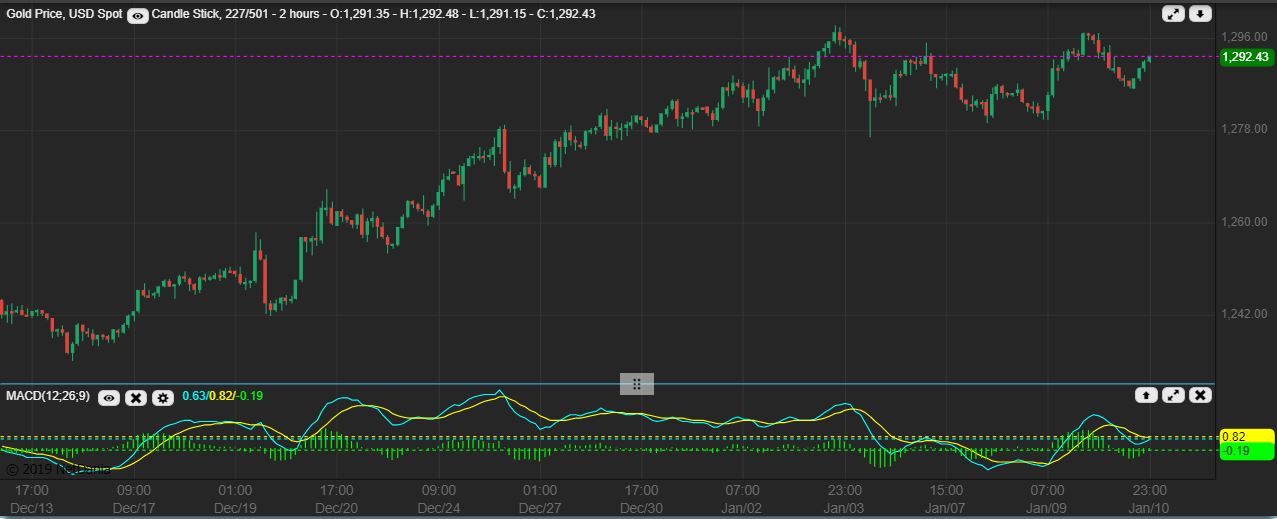
GOLD – EDIT: IT IS 6:30 AM EASTERN AS I PROOF READ. THIS IS GOLD LIVE. IT IS MOVING SIDEWAYS, CONSOLIDATING GAINS.
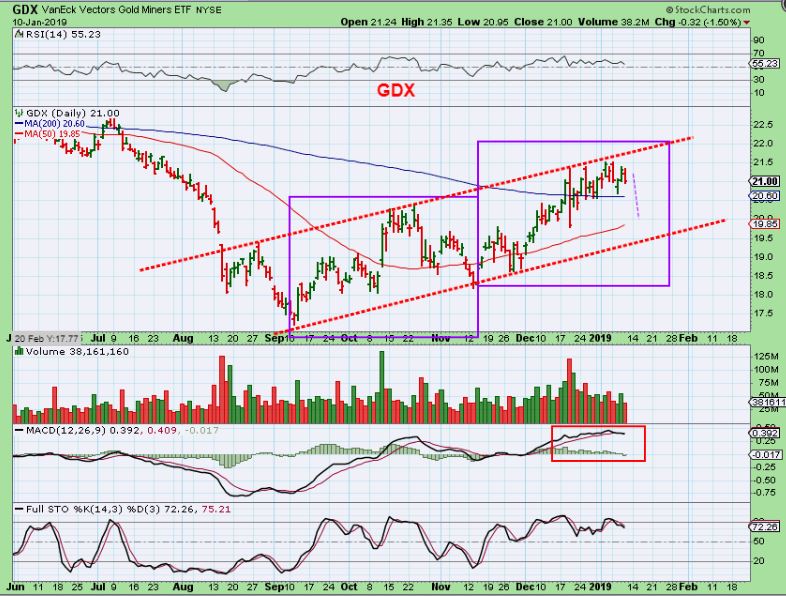
GDX – If we can get a drop, it might only look like this, but so far GDX got choppy again. Believe it or not, this is 3 weeks sideways. It is simply going sideways along the 200 sma now, and that can be a Bullish Crawl. IF GOLD BREAKS OUT HIGHER, THIS CRAWL ALONG THE 200 SMA MAY BE THE ONLY PULL BACK THAT WE SEE ALSO.
NOTE: AFTER A SHARP SELL OFF, I WILL OFTEN BUY A STRONG REVERSAL CANDLE ( LIKE WE HAD IN OIL or the SPX ) , AND YOU PUT A STOP BELOW THAT CANDLE. USUALLY, THOSE LOWS ARE NOT TAKEN OUT. THAT SAID…
.
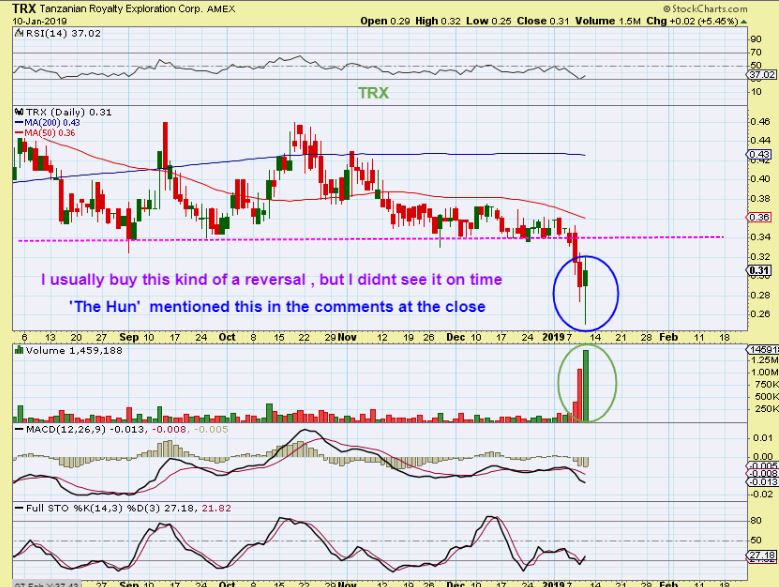
TRX – This had been selling off over the past 3 days, and suddenly yesterday it flipped with a massive volume reversal. After a capitulation type sell off day Wednesday and this kind of reversal, I USUALLY BUY THAT REVERSAL. THE HUN pointed this out after the close, I did not see it real time, so I didn’t buy it. Let me show you something.
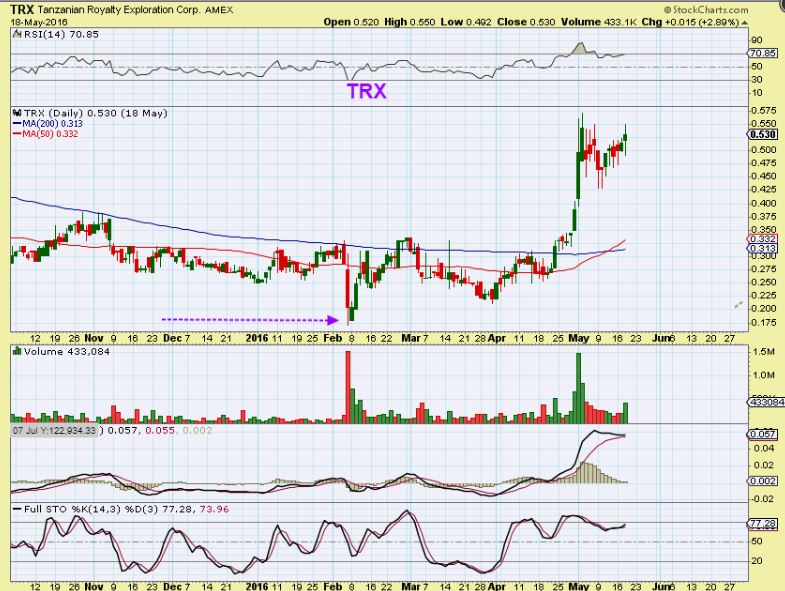
TRX – This was the 2016 Crash / Reversal – Notice that it doesn’t mean that it’ll just rocket higher, but the solid reversal is usually THE LOWS for a while. I say ‘Usually’ so that everyone knows to USE A STOP if you enter a position.
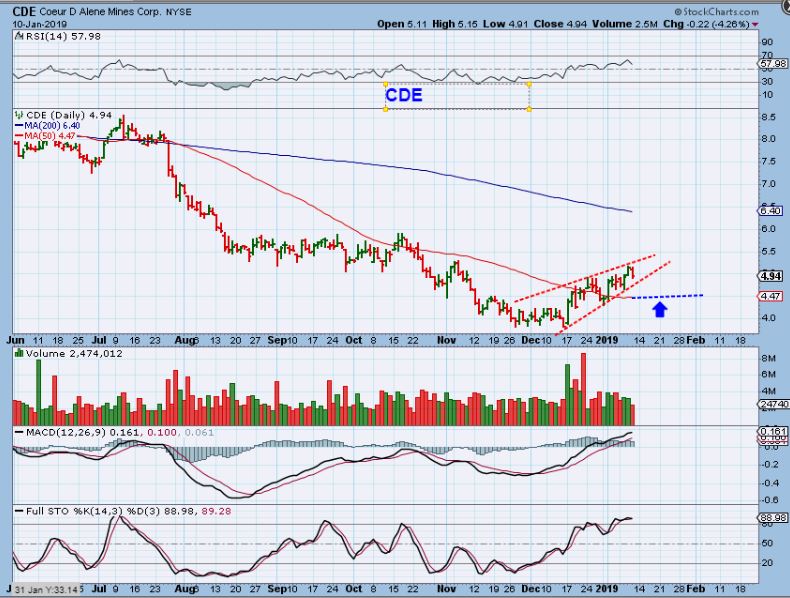
CDE – So some Miners do look like they could pull back for a buy opportunity. CDE could tag that 50sma unless it just breaks this apex higher.
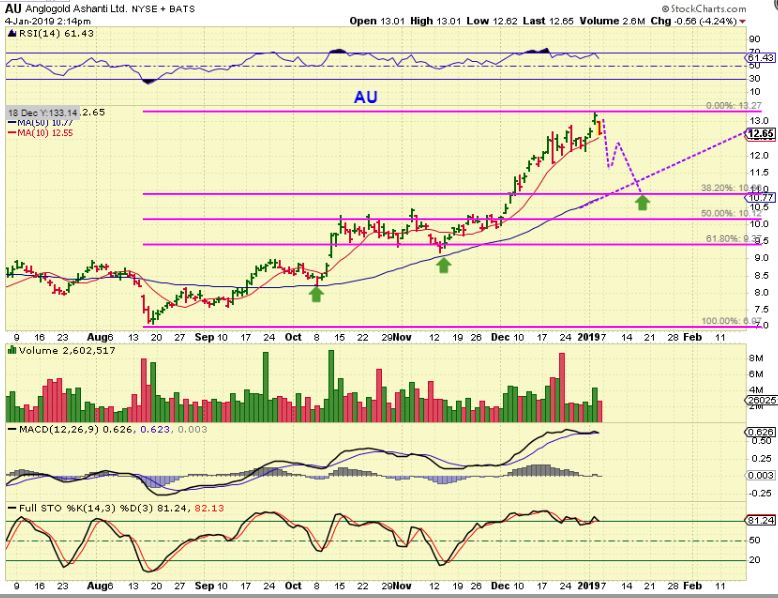
AU – I drew this a week ago, and Price is actually only 15 cents lower, this has been sideways chop too, so at this point, this sector is holding up rather well.
The last couple of weeks have had a lot of good trading. After a big sell off, we often get those kinds of opportunities. I will discuss some of the recent trades below a bit further.
.
Enjoy your Friday trading , and we’ll see you in the Big Picture report this weekend.
.
~ALEX
.
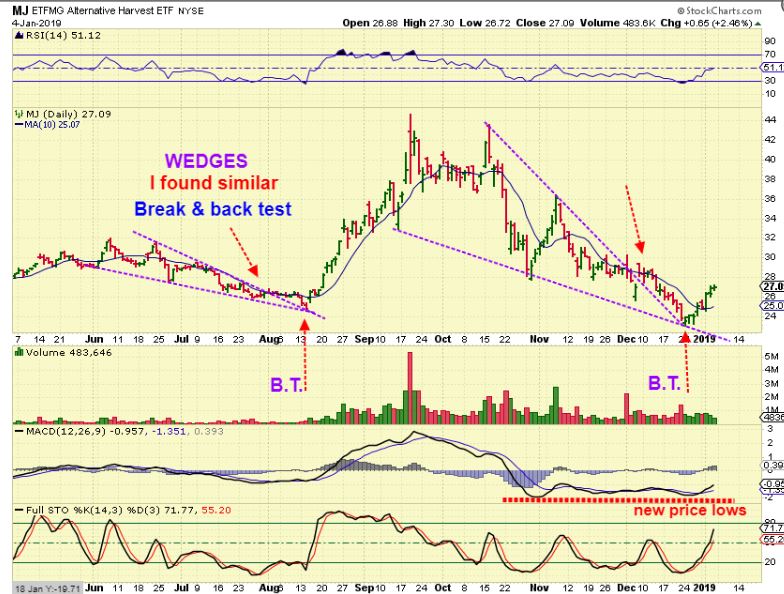
MJ – I posted this to show a similar pattern here where MJ ETF (And MJ Stocks) Just rallied very strongly in August. This MJ ETF was $27
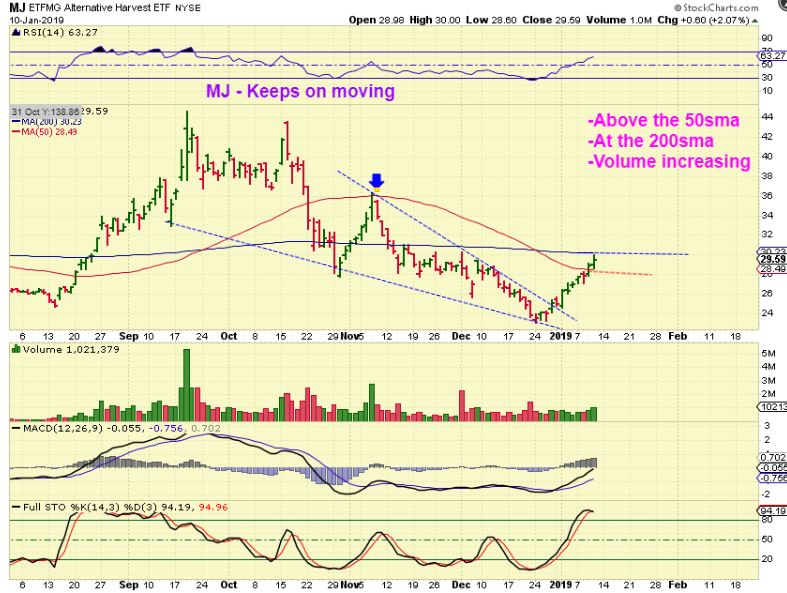
MJ – It broke right through the 50sma resistance with no pause, and looks ready to take on the 200sma. It hit $30 Thursday. The stocks in this sector have been on fire, so they may just push this etf right through that 200sma. Let’s look at MJ Stocks.
.
LETS REVIEW A FEW MJ STOCKS, SO YOU CAN SEE HOW THEY TRADE. I FOND THESE TO BE EXCELLENT FOR QUICK GAINS OR EVEN SHORT TERM BUY & HOLD.
.
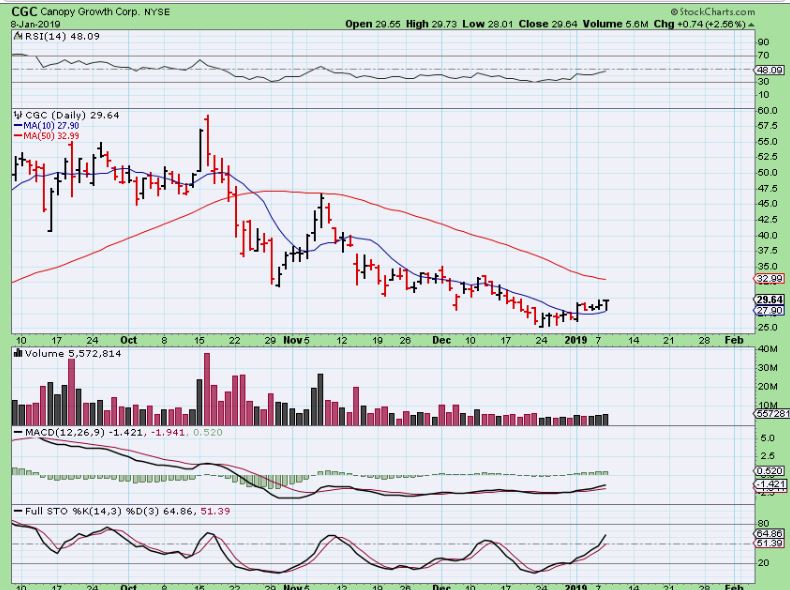
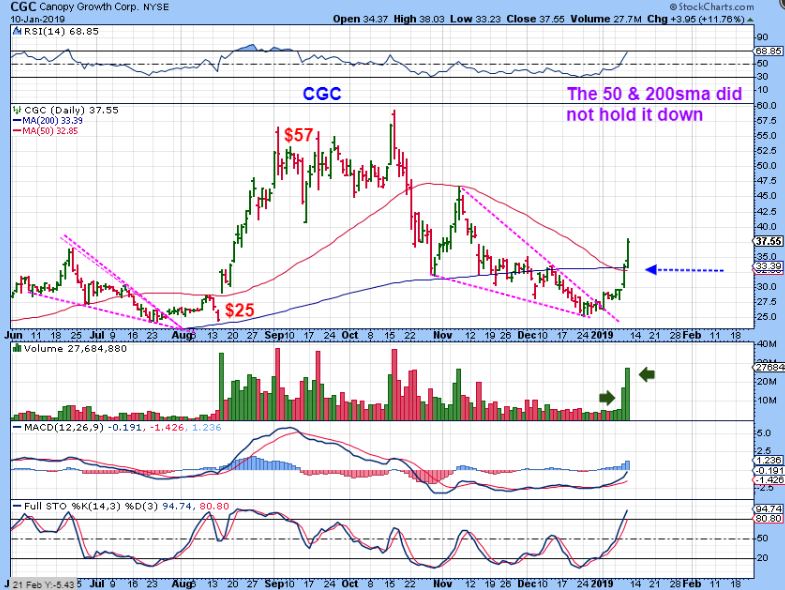
CGC – Jan 8 saw CGC drop to the 10sma and reverse higher again. The 10sma acted as support, the 50 sma is overhead resistance…
CGC – Jan 9 saw CGC up 13% , but pushing against a double resistance, with a great volume swell. Can it get through?
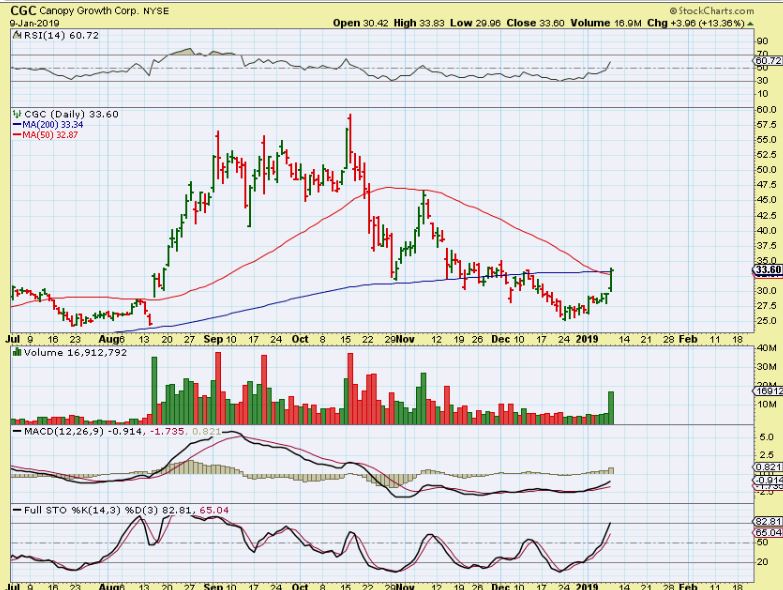
CGC – Boom, with even higher volume CGC pushed right through, up another 12%. As I have mentioned before, These Move VERY WELL, and if you time it right, it is very rewarding. This was 25% in just 2 days. This has been a 50% move in 2 weeks off of the lows.
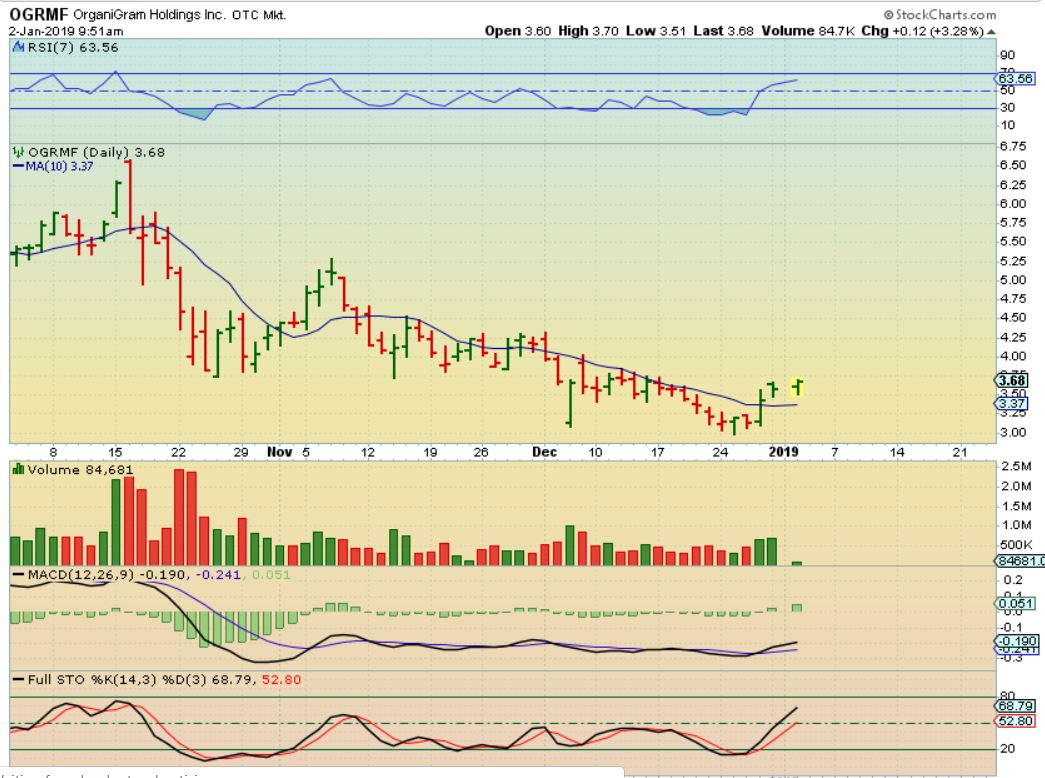
OGRMF – On Jan 2 with less than 1/2 hr of trading, I pointed this POP out as a Bullish break of the downtrend. The MACD CROSS, STRONG RSI , and volume swelling is always a bonus. It ran very well to the 50 & 200 sma…
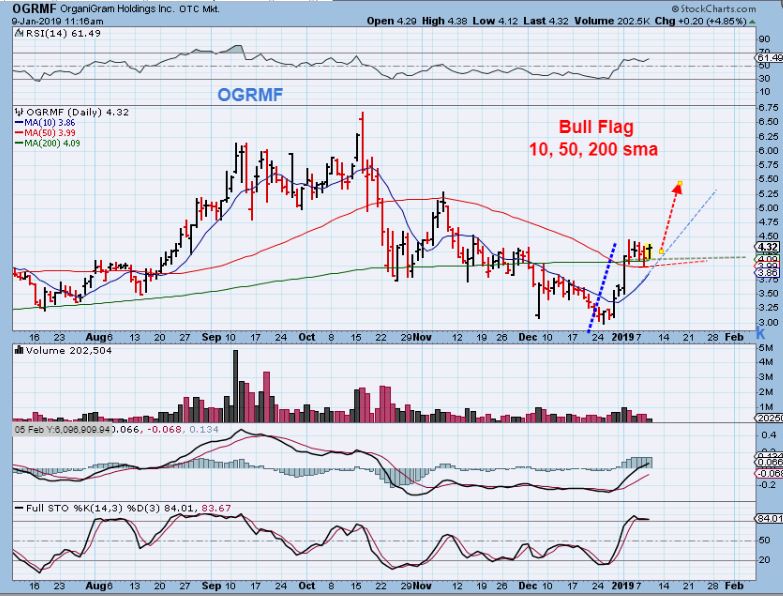
OGRMF – Yesterday I said that this was a Bull Flag on solid support. Easy to buy with a stop. I bought this.
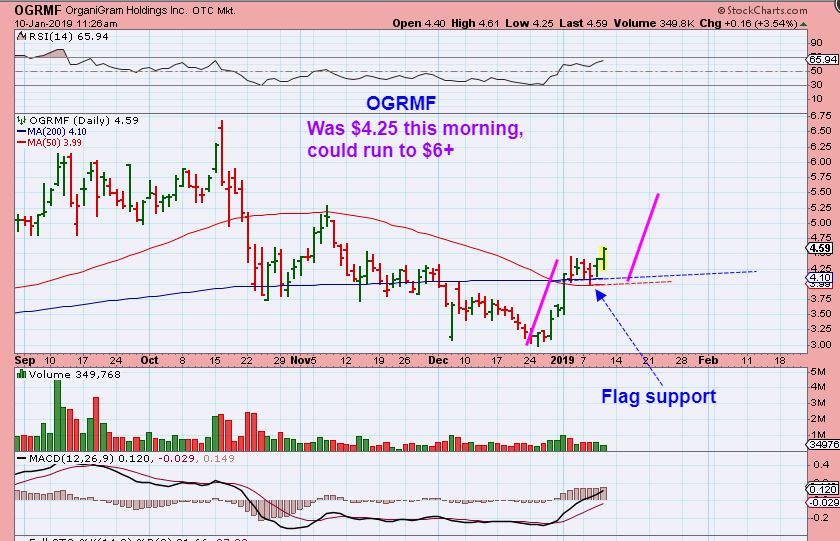
OGRMF – This was 2 hrs into trading, and it started to move higher out of the flag. THIS IS STILL A BUY in my opinion. It ran to $4.75 and closed at $4.60. My target is over $6.
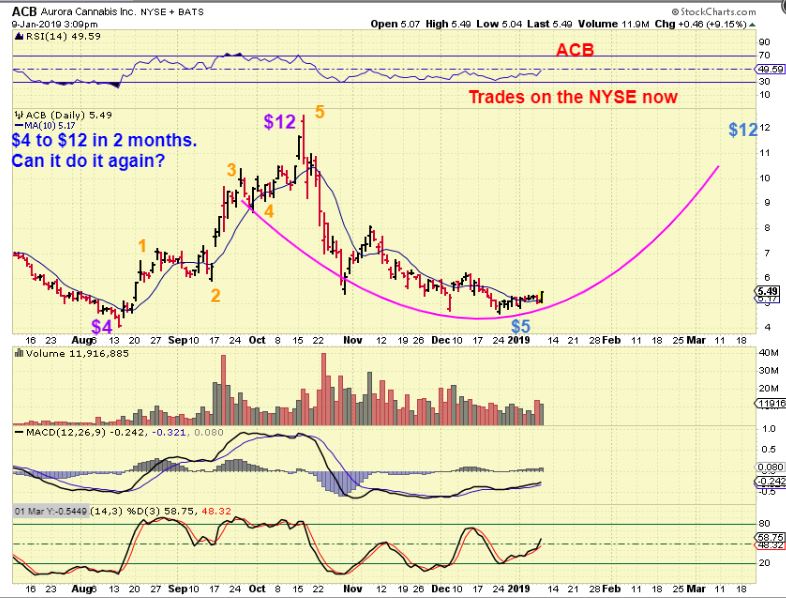
ACB – I posted this yesterday, we discussed it in the comments section, and a few of us Bought it. It then moved up about 10% with good volume…
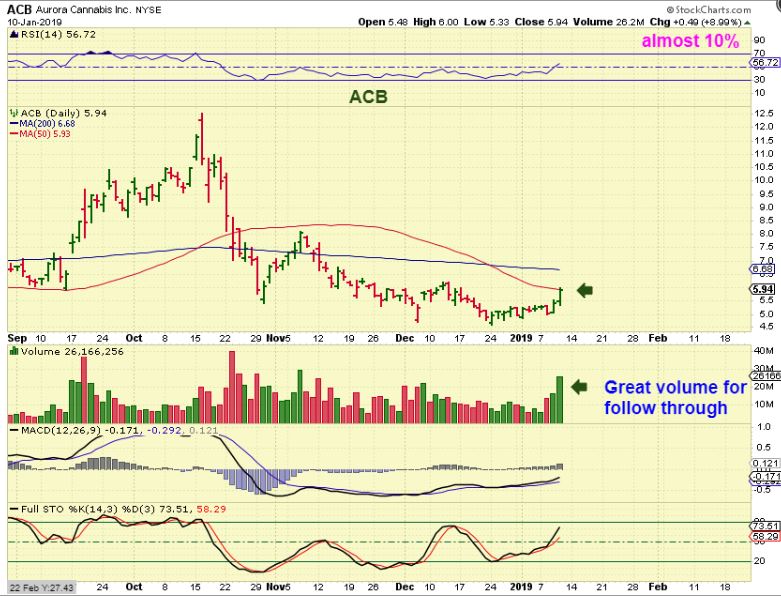
ACB – Almost another 10%, so that is 20 % in 2 days, and this honestly looks like it can just keep running. We have seen MANY of these just burst above the 50sma.
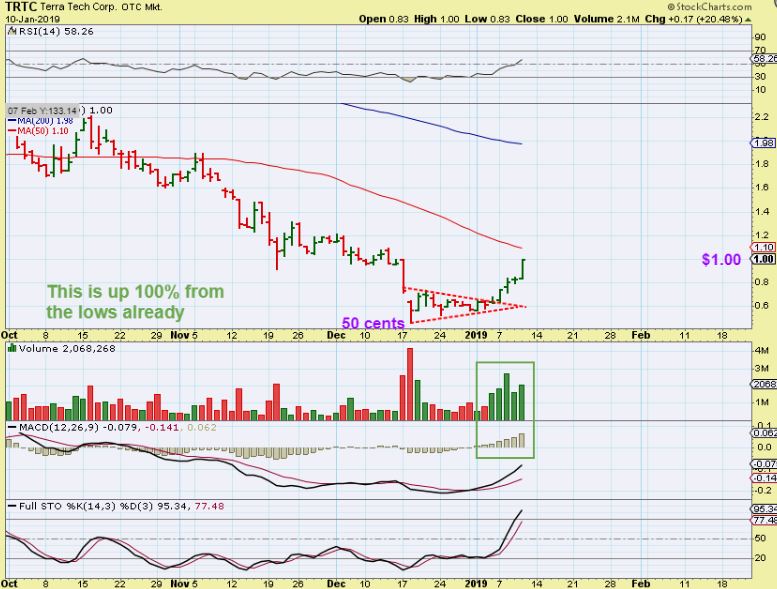
TRTC – This is playing out very well. See the chart, and again, that 50sma may not stop price.
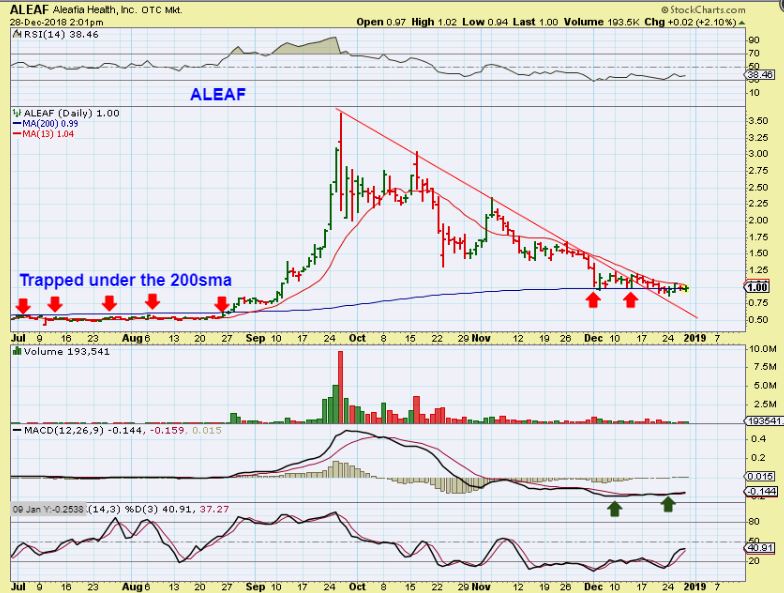
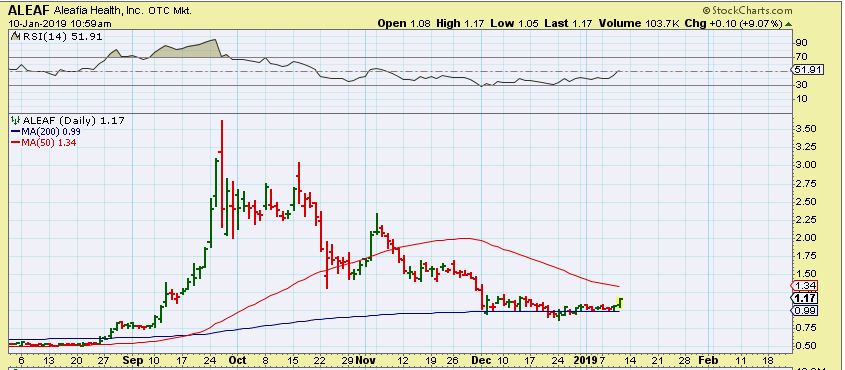
ALEAF – I wrote about ALEAF on Dec 28.
Look at the 200sma, and the prior run in September . I like a nice long flat tight base riding support. I Bought at $1.00 and added again just above $1, because of this base. These can be explosive, but it just kept moving sideways.
ALEAF – I grabbed this 1 and a 1/2 Hrs after the open Thursday. It was popping and was up 9%, looking good.
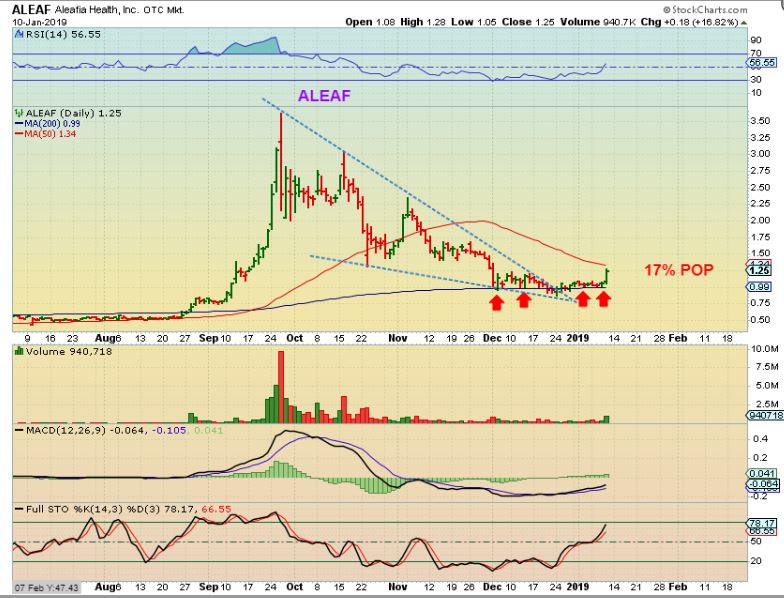
ALEAF – It closed up 17% and since this is coming out of a nice long flat tight base, this should easily be able to break resistance and run higher. I would think that $1 to $2 should be a breeze, and then I will watch it along the way.
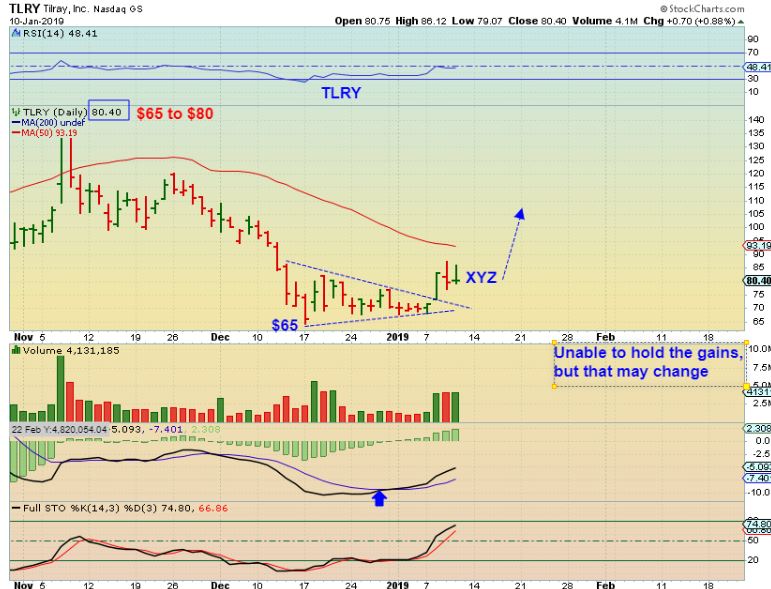
TLRY – Who can forget the parabolic run of TLRY? Let’s zoom in and see what it is doing lately…
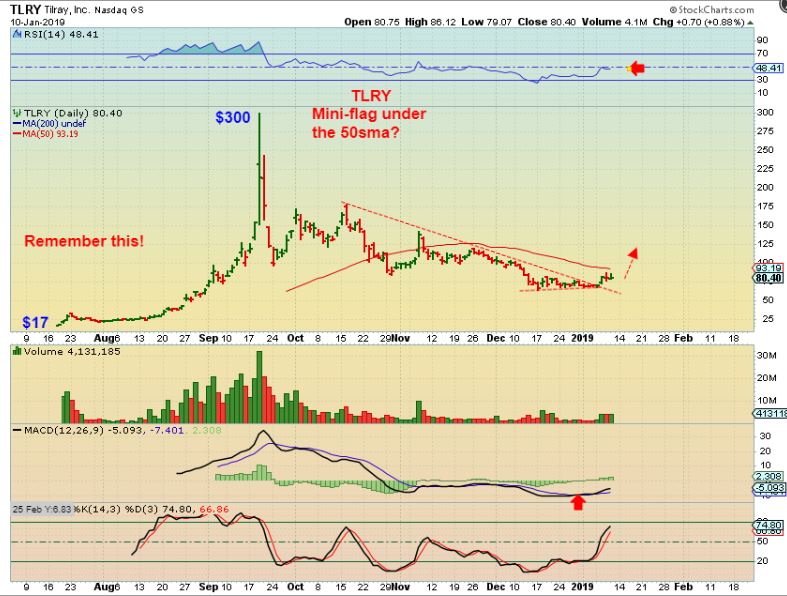
TLRY – This has made some gains and had a very nice pop on Tuesday, but for the last 2 days, it runs higher and sells off into the close. I still think that it could get running , but I’d like to see how it trades just a little bit more. Maybe something is wrong? A little more time will tell, I would have thought that this one would have done better than CRON, CGC, etc, but so far it’s a bit subdued. I’ll watch it Friday.