Dec 1st weekend Report
Is it a Trade War that will continue as time moves forward, or will there be an agreement of terms that both sides can live with? All eyes seem to be on the G20 meeting this weekend for the answer to that question, since it already seems to be having implications on how these markets trade going forward. Just like any war, trade wars often have casualties along the way, and these markets have been very choppy lately.
.
EDIT: This just in… (Bloomberg) — Stock markets will close Wednesday for a national day of mourning to honor former President George H.W. Bush.
.
Let’s review the various Market Sectors to look at The Big Picture and see how they traded this past week…
.
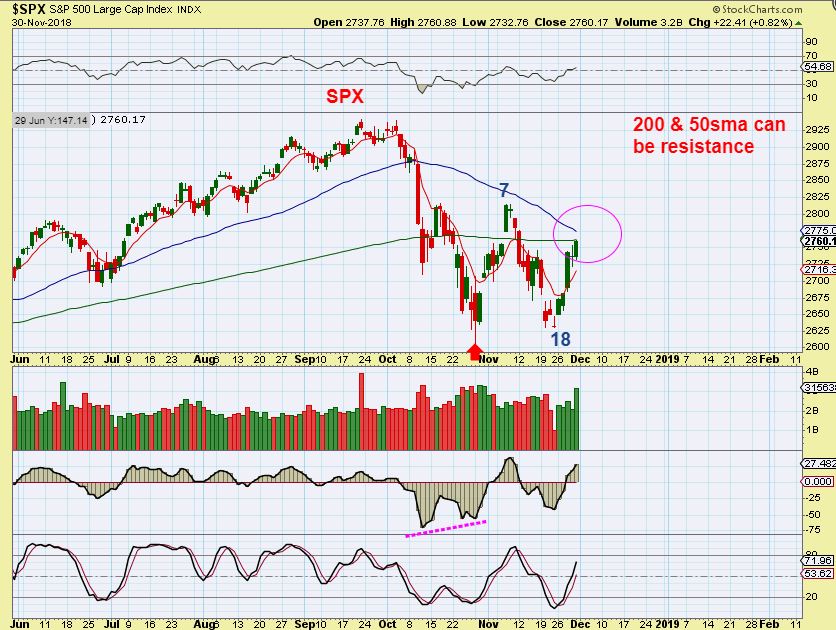
SPX – This is what I was watching for, and then a break to a lower low to the ICL, or if the ICL is in place from October, a higher low may happen on the next drop.
#1 – Nov 27 I drew this – A run to the 50sma/ 200 sma, and a possible drop to a lower low.
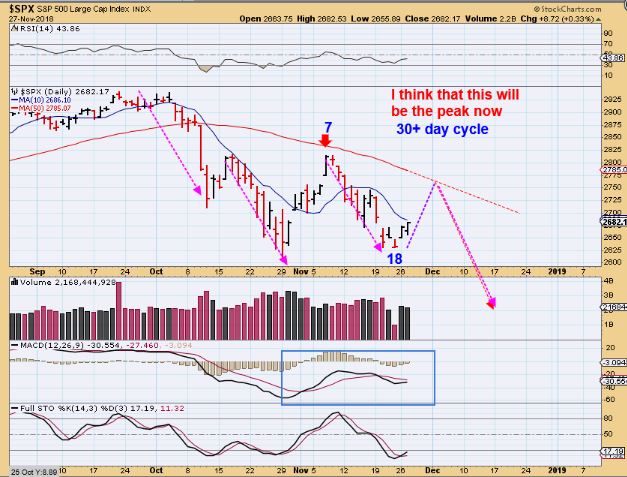
#2 Or was an OCT ICL is in place? A break higher after the G20 meeting results, and then a drop to a higher low. EITHER WAY, these markets can remain choppy & difficult.
We are here now
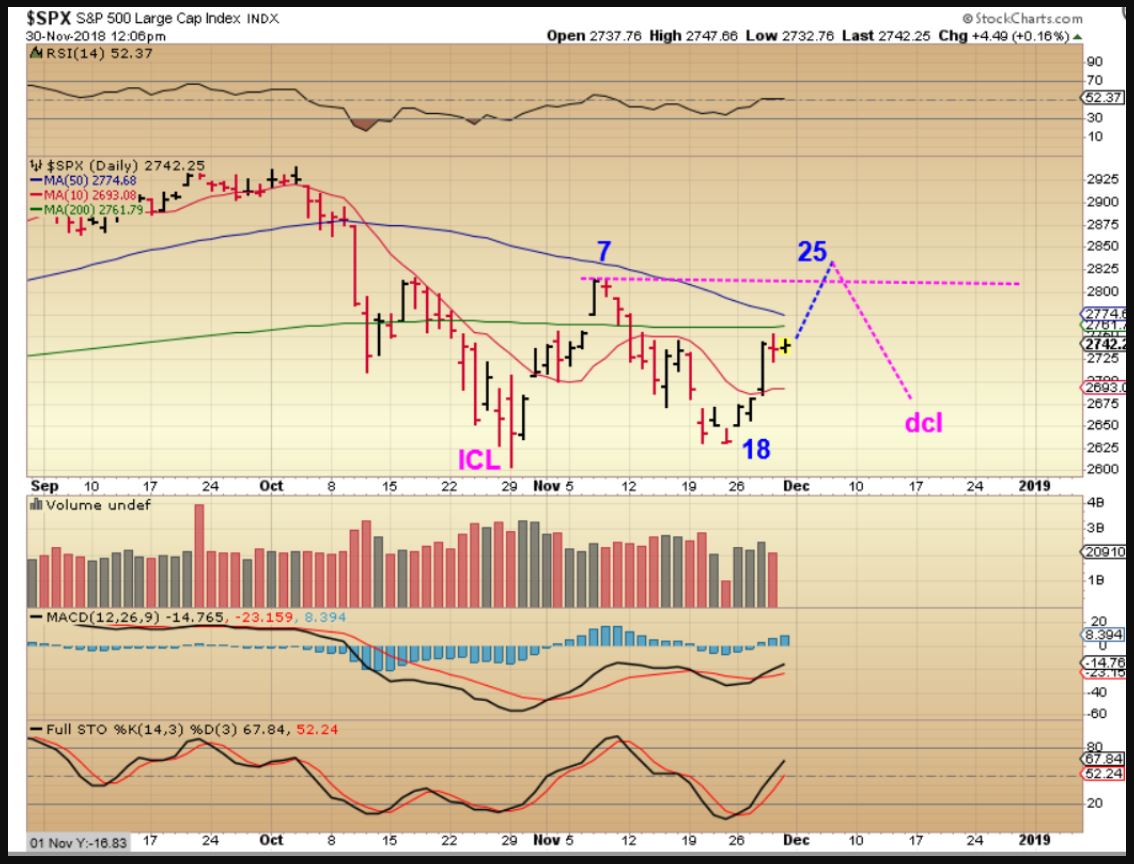
SPX – I expected the bounce to this area, and then we need to watch price action at the resistance. It just happens to fall at the timing for the G20 meeting.
Lets continue…
SPX WEEKLY – SO FAR, the multi year bull uptrend has been broken
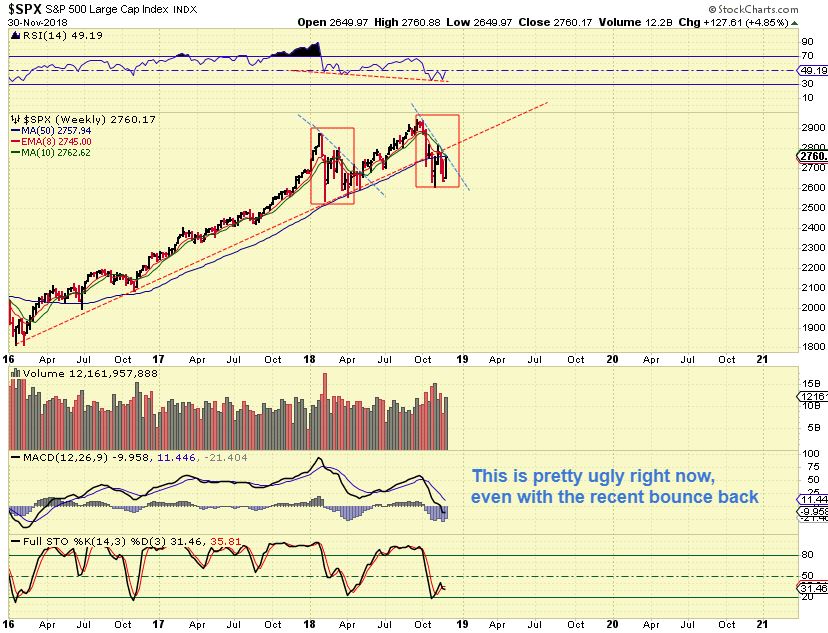
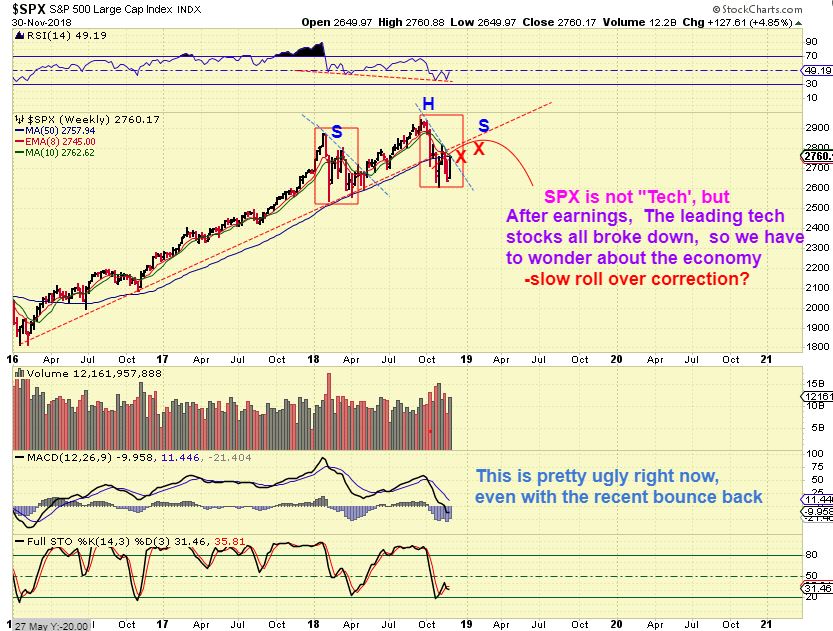
SPX WEEKLY – Even a push higher can be a choppy top formation. Many formerly Bullish Tech stocks are suffering quite a bit .
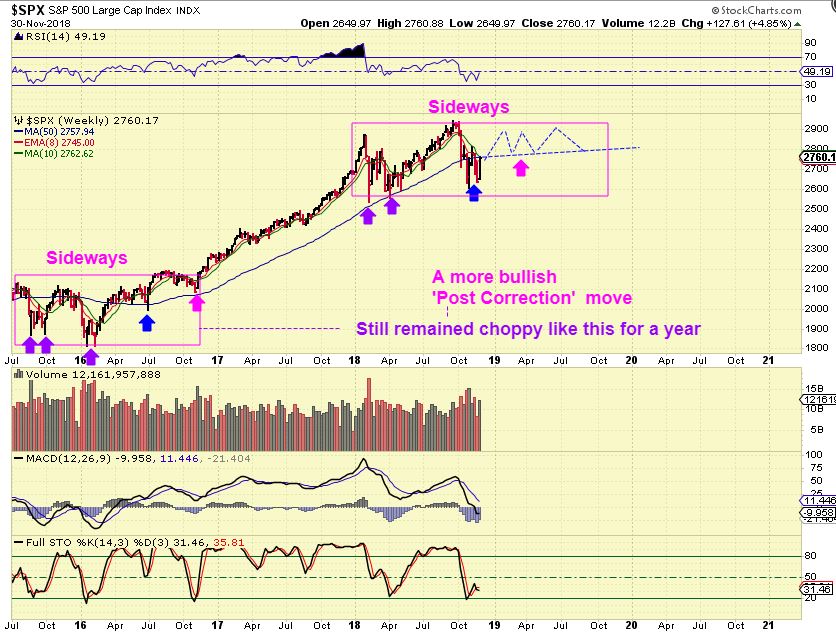
SPX WEEKLY – This is what a choppy sideways consolidation though 2019 could look for. Notice 2016. I have repeatedly said that the General Markets may be come Choppy and difficult.
So at a glance , it seems that things could go either way, BUT LOOKING AT OTHER AREAS MAY GIVE US MORE CLUES. A MORE BEARISH LONG TERM LOOK MAY BE PRESENTING ITSELF.
NASDAQ – The NASDAQ looks like more of break down, right? It made NEW LOWS a week ago, not higher lows like the SPX. THIS COULD BE A SIGN OF WEAKNESS, and an end of the year rally may just back test the channel . Also …
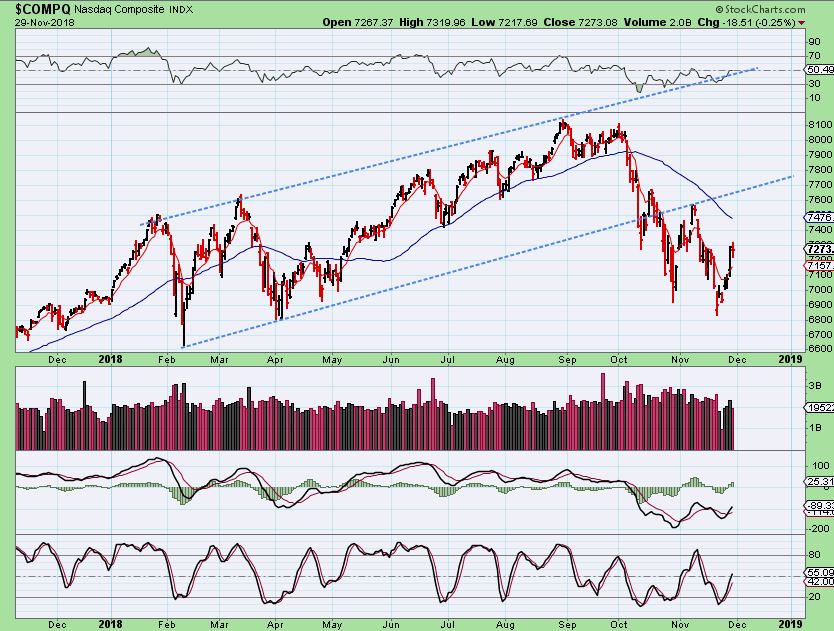
SOMETHING ELSE TO WATCH FOR- SEASONALITY USUALLY CALLS FOR WHAT THEY HAVE NAMED THE END OF THE YEAR RALLY A ‘Santa Clause Rally”. If we see a Post G20 Rally, I will be watching it closely, since it may just be false hopes. Here is what I will be looking at (And it may even lead to a ‘short ‘ trade using ETFs).
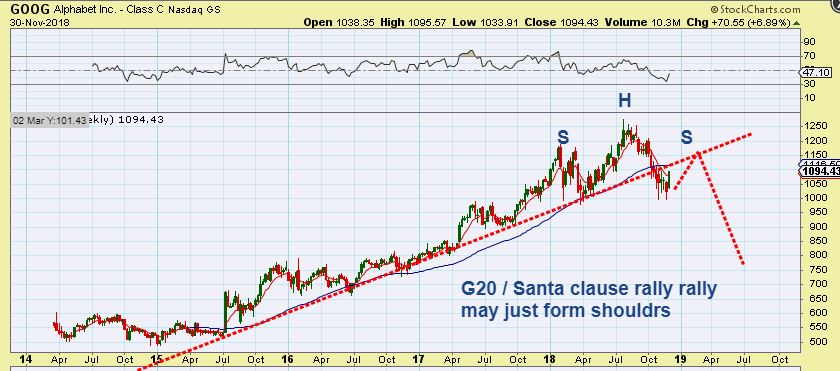
GOOG broke the uptrend. An end of year rally may draw people in, but only be a back test & H&S.
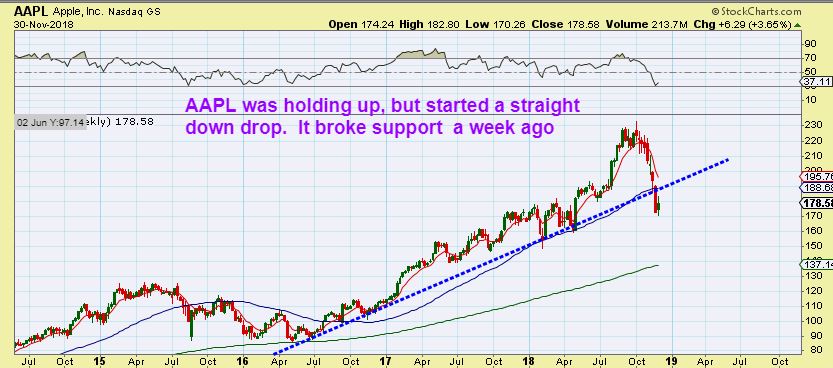
SAME BREAK DOWN OF THE MULTI YEAR UPTREND FOR AAPL
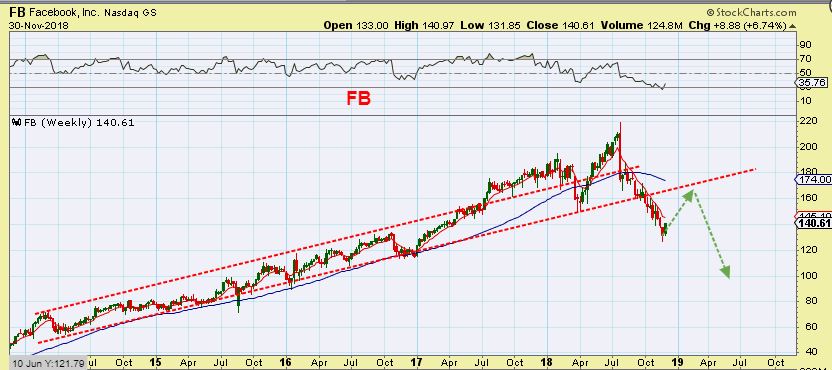
FB ALSO LOST THE UPTREND – A Santa-Rally may be a shorting opportunity, not a renewed bull run.
NVDA – These drops were serious drops. SO IS THIS A CHANGE TO A BEAR MARKET CORRECTION OR AT LEAST SIDEWAYS CONSOLIDATION? IT VERY WELL COULD BE.
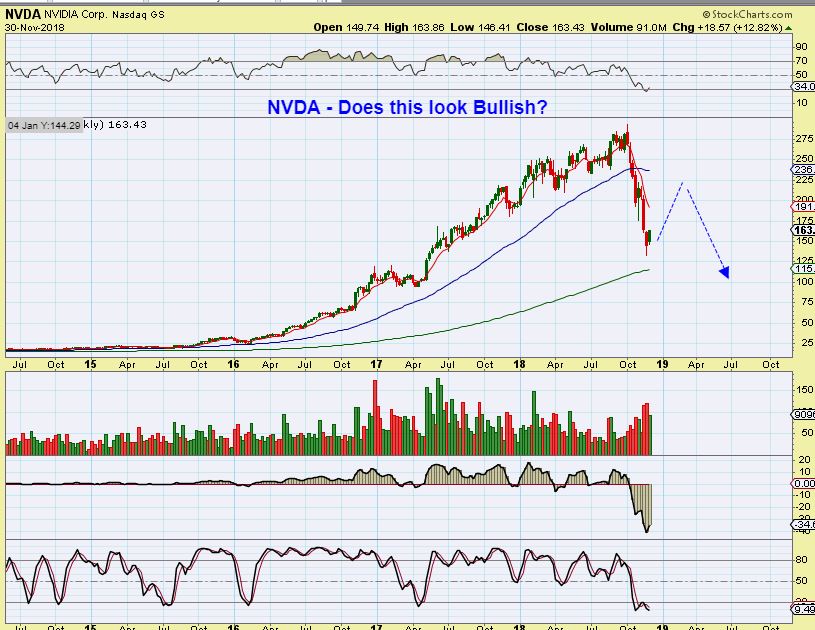
SO IS THIS A CHANGE TO A BEAR MARKET CORRECTION OR AT LEAST SIDEWAYS CONSOLIDATION? IT VERY WELL COULD BE. The rally out of this ICL may be weak and not break to new highs…. Lets Look at the NASDAQ…
.
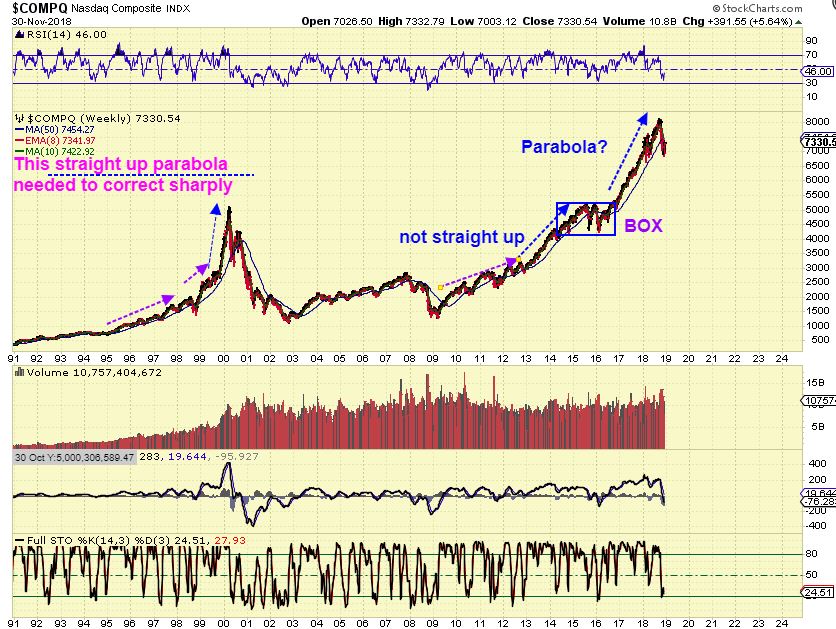
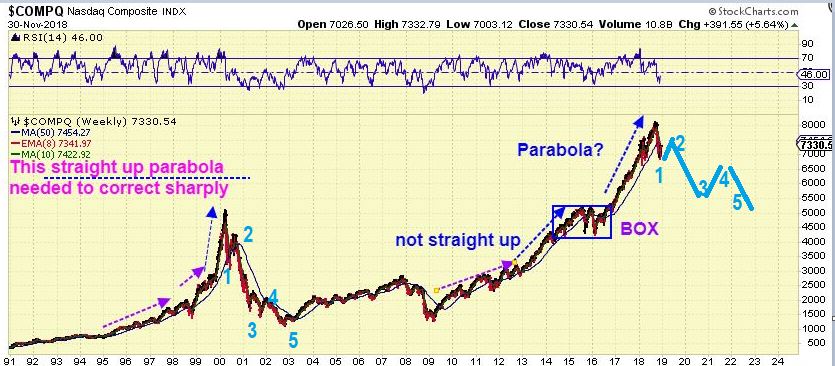
NASDAQ WEEKLY #1 – This rally was not as sharp of a parabola as 1999, but it could be a parabolic top. Only time will tell, but watching for clues along the way is important. We could get another BOX as seen here in 2014-2017, or a drop like 2000, and neither was a good Buy & Hold time period.
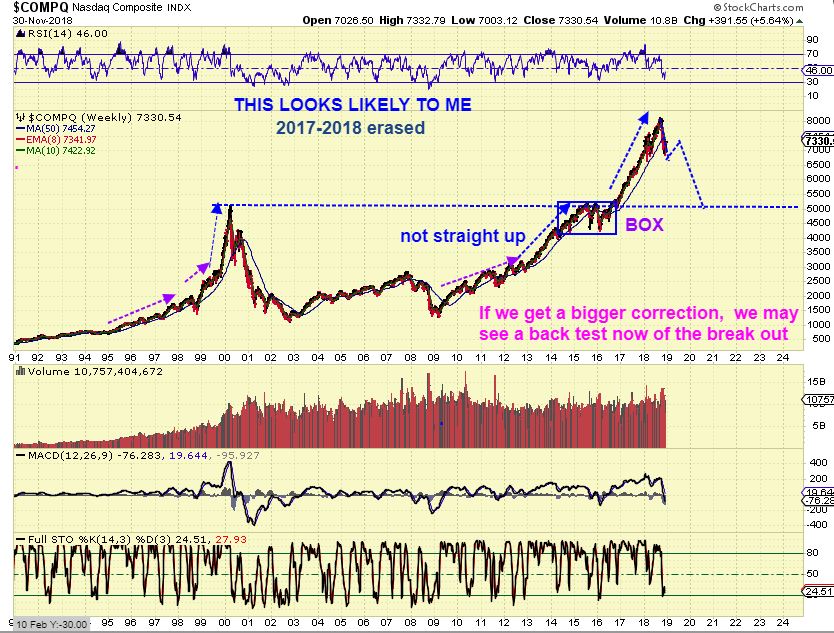
NASDAQ WEEKLY#2 – This is very likely, using technical analysis. This would be more of a multi- month bear market recession like pull back, but also could have a strong convincing rallied/ bounces along the way. Look at the BOUNCE in 2000. It looks similar to know.
.
WE NEED TO LOOK AT OIL WITH A DETAILED WEEKEND BIG PICTURE LOOK. I DO BELIEVE THAT OIL IS VERY CLOSE TO PUTTING IN A LOW (DCL or ICL), BUT I WILL ALSO SHOW SOME EYE OPENING CHARTS THAT SHOW HOW OIL CAN SELL OFF FURTHER IF THE SITUATION REMAINS BEARISH. AGAIN, I EXPECT A LOW, BUT I WANT TO SHOW YOU THE OTHER SIDE OF THE COIN.
.
OIL Daily – This is what I expect at 70+ days on a daily cycle dropping this deeply. I am looking for a good bounce, so I went long GUSH, because the XLE looks to be bottoming. This could be Oils low, but this trade needs a stop, and let me show you why. I will show a possible bearish scenario…
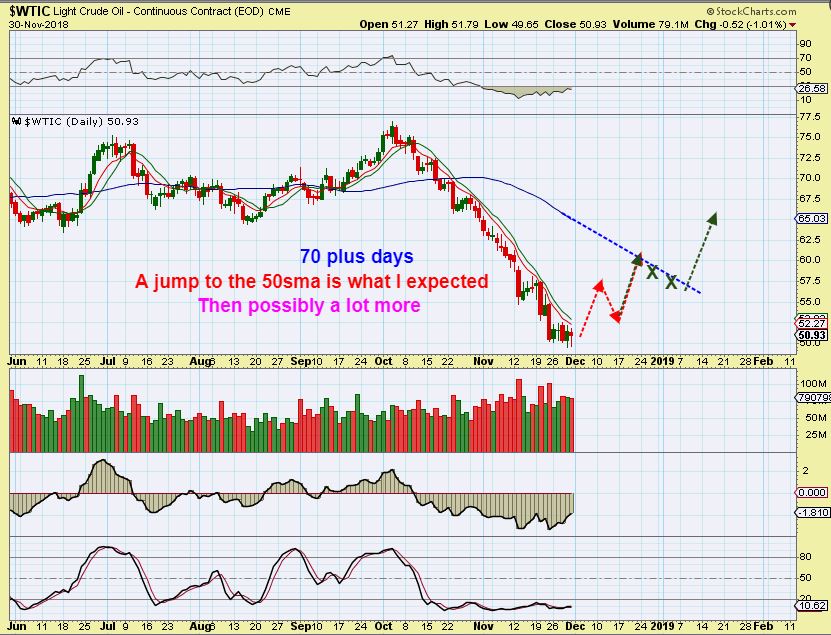
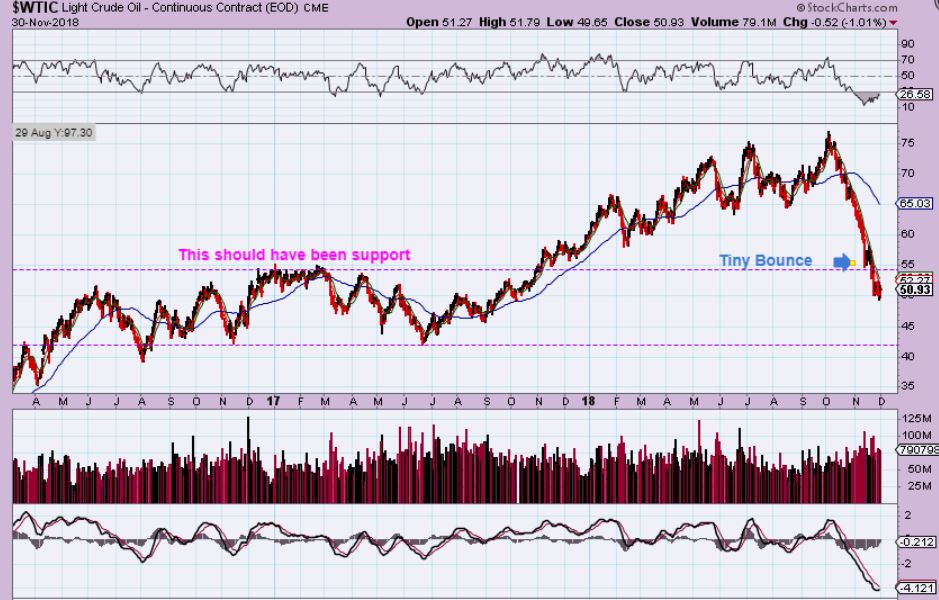
OIL – Honestly, I thought that OIL would stall at support, but it actually did break through it after just a tiny bounce or pause (that is the pause that I first bought UWT , and I got stopped out).
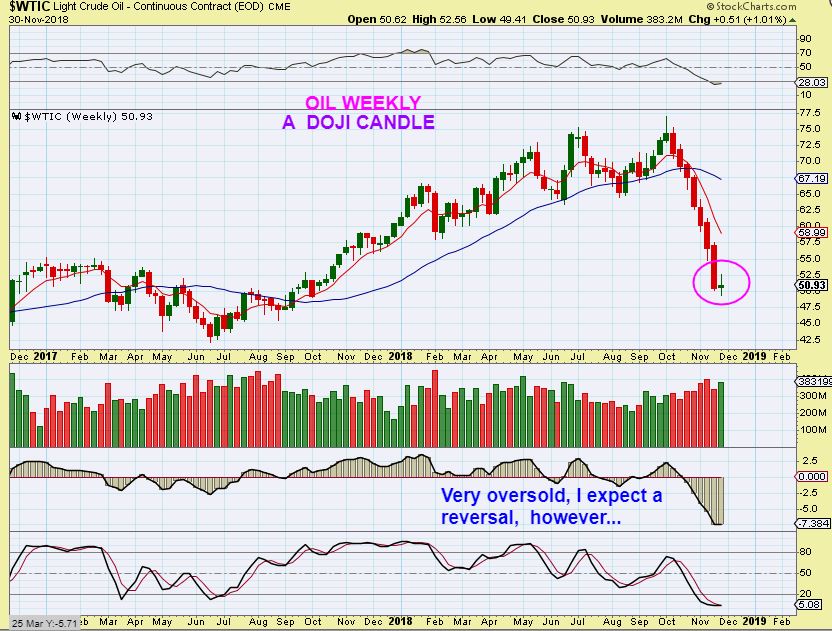
OIL CURRENTLY – The weekly closed as a DOJI. A DOJI can be a bottom or reversal, and we are due for a swing low at 73 days, however…
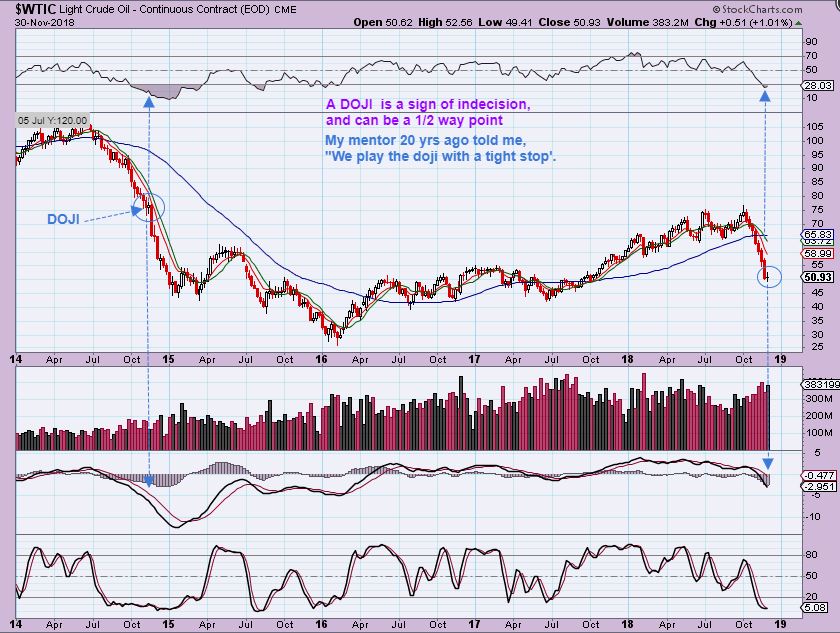
Do you see that massive sell off in 2014? WHOA! So I wanted to look at that closer, because I was taught from an experienced trader years ago that a DOJI can be a reversal OR A 1/2 way point. Read the chart about DOJIs.
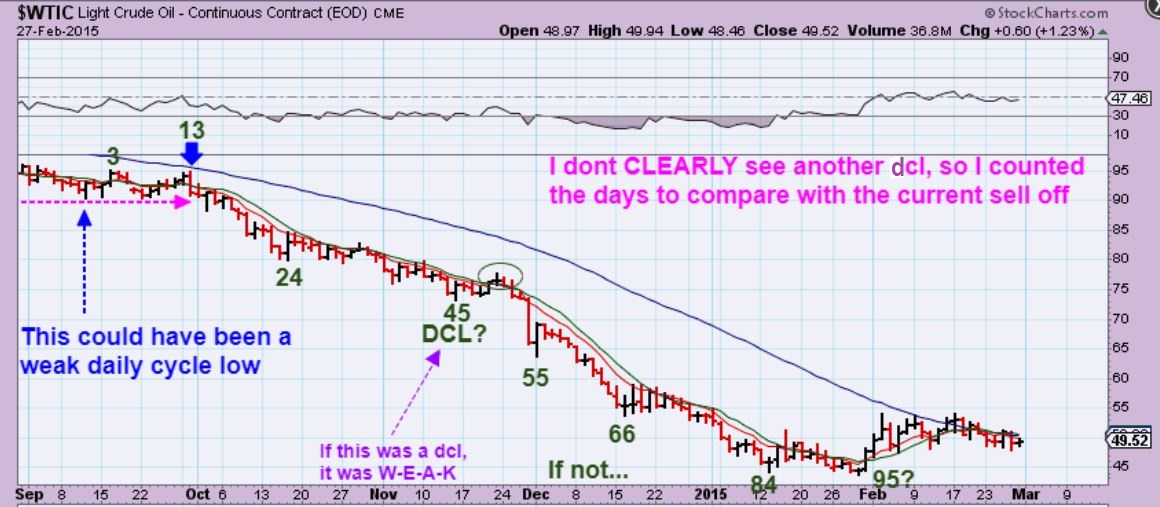
OIL 2014 sell off – Cycle counts were a bit misleading in that absolutely relentless Oil sell off. Do you clearly see a DCL on the way down? Not Clearly. There MIGHT have been tiny sideways bounces that could have been a dcl, but this selling was a deep crash. So I wanted to zoom in even closer, looking for a daily cycle low (dcl).
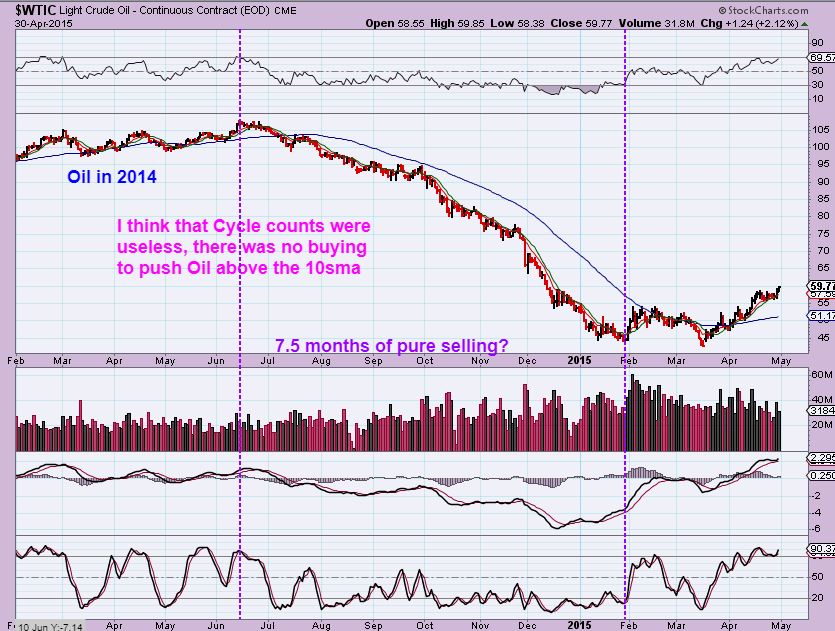
OIL 2014 sell off – MAYBE day 45 was a sideways dcl? It is barely visible, but it did close above the 10sma for 1 day. If that is not a dcl, then this dropped for 95 days! Going long was a bit risky on any reversal, so this is why we need STOPS on any Oil positions. Lets dig deeper…
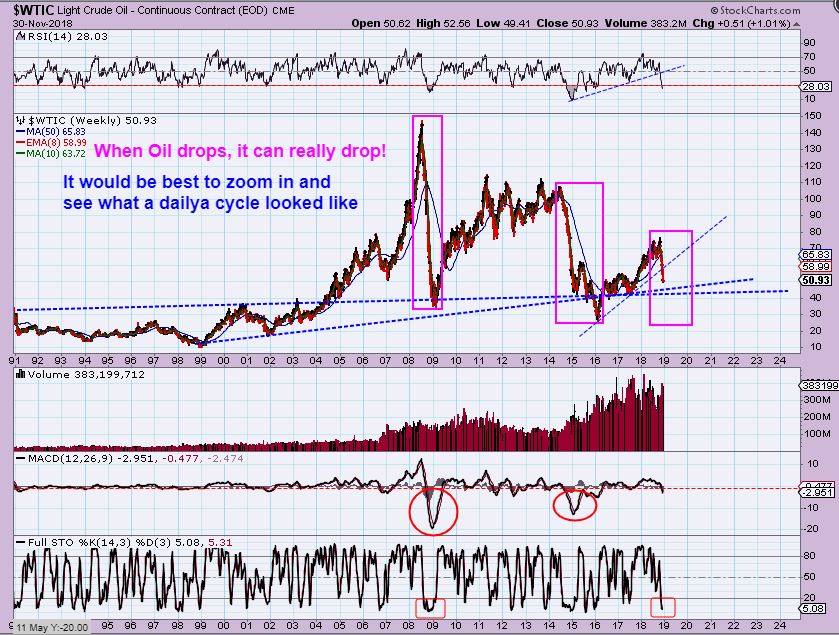
OIL WEEKLY BIG PICTURE – WHOA!!! Now look at that crazy 2008 drop! I don’t expect that here, but WOW! 2008 & 2014 drops make this current one look rather small, so we need to be careful, we need stops.
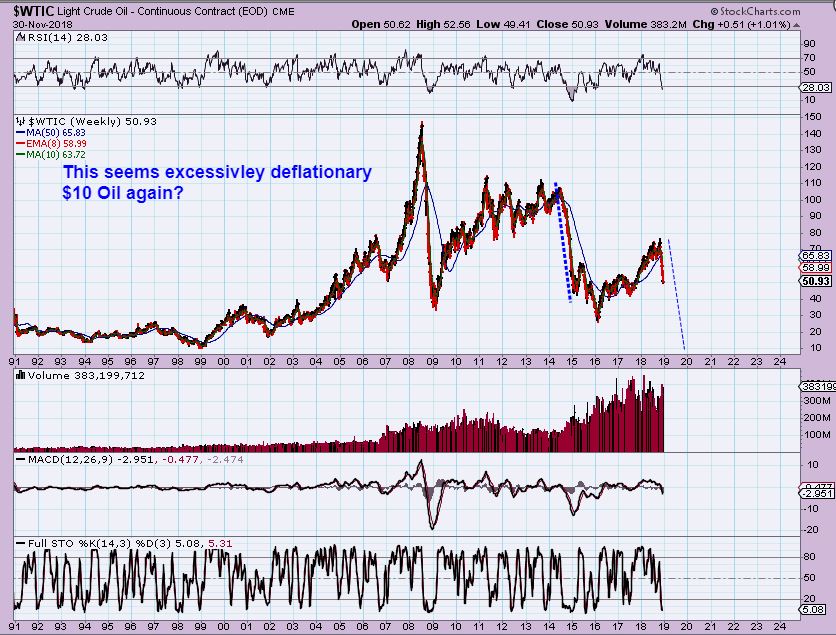
OIL – This was actually the first chart that I pulled up. Looking at these extremes, I just felt that I needed to zoom in and get a better look. Now that we have , the emphasis is that when a swing low forms, or price breaks the 10sma & looks like a dcl to go long, WE STILL NEED STOPS . In the past it went sideways for a week or two & continued down.
.
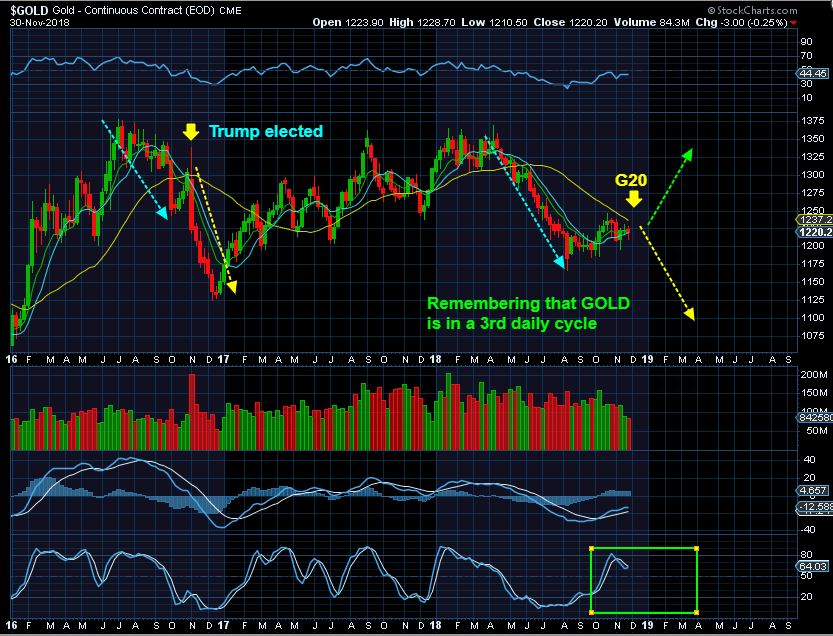
IF THE USD IS LOOKING STRONG AND GOLD IS IN ITs 3rd DAILY CYCLE, CAN GOLD RALLY? It is doubtful.
.
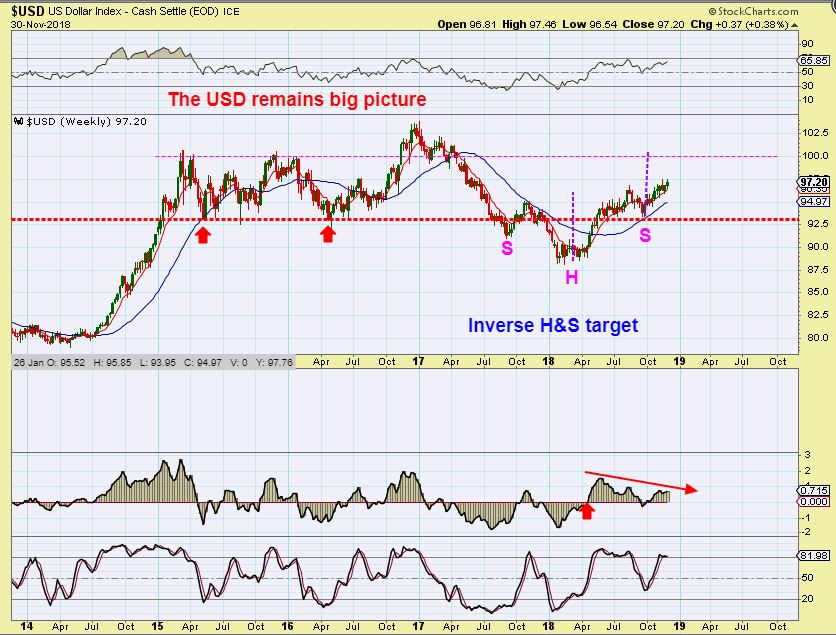
USD WEEKLY #1 – Gold has done well holding up with the USD moving higher, but honestly, this is a bullish USD WEEKLY CHART. It recovered the 2018 break down.
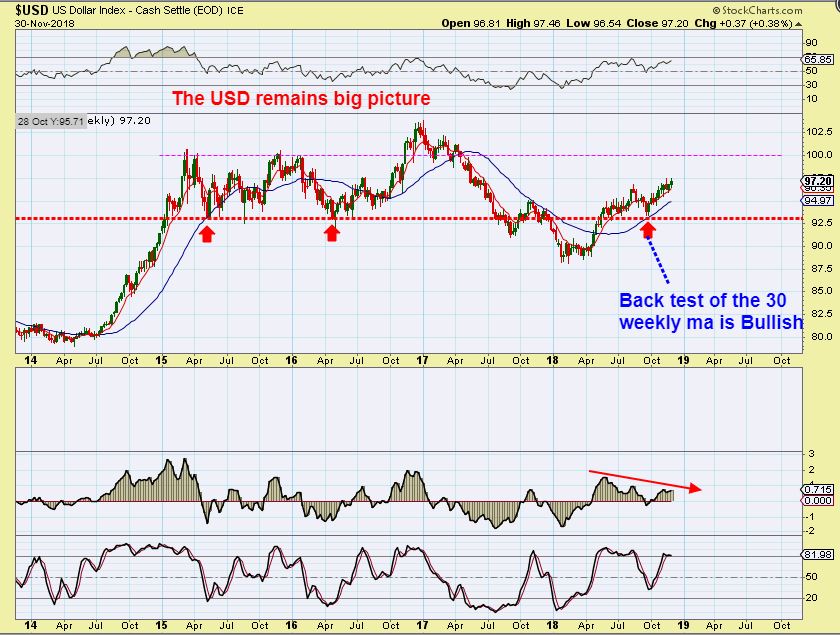
USD WEEKLY #2 – If this inverse H&S plays out over time, this channel should fill. If this USD runs higher into Jan or FEB, Gold could seek out the ICL .
GOLD – If the USD rallies into January or February , then GOLD ( Now in its 3rd daily cycle) Could drop into an ICL as the Markets and the USD move higher. Will the G20 mtg start the sell off? We’ll know soon enough. Look at what the Trump election did.
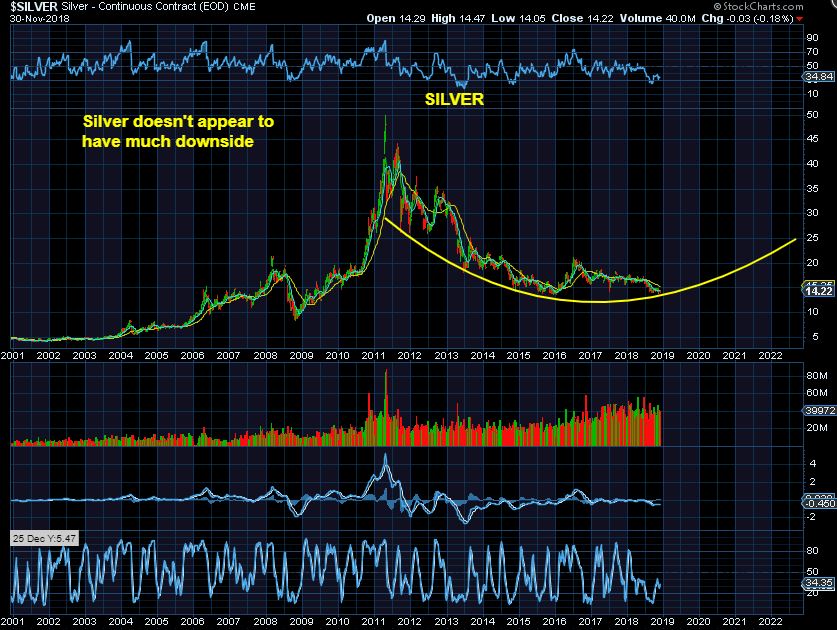
SILVER – This is mixed from the GOLD chart. Gold rallied a bit, Silver didn’t rally at all with Gold since that AUG ICL. It actually looks like it shouldn’t drop a lot more from here too, so we’ll have to see if it holds up or gives way too.
I have pointed out Miners that have been leading the way higher. Miners like ABX, BVN, FNV, GOLD, ETC really moved bullishly out of the Sept lows- what about that? Does that mean that Miners will hold up better or get choppy & sideways? Overall, I would have to say ‘No’, but it is possible that some might. I will discuss why I say probably not after GDX.
.
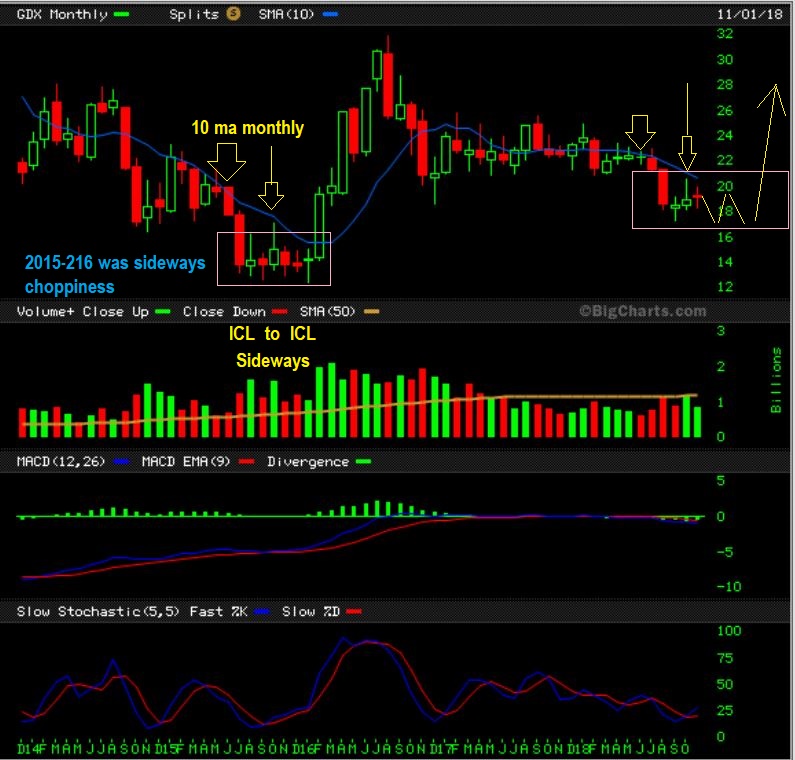
GDX WEEKLY – If Gold drops , this would drop too, in my opinion.
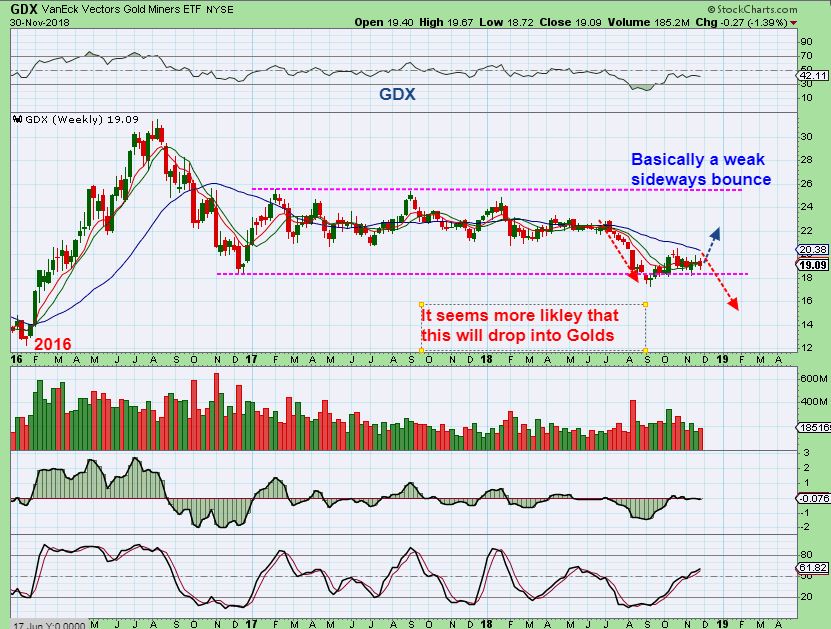
GDX MONTHLY – GDX went sideways for an entire intermediate cycle in 2015-2016 forming a base, we could see that again here. We see a DOJI for the month in GDX also. So GDX / GDXJ could remain choppy sideways, or again, it could drop.
I have been pointing out the nice run & leadership of some of the Miners. Let’s discuss that now .
.
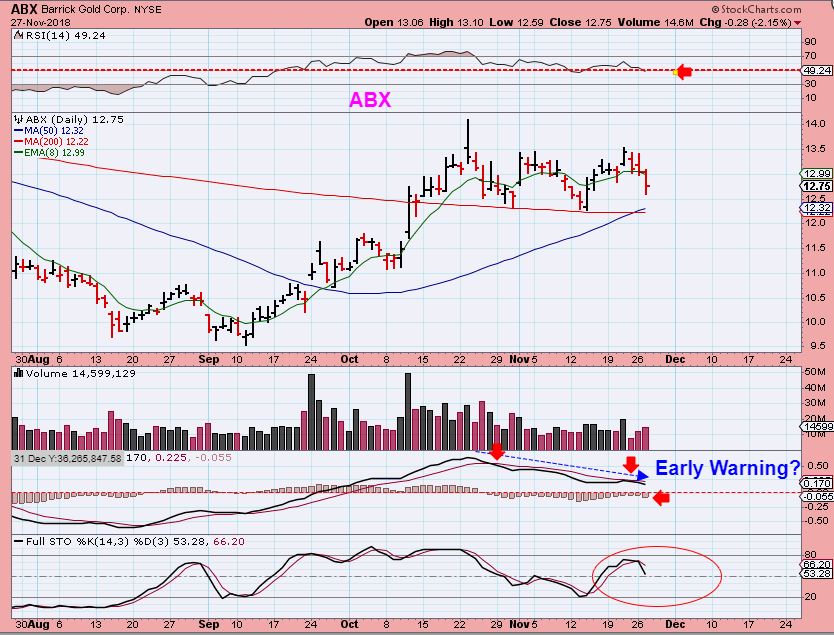
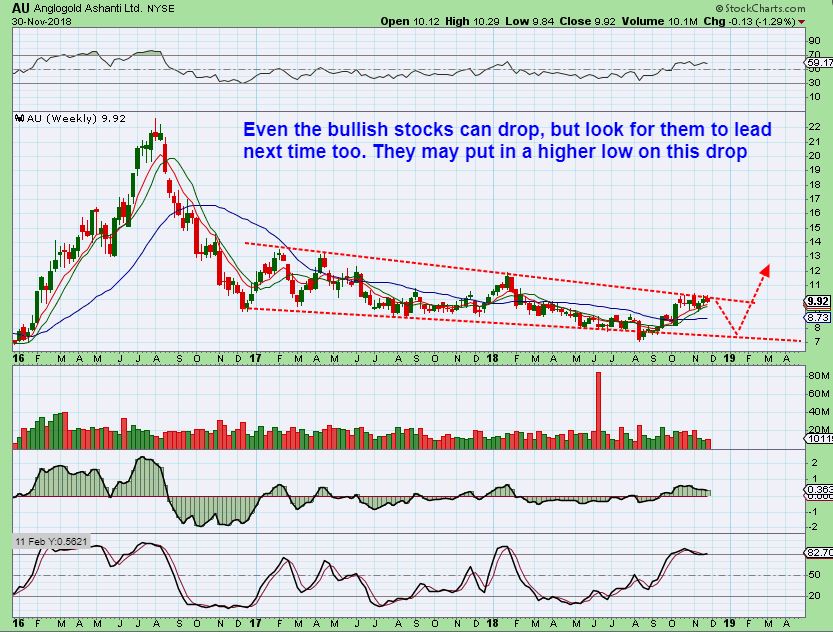
These are recent charts of ABX & AU that were in my report. Notice that, “YES , THEY HAVE BEEN BULLISHLY MOVING HIGHER OUR OF SEPTEMBER LOWS” .
ABX bullishly ran higher.
AU bullishly ran higher. SO DOES THIS MEAN THAT MINERS WILL NOT PULL BACK?
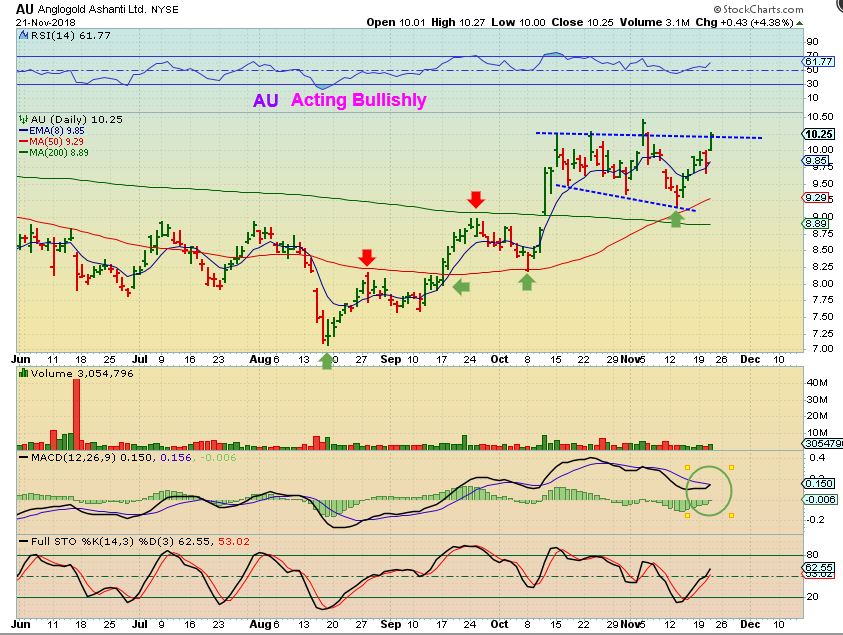
SO DOES THIS MEAN THAT MINERS WILL NOT PULL BACK?
.
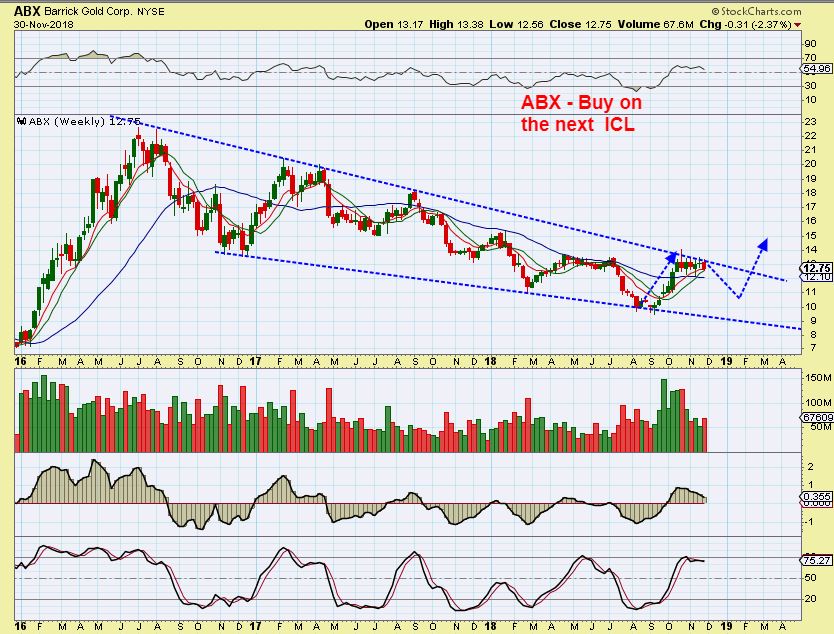
ABX – When I look at the Big Picture, Look at what I found. Normally this could be a sideways crawl preparing to break out, BUT IF GOLD DROPS? This will either
1. Continue to crawl sideways showing strength, or
2. Drop 1/2 way as shown, preparing to break out on the next ICL., or
3. It could drop to the bottom of the channel as a buy.
AU – I repeat, When I look at the Big Picture, Look at what I found. Normally this could be a sideways crawl preparing to break out, BUT IF GOLD DROPS? This will either
1. Continue to crawl sideways showing strength, or
2. Drop 1/2 way under accumulation, preparing to break out after the next ICL., or
3. It could drop to the bottom of the channel as a buy.
This is the weekend of the G20 meeting, and unfortunately the end result could cause a lot of volatility on a day to day basis next week, at least Monday & Tuesday. Remember what ‘Knee jerk’ reactions can do. They can cause a very believable surge in one direction, that only lasts for a day or 2, and then the real direction begins to take hold again. Right now …
.
CONCLUSION:
.
– The General Markets have played out pretty much as expected so far, to the tag of the 50 sma. From the Oct lows I said that I expected a choppy rough sideways bounce to the 50sma, and then we need to see what happens ( break through or rejection. The timing of the G20 could cause a fake break out or fake break down, so I just think that next week is going to be volatile in the general markets too. The Big Picture was shown here to give you an idea of what I am looking at. Big Tech Stocks GOOG, AMZN, NVDA, MFLX, FB, etc have broken their up trend. NASDAQ broke down, etc This causes me to think that the Markets have topped for now. 2019 may be choppy and tough.
.
– The USD is bullish looking, but will be due for a sell down into an ICL in a month or so. If the USD continues higher, I could see Gold begin to drop into an ICL.
.
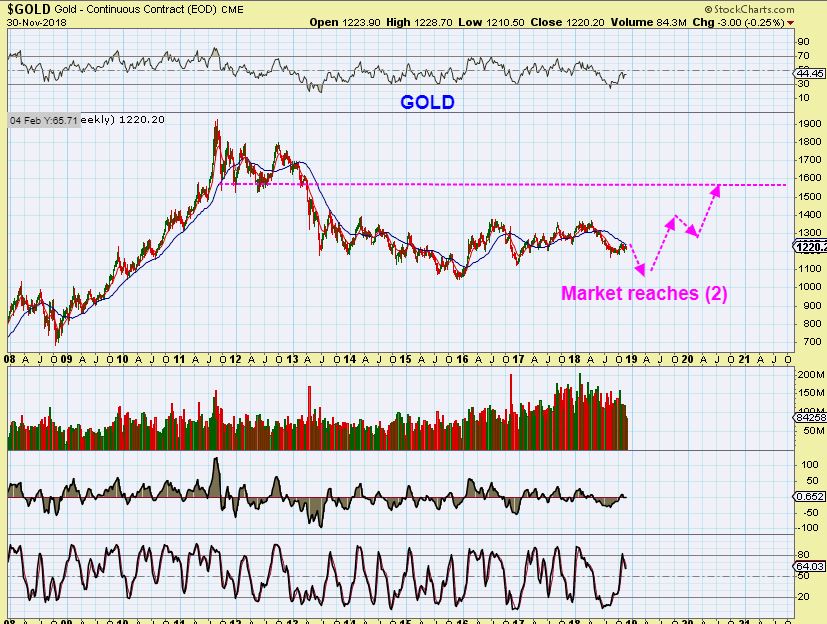
– Gold is now over 3 months out of its ICL in August, so it could be coming due for a Dip into the next ICL, since they often come 5-6 months apart. I know that I have said this before, but this NEXT ICL could be the one that sees a Big Rally . THIS SET UP in last weeks report remains constructive, even with a drop as shown. A BIG RALLY can come from this ICL, as the USD finally tops & drops.
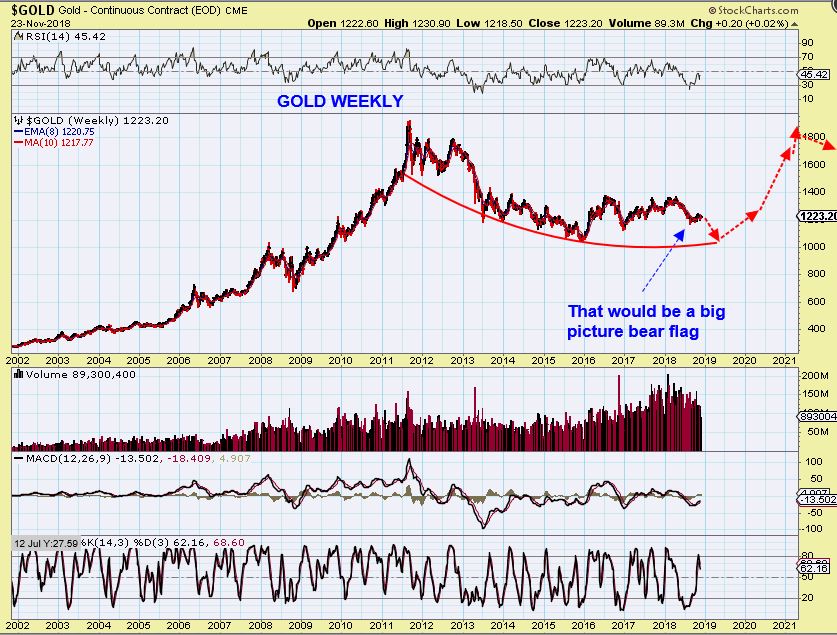
Look at that chart above again. This past move out of the ICL was one of the most disappointing sideways, ‘bear flag’ looking moves seen in Gold, but the BIG PICTURE BASE could be forming for that strong Rally higher. ALSO, WITH THE GENERAL MARKETS becoming Choppy /Toppy, Money might flow into Precious Metals.
.
– OIL is due for DCL & an ICL. We see a DOJI on the weekly, so I explained what that means. They can form as the low, or as a Pause, so stops are important. IT is always best to wait for a proper swing low before going long. That would be OIL closing above the 10sma. The timing certainly is right.
.
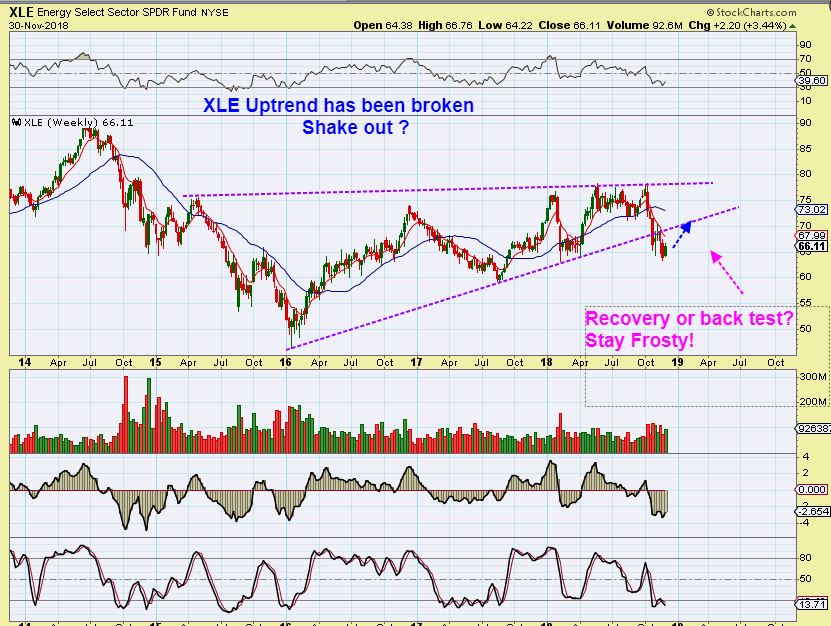
– I went long GUSH, hoping for the bounce, but XLE has broken the 3 year uptrend too, so I’ll watch for a back test or recovery and go from there. This type of a back test would reach the 50 weekly MA too.
.
It was announced that the US Stock Markets will be closed on Wednesday.
.
I just want to close by saying that the volatility that we are seeing in every sector can often be signs of a change taking place. Even a few of the Bigger Tech companies that had what was perceived as bullish earnings, popped and sold off. People or funds are dumping AAPL, GOOG, NFLX, FB, etc. We often see such volatility at Choppy Tops, or at Choppy base building consolidations & Bottoms. It is difficult to make money in this period of uncertainty, so I have dropped my position sizes down and try to find some low risk entries with a Stop in place. I trade for a living, so I am still trading the more bullish looking areas (Solar for example) , but it has still been choppy and difficult for the Buy & Hold group.
Trust me when I say that THAT WILL CHANGE. Once bases form and buyers start redeploying money, rallies will occur again, and we will find them. This can be consolidation or topping in a bull run, so the next trade set ups may not be in the same sectors that ran in 2018, like Tech. Patience in times like this is important. We cannot force a trade, we can only look for the proper set ups until the new more sustainable rallies take hold, or sit out the volatile period and wait for better bases. Personally, I think this big picture is showing us that the Bull Run in the General Markets is topping for now and they will go sideways or sell off for the 2019 year. WHERE WILL THAT MONEY GO? I am thinking that it will flow into the precious metals, and maybe other commodities sectors. A serious sustainable rally in the Precious Metals market is always worth preparing for. If things remain choppy & difficult and you trade, keep position size small. If you refrain from trading, follow along with the analysis and watch how things develop over time. Then when you start to see all of the pieces falling into place for a nice bull run, you will be ready to join in and make some nice gains near the lows. When the Miners run, you really can make big %-Gains quickly on the way higher. It is well worth the wait, because it can more than repair and make up for the paper cuts or losses that came along during the more choppy trading. See my final addition to the report after this sign off.
.
Have a great weekend and thanks for being here at Chartfreak.
.
~ALEX
,
FINAL THOUGHT – SUMMARY OF THE BIG PICTURE POSSIBILITY
.
Even after the first sharp drop in the year 2000, an ICL formed and we see a strong multi week bounce. I labelled it (2) so you could follow along with what may be happening now. GENERAL MARKETS RALLY OUT OF THIS ICL (2) , SIMILAR TO 1999 , and then the sell off resumed. While The Markets run higher to (2) now, Gold drops to the next ICL.
GOLD DROPS INTO ITS ICL SOON AS THE MARKETS BOUNCE FROM THEIR ICL Like 1999 .MARKET DROP AND GOLD RALLIES OUT OF THE NEXT ICL. The long awaited cup could form from there.