JULY 8TH WEEKEND REPORT
I know by now you know how I feel about the Precious Metals Sector, but maybe the Theme Pic will help to clear up any doubt at a glace. 🙂 We will discuss all of the Market Sectors, but the main focus is still on Precious Metals.
.
THIS IS A CHART OF THE SPX FROM FRIDAYS REPORT– The ‘but’ part was simply that I am expecting a L.T. daily cycle after a rally, so I keep that in the back of my mind…
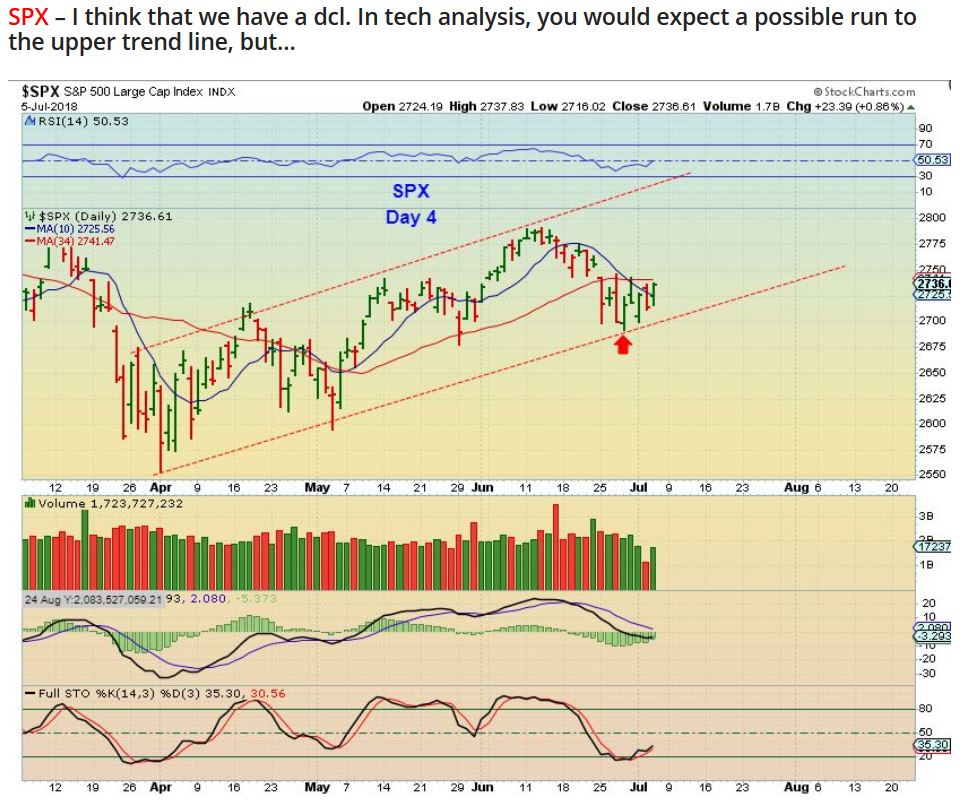
SPX WEEKLY– And we have a weekly reversal that should have follow through higher too. The RSI held the 50% line too, so it is a bullish set up here at this point.

Remember too that a daily cycle can peak on day 15 and still become L.T., so I am not worried as of yet. 15 trading days is 3 weeks.
.
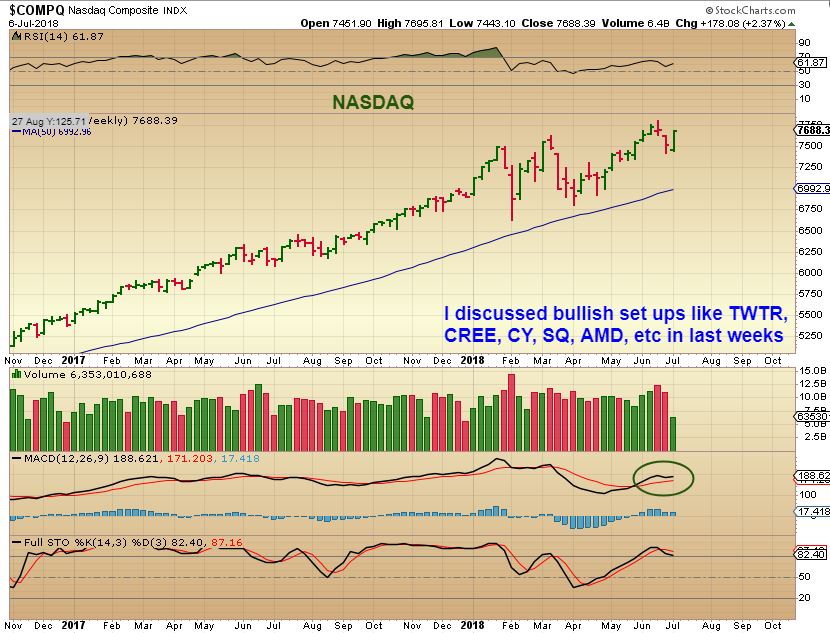
NASDAQ WEEKLY – The NASDAQ Big Picture has been bullish and I would expect a pop to new highs. A stop would be below recent lows and can be raised along the way.
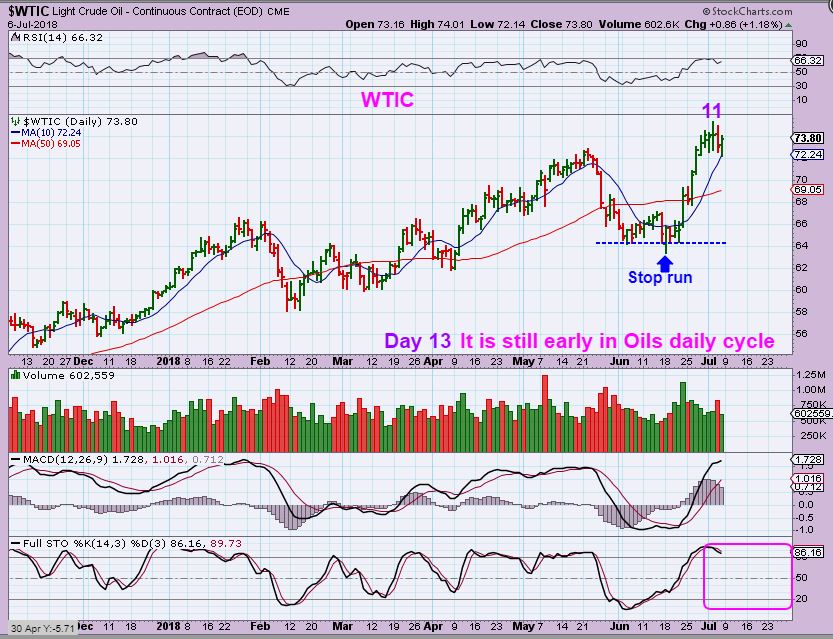
WTIC DAILY – Oil peaked on day 11, and it is still early in Oils daily cycle. It reversed at the 10sma and remains healthy. Oil ran to new highs , but the XLE didn’t follow, so I have been a bit cautious with the Energy stocks. We’ll also look at an XLE chart too…
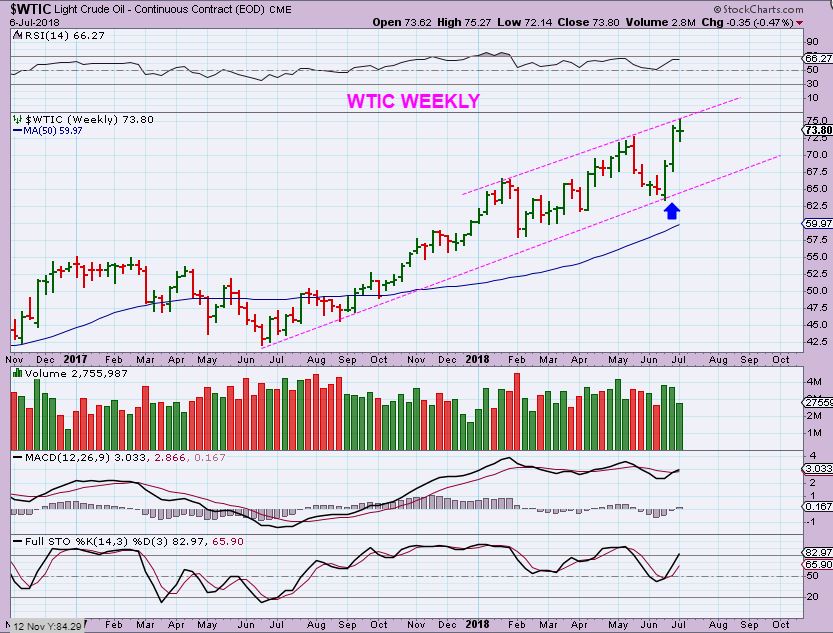
WTIC WEEKLY – Temporary stall? A DOJI is a point of indecision, and it is happening at resistance.
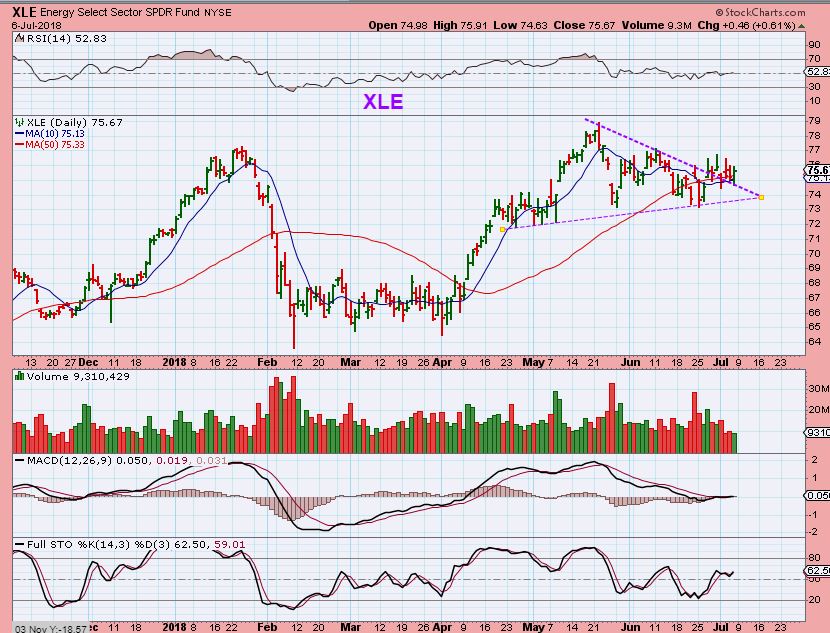
XLE DAILY – As mentioned, Oil ran to new highs , but the XLE didn’t follow, so I have been a bit cautious with the Energy stocks. This set up looks bullish though, since it regained the 50sma and back tested a break out. Some Energy stocks are shaping up, while others are not, so I would be choosy in this sector and we’ll see how things unfold.
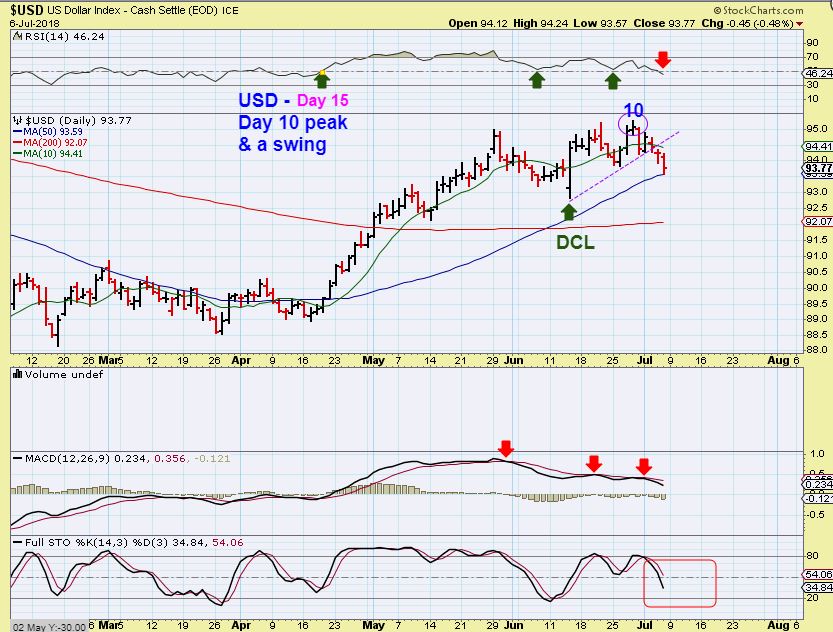
USD DAILY – We have a swing high after a day 10 peak. The dollar is at the 50sma support, but it should break down eventually, in my opinion. It has weakened over time, as discussed in prior reports.
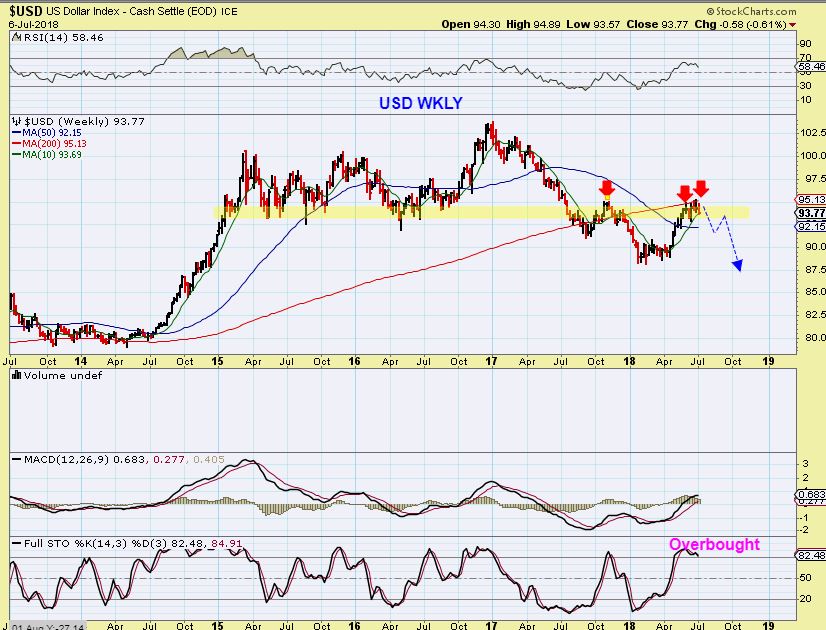
USD WEEKLY – I have been showing a few charts similar to this over the past couple of weeks. I’m expecting this area of resistance to top the USD.
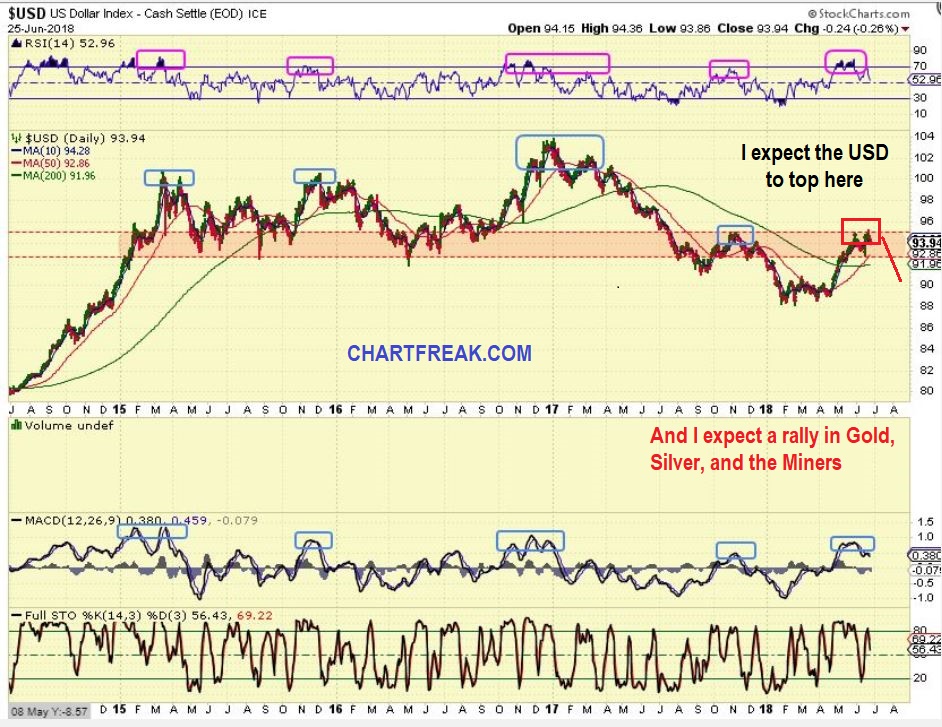
USD WEEKLY – The updated weekly version shows the 200 week m.a. has acted as resistance.
1. The USD is coming due for a drop into an ICL soon
2. It is overbought and the Stochastic has plenty of room to drop
3. This would be good for Gold
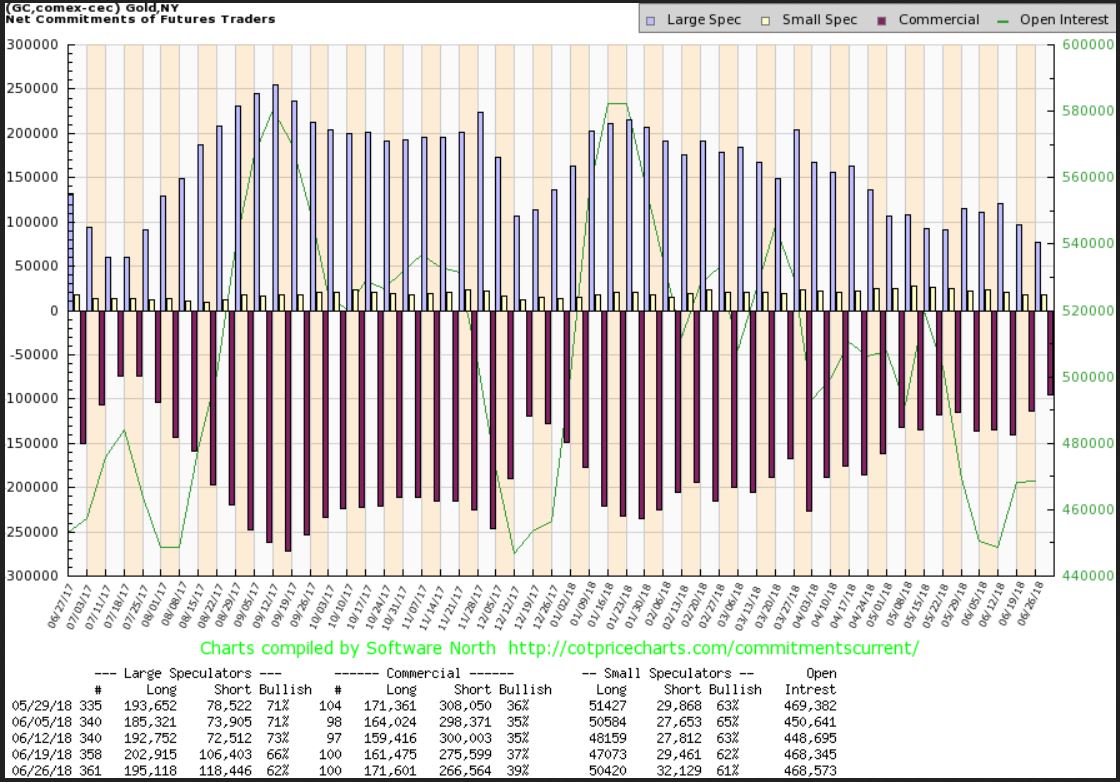
GOLD C.O.T. – The COT shows that Smart Money as of the end of June is now set up almost the same as they were at the Dec ICL. Smart money has closed shorts, while Large specs have sold their long positions into the Gold sell off. They always seem to sell off into the lows.
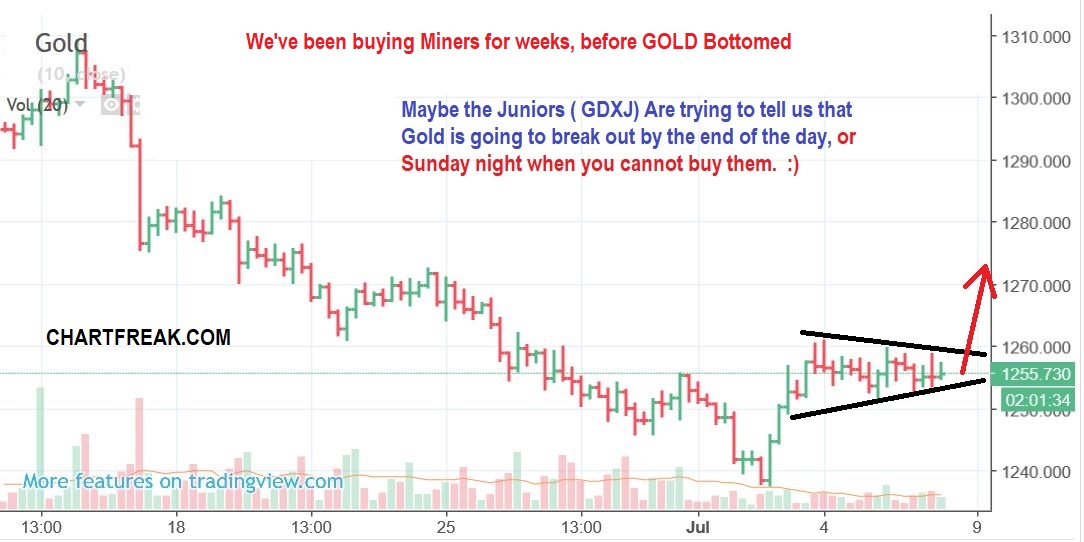
GOLD DAILY FRIDAY MORNING – I posted this in our comments section friday morning to show another view for Gold as it goes sideways here.
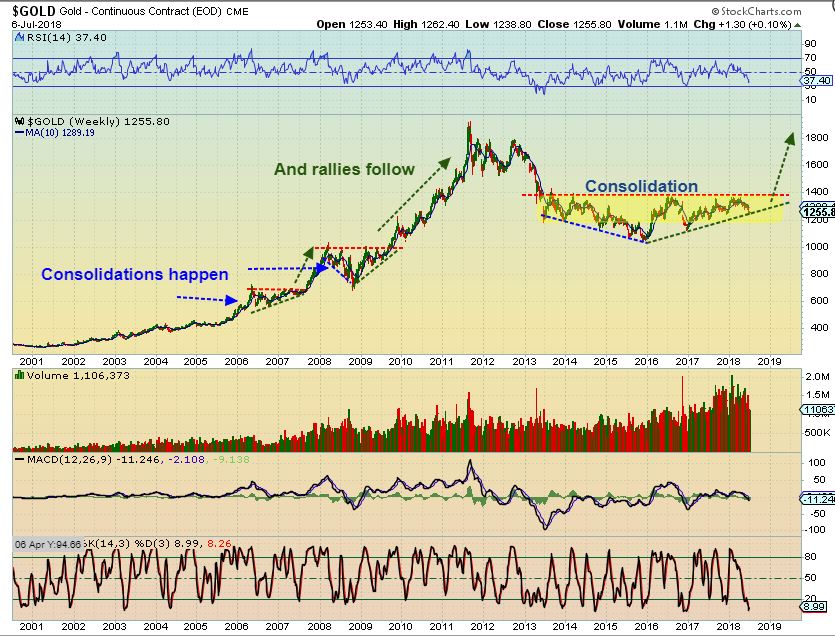
GOLD WEEKLY – We have a weekly reversal, as expected due to the timing that Gold is in. This weekly reversal is likely going to be our next ICL. We do not have a ‘confirmed swing low’ yet, but in Fridays report I mentioned that Miners do on a daily chart and they seem to be indicating that Gold is putting in its ICL too. In other words, Miners are leading the way…
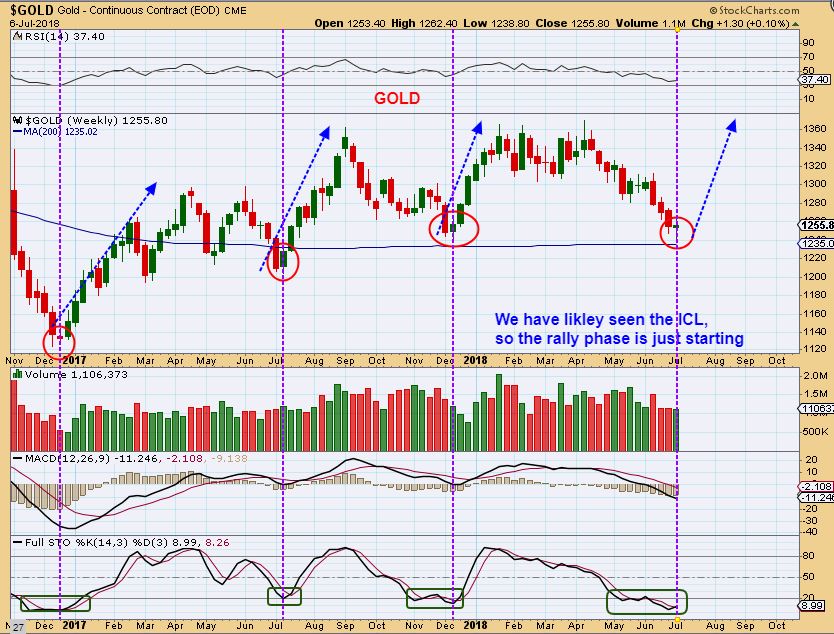
GOLD WEEKLY CONSOLIDATIONS – If we break out above this base, the rally could be spectacular. We’ll ride this ICL higher and see if we can get through the top of this base.
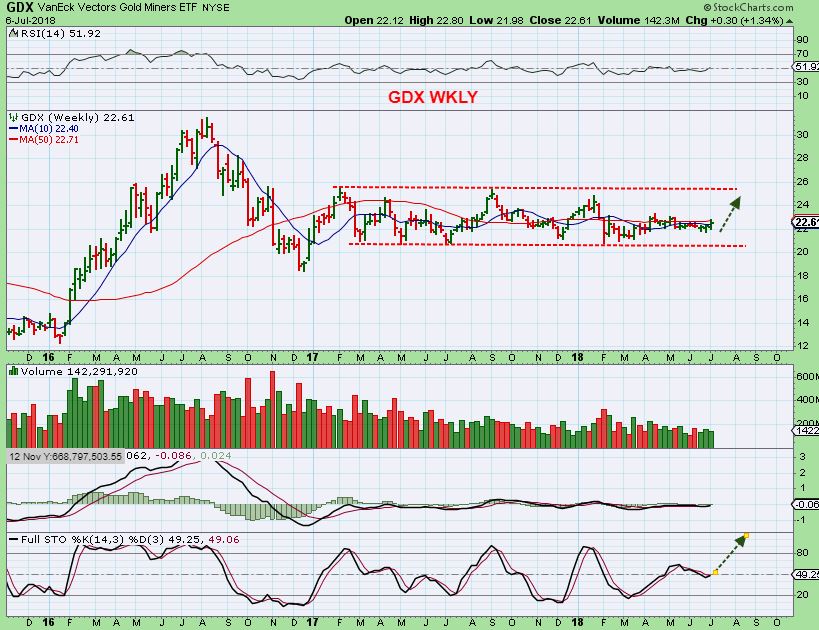
GDX WEEKLY #1– As GOLD & SILVER sold off to their new lows, the Miners did not, they have held up nicely.
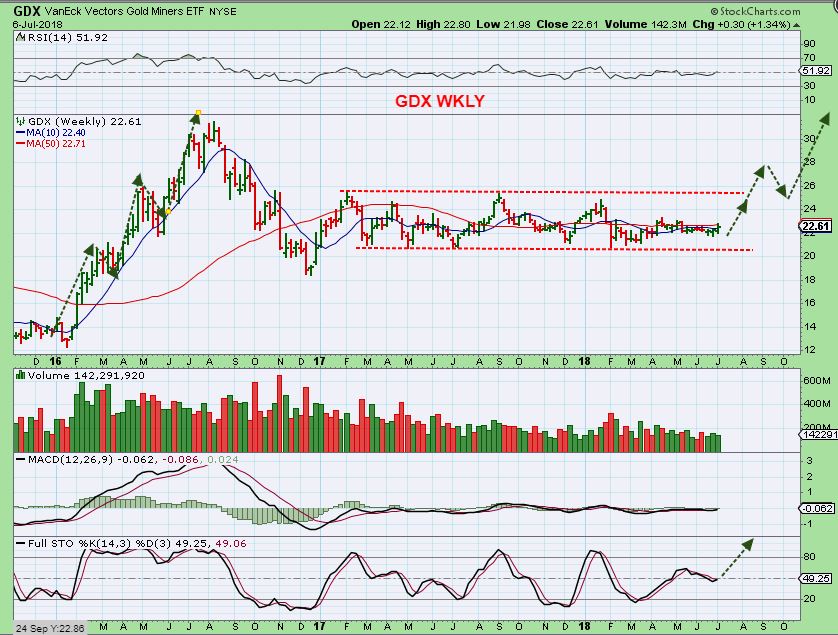
GDX WEEKLY #2 – I am really not just expecting another ‘small rally’ in Miners, I think we are going to get a large rally that leaves many doubters behind. Miners have already been showing strength vs Gold, and I think that we could be ready to see a continuation of the Bull run that started in 2016. See the chart…
.
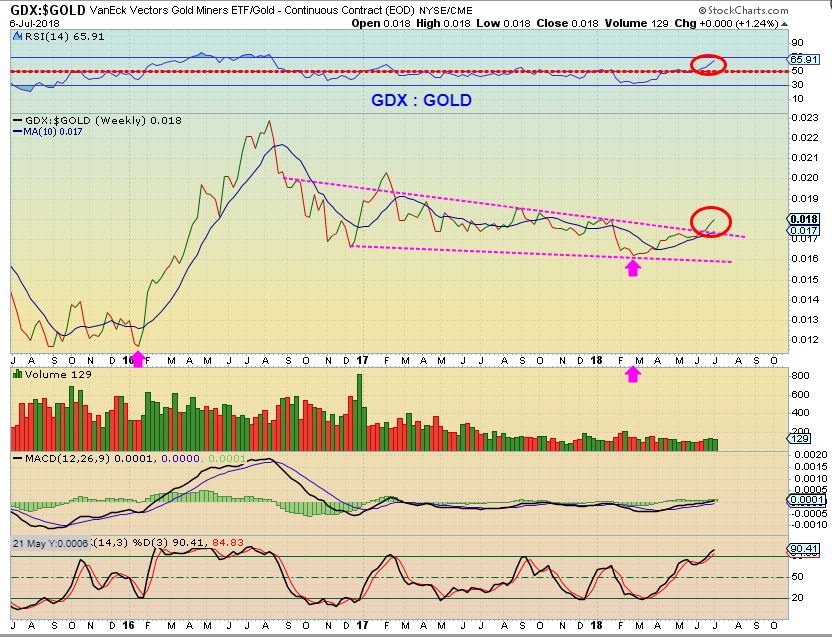
GDX VS GOLD – MINERS ARE NOT ONLY LEADING IN A BIG WAY HERE…
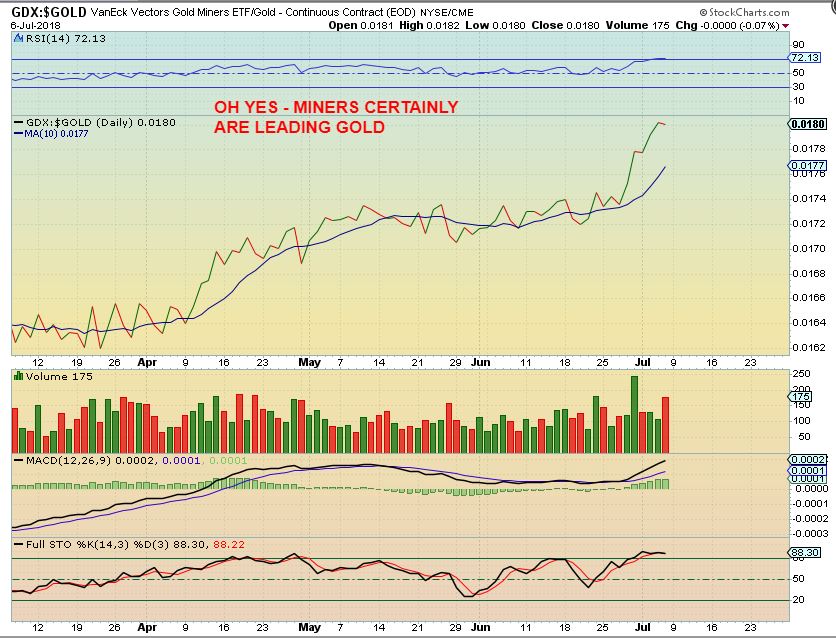
GDX VS GOLD BIG PICTURE – Miners have actually been outperforming GOLD for months. Do you remember when I mentioned the FEB lows as looking important? We have discussed KL, GORO, RGLD, and others as leaders. Now we even have a GDX:GOLD break out. The RSI is bullish and Miners are Bullish. The best part, I still get the occasional comment in Email or the comments section with fear and unwillingness to buy, even though the person really wants to take a trade. THAT is bullish too. It shows that if Many others are feeling that way, they will be chasing later & keeping the rally going.
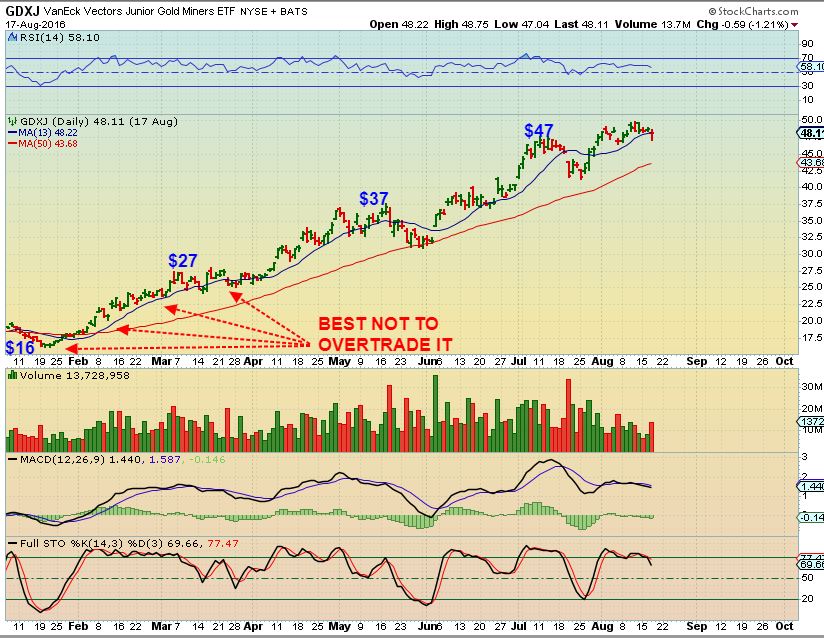
GDXJ DAILY– When I look at a chart like this, I see immense potential in the upside rally after this breaks out. Read the chart.
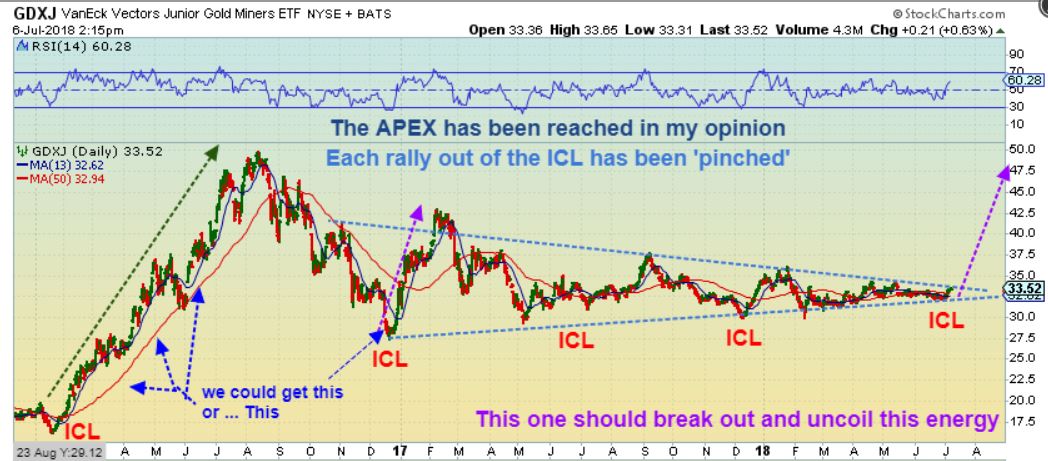
People are complaining that each ICL rally seems smaller than the last, but when you look at that GDXJ chart above, you can easily see why. It is not just due to ‘weakness’, but instead, A Triangle or Wedge is forming since that massive 2016 rally. People have been lulled to sleep. “The Miners are weak and boring” they say, and eventually this should explode higher. Price is Pinched.
.
I am being asked, ‘Are you selling your GDXJ ( JNUG) position already?’ Some have mentioned that their gains looked good so they sold everything, and will just buy the dip. I tell people that if they are happy with gains, or nervous about giving them back, sure – go ahead and take some profit, but personally, I did not. Day 5 is a bit early with what I am seeing, and . I Need to show you some charts.
.
As for me, we are basically on day 5, so let me show you something. Below I will post a few GDXJ RALLIES FROM ICL LEVELS. You may decide to sell on the way up, you may take partial profits, but I’d rather take my chances and ride the bucking Bull for a little bit longer when an ICL is involved. Here is why…
.
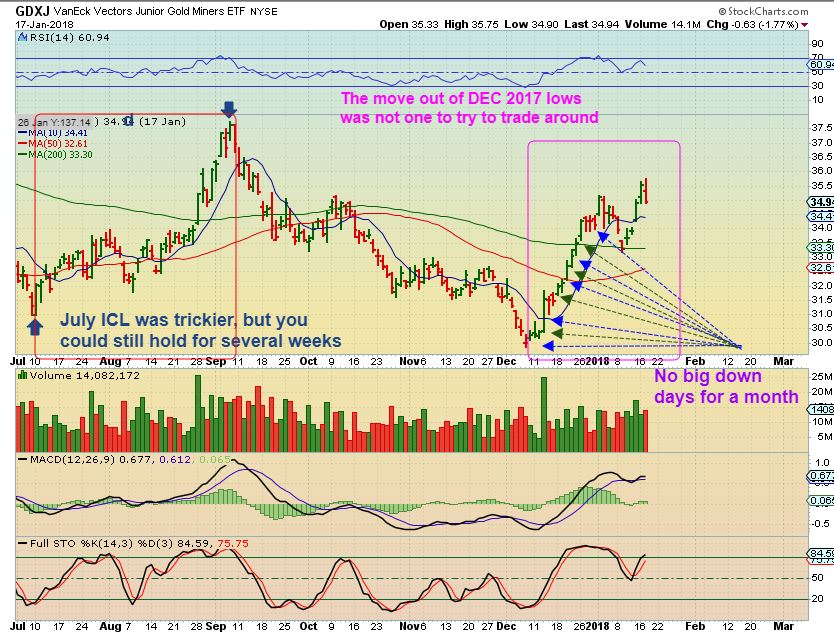
GDXJ DEC 2017 ICL RALLY – Search for a nice pull back after the move out of the ICL. Where would you re-buy if you sold at 5 days ( or even 10 days, even 15 days). Hmmmm. 15 days out of the sloppier JULY ICL also really did not offer a good entry, it was after 15 days that a real dip came.
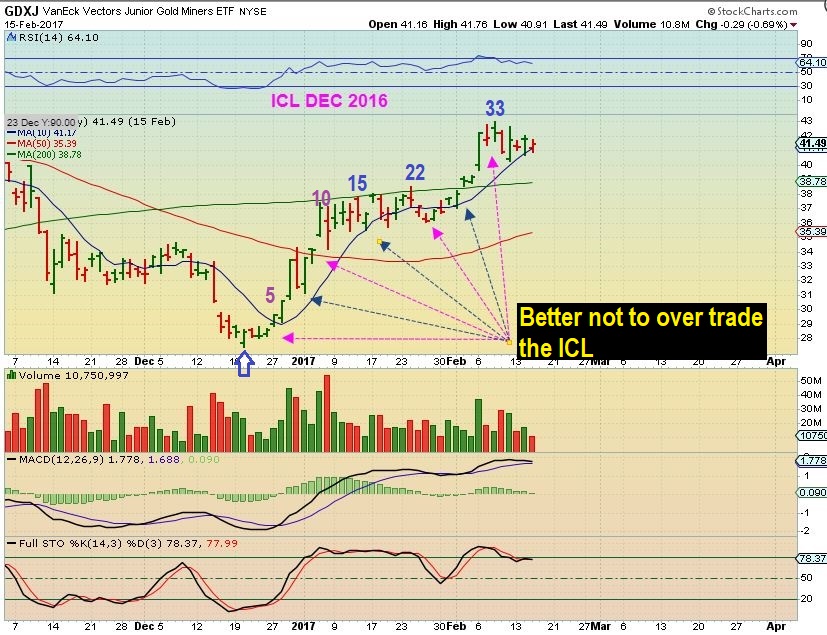
GDXJ DEC ICL 2016 – Count 5 days, then count 10, then count 15 days. You could not buy a dip there. How does selling on day 5 look on this one?
GDXJ DEC ICL 2016 RALLY – And of course we have a super rally from Jan 2016. GDXJ ran from $16 to $50 and the pull backs were so shallow that people had a very hard time buying back in, just waiting for “that Drop’ that never really came along until May.
.
I almost hate to show what I am about to show, because I do not want to suggest any kind of a ‘get rich quick scheme’ that could hurt someone, but let’s look at JNUG during those time periods.
.
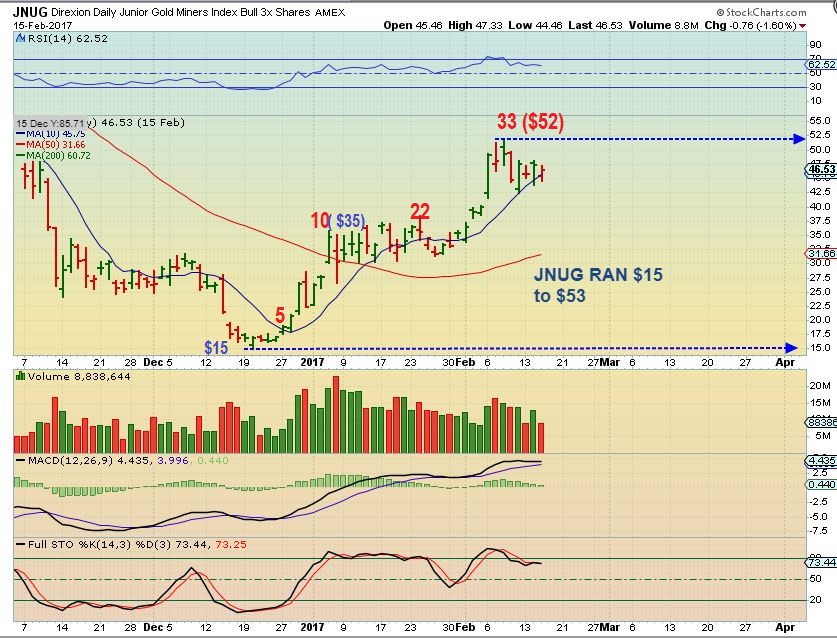
JNUG DEC 2016 ICL RALLY– That small 33 days rally took JNUG from $15 to $52! GDXJ ran up over 30% in 10 days on that very steep climb, so JUNG doubled by day 10.
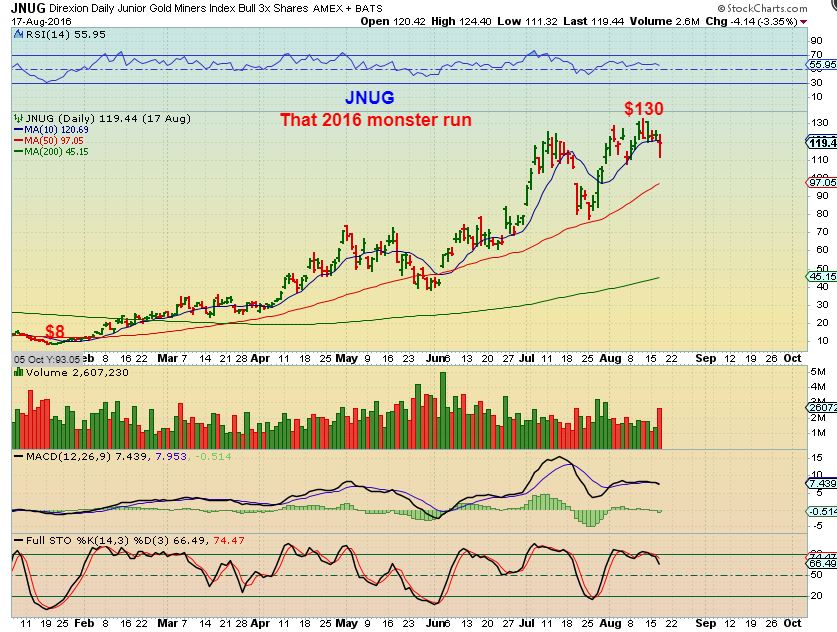
JNUG JAN 2016 ICL RALLY – I HATE to show you all this, but selling on Day 5 seems a bit premature here, right? Sidenote: Trust me, this was NOT an easy ride. It dropped from $70 to $50 a few times in May. It dropped from $125 to below $80 in July, but what I am saying is that I want to hold for more than 5 days and see what happens going forward.
This has been your weekend Big Picture Report. As mentioned in the daily reports, I am mostly focusing on the Miners in my personal account right now, and this report should help you to see why. We are due for an ICL, a deep meaningful low that only happens twice a year, and it can lead to solid reliable gains after the lows are in place. Also as pointed out in several of the daily reports, quite a few individual Miners are already running away, while GDX & GDXJ linger around, probably fooling many into believing that ‘Miners are not doing anything yet’. The GDX:GOLD chart and BPGDM, along with other analysis tells us otherwise.
.
We’re looking for GOLD to get some follow through higher soon. If it does, and it closes above the 10sma, that would give us further confirmation that an ICL in Gold is in place. The weekly reversal seems convincing and the Miners are already leading the way. I look forward to next weeks action in the precious metals sector for further clarification.
.
Enjoy the rest of your weekend, and thanks for being here at Chartfreak!
.
~ALEX
..
DIFFERENT WAYS OF LOOKING AT THE SAME THING WHEN LOOKING AT MINERS
.
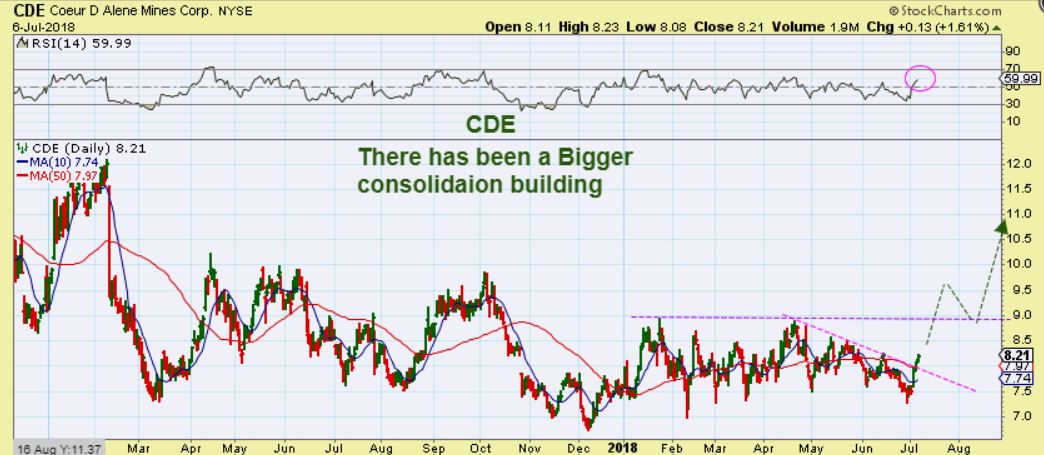
CDE #1– CDE has had many small runs in 2018, green arrow to red arrow. I would say that people that own it may even be a bit sick of it. What you want to do is step back and get a bigger picture view of the situation. As noted in prior reports, CDE did excellent in 2016.
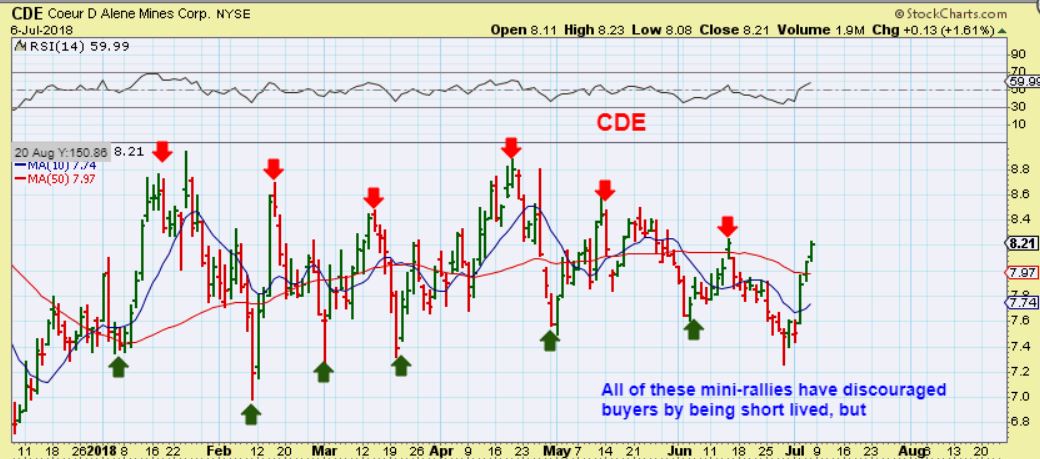
CDE #2 – So stepping back, we see a ‘Base’ is forming and a break out & run could tack on some nice gains rather quickly (Silver stocks do run quickly once they get going). However…
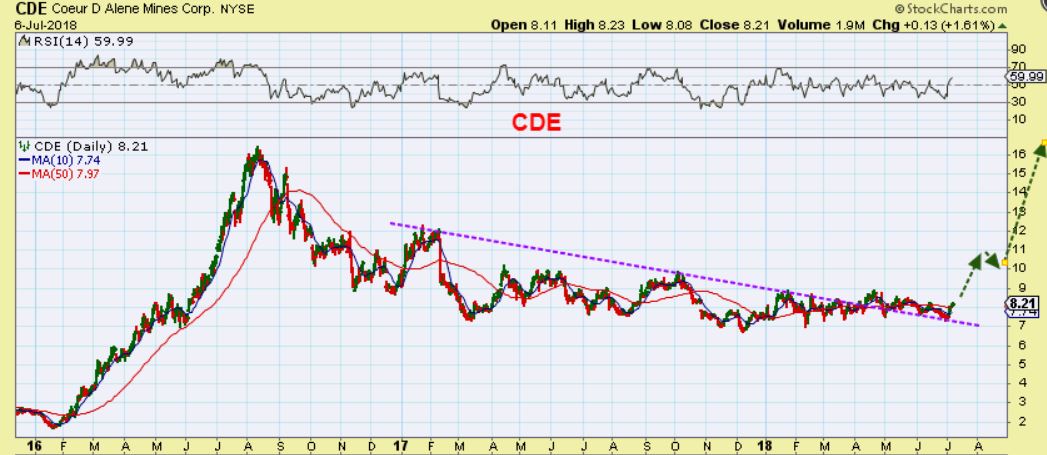
CDE #3– Really take a step back and look at what you are dealing with. Look how CDE ran in 2016, from under $2 to $16! This year of 2018 has been the bottom right hand side of what looks like a massive base that could form a cup on a run higher. CDE from $8 back to $16 would be nice, and then a break out could send it even higher, if these rally like they did in 2016.
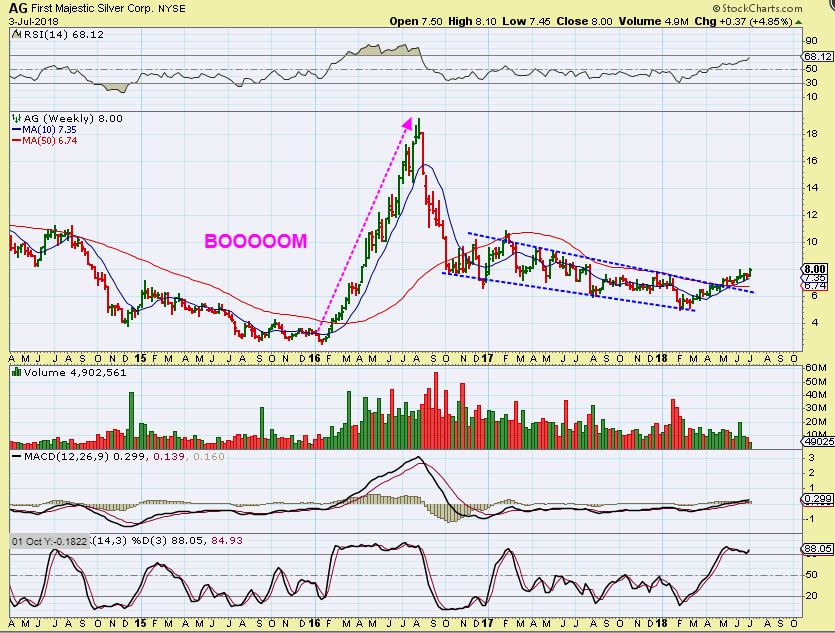
When I was pointing that out in AG in APril, it looked similar to CDE now.
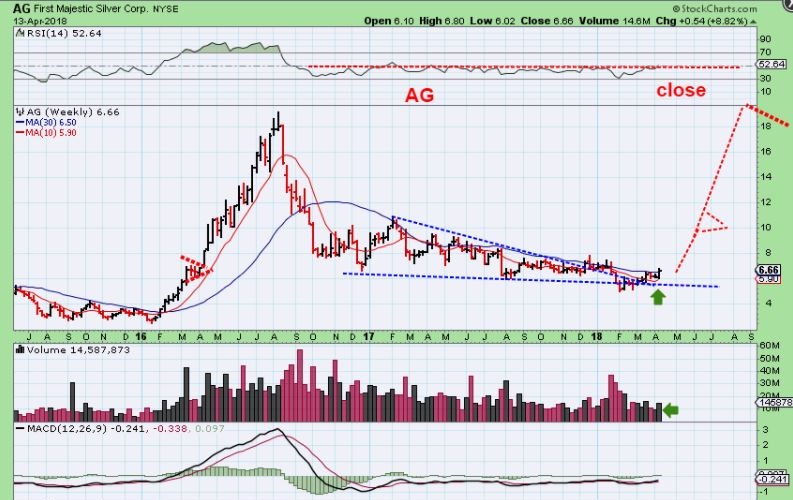
AG – And Since those Feb lows, AG has begun to put in a steady run higher, also likely forming the right hand side of a cup. It has don this WHILE SILVER SELLS OFF. Imagine when Gold & Silver run higher out of an ICL? CDE, AG, and other Miners should both do very well.