
THE BIGGER BIG PICTURE
This weekends report is going to be a bit different. I often give the Big Picture review, and with that, we have been discussing since last January the possibility of a Blow Off Top / Parabolic move resulting from the general markets’ bullishness. Well, this is going to be an even Bigger Picture discussion, with a few shorter term charts at the end for update purposes. It is a long detailed report designed to answer many emails that I have received about the bigger big picture , so grab some coffee or tea and let’s begin…
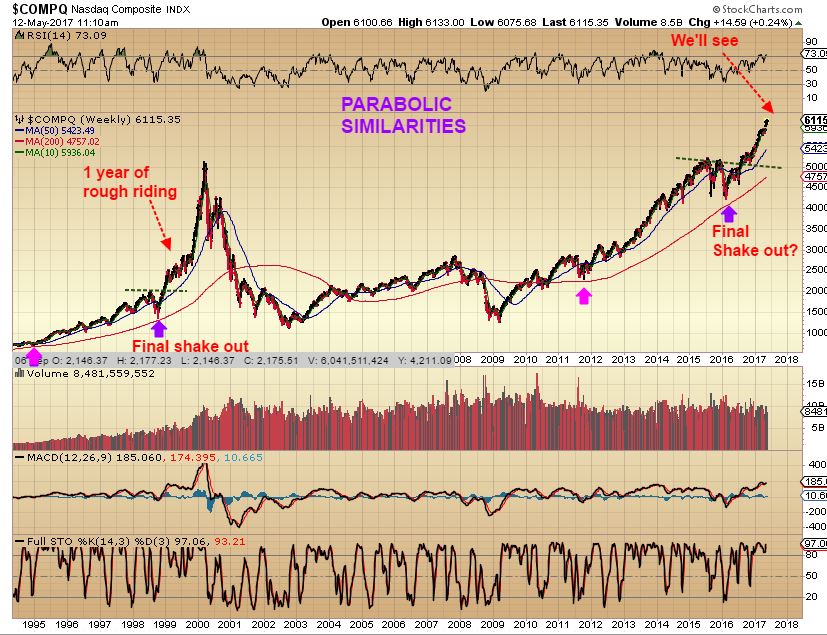
NASDAQ – This chart was from last May. I posted this idea of how the current rally that we were seeing could be becoming parabolic. Parabolic moves seem like they will never end, and you’ll hear that “Nothing can kill this market”, and it feels so true. Then suddenly, they die a brilliant death as you can see in the year 2000. See the chart below, where we examined similarities of a final shake out consolidation, a ramp up with somewhat choppy trading that would still having higher lows, higher highs, and then the final Ramp higher…
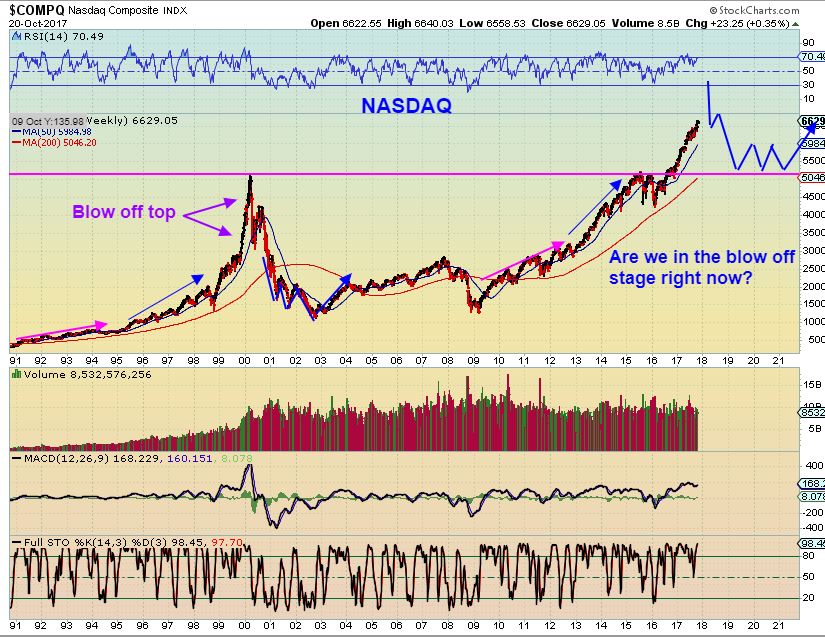
NASDAQ – Here we are now and the choppiness with higher lows and higher highs seems to be playing out now, and a blow off top would follow. OR, is this the blow off top in play as it just continues higher? This move is verticle and could lead to the blow off top. Just ride it long. I have drawn in a post blow off top scenario with a normal ‘back test’ of the break out. Let’s dig in further…
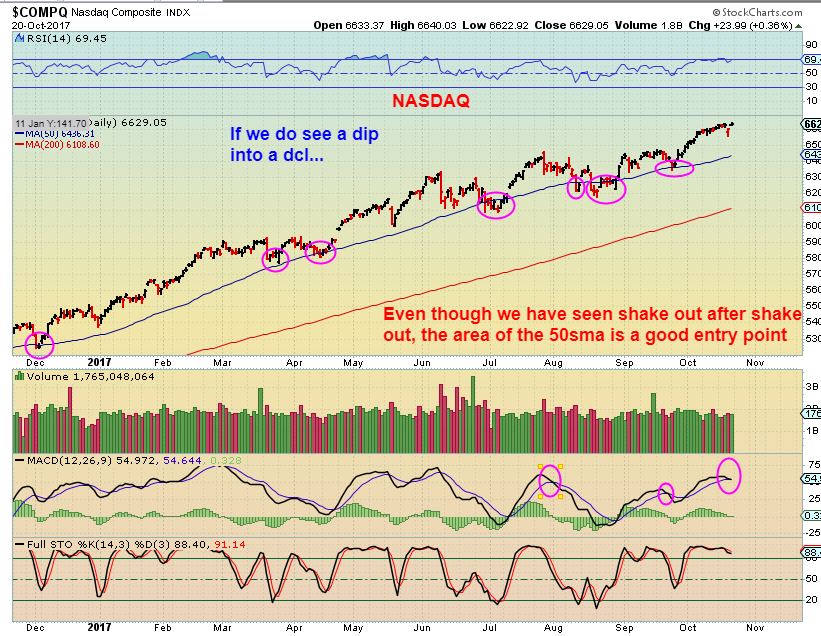
NASDAQ – Currently, the ‘choppiness’, when examined close up, is normal. I have advised buying with a reasonable trailing stop. Each dip to the 50sma can be bought as a low risk entry. Was that tiny dip the DCL, because we are so late into this current daily cycle? I’ll show you why that could be possible later using the RUT AND TRANNIES. If it isn’t a dcl, and we get a dip to the 50sma (even with a shake out there), that would obviously be a ‘buy’- please read the chart. THis is a healthy strong bull run.
Now let’s also look at the BIGGER PICTURE SPX, RUT, TRAN, DJIA
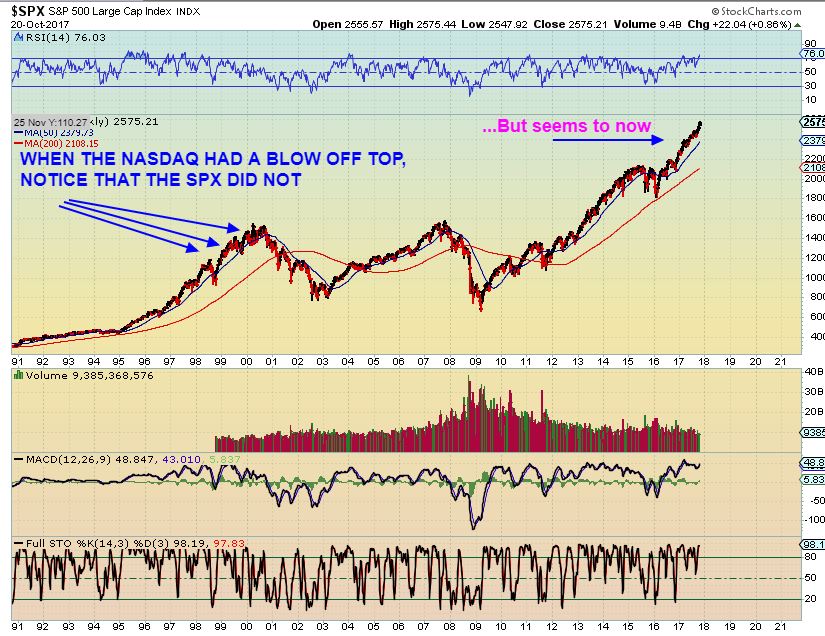
SPX – Please read the chart and notice that the SPX already actually looks to be rising in parabolic fashion, with 5 pretty clear waves higher not quite yet complete. Reminder: This may not be at it’s end, but be assured that a Parabolic run does not go on forever. They eventually die a brilliant death ( Thats the BIGGER BIG PICTURE) .
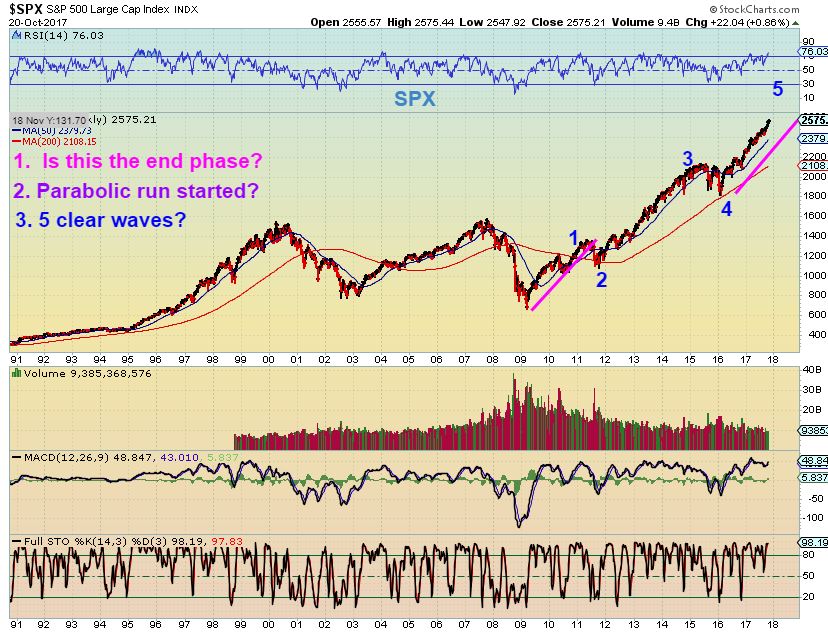
SPX – This was an important fact that I noticed. When the NASDAQ had a parabolic blow off top, The SPX did NOT. It is now. This is important, and I will explain why later, but for now, THIS TIME The SPX does look to be running in more of a parabolic fashion too. This may be leading to a blow off top.
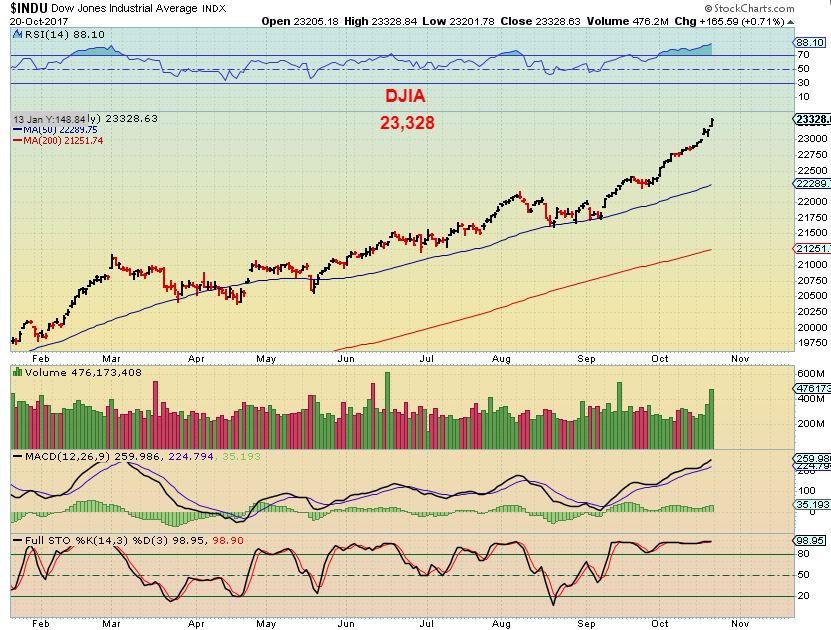
DJIA– This is the DJIA now, and it is running strong, looking parabolic too. IBM reported strong results and Gapped the Dow higher last week. After this long sideways choppy(ish) year, even the DOW seems to be joining in on a possible parabolic type of vertical move starting in May, but especially now since September.
DJIA – AGAIN I THINK this could be important to notice. Look at the DJIA in 2000, when the NASDAQ had that year 200o parabolic blow off top. The Dow simply ran higher & went sideways in 2000. It did NOT have a blow off top type run, but it does appear to be having one now, right? Compare 1999 to 2017.
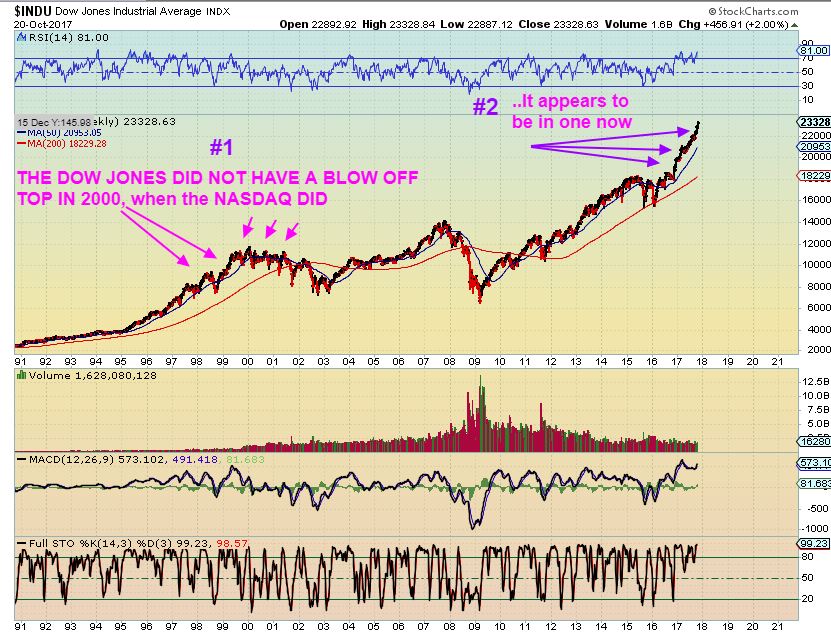
WHY IS THAT IMPORTANT? It shows me that when the Tech Bubble gave the NASDAQ a blow off top in 2000, not all sectors had to have that type of blow off top when the end of the run came. So now, at this time, I would not expect every single sector to have that blow off top type of a move. I do see it in the SPX, DJIA, and NASDAQ at this time, but the Trannies do not appear to be moving that way, and the RUT / IWM may or may not. Let’s review.
.
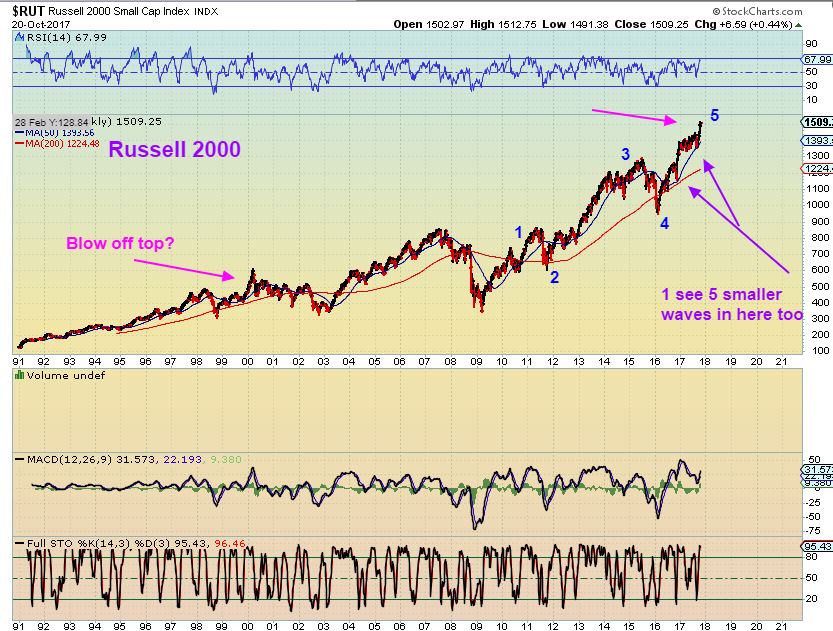
RUT – RUSSELL SMALL CAPS – There was a small ramp up at the end of the 2000 run, but not a huge blow off top in 2000 like the Nasdaq (Important?). Here we see a possible 5 wave run in the last 9 years and a pretty straight up rally at this time, but similar to what the Rut did in 2000.
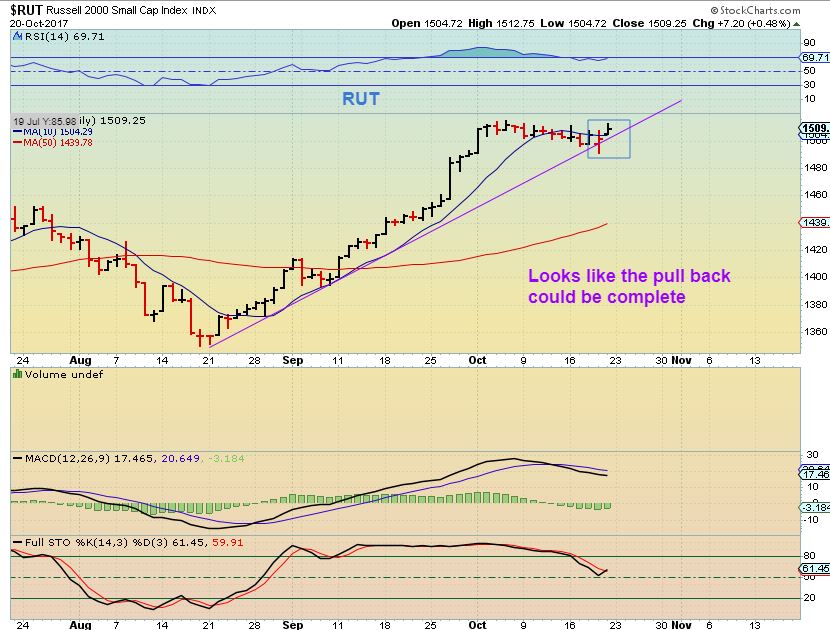
CURRENT VIEW RUT DAILY – This is how straight up it has been. The recent consolidation could be the dcl, with a trend line break and a close below the 10sma & recovery. This is 1 reason why I think we may have the DCL in place across the board, because the dip shows up in some markets, though a dip in the NAZ, DJIA, and SPX are not evident. This is a BUY in my opinion.
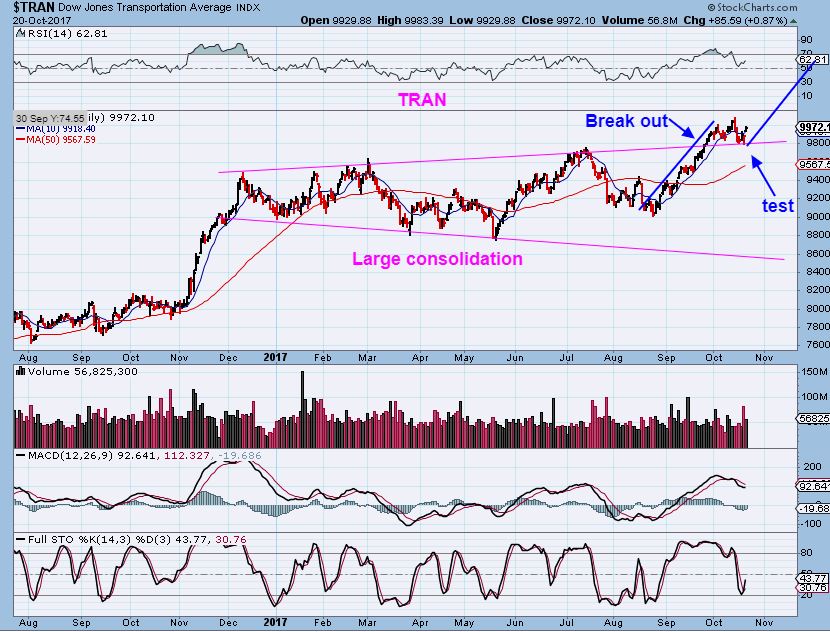
TRAN DAILY- The transports seem to be starting to ramp up since August also, now with a back test for a possible DCL. This doesn’t look parabolic, but it doesn’t have too. In 2000, not all sectors went vertical, but they all had good gains. A DCL looks to be in place here too. A dcl may be showing up in the RUT & TRAN, though the dips in NAZ, DJIA, and SPX are shallow & one or two days down because they are running parabolic now.
ALL OF THIS POINTS TO THE MARKETS LIKELY CONTINUING HIGHER, POSSIBLY EVEN INTO THE YEAR END, AND POSSIBLY IN A PARABOLIC TYPE BUYING FRENZY, WITH NORMAL OCCASIONAL PULL BACKS
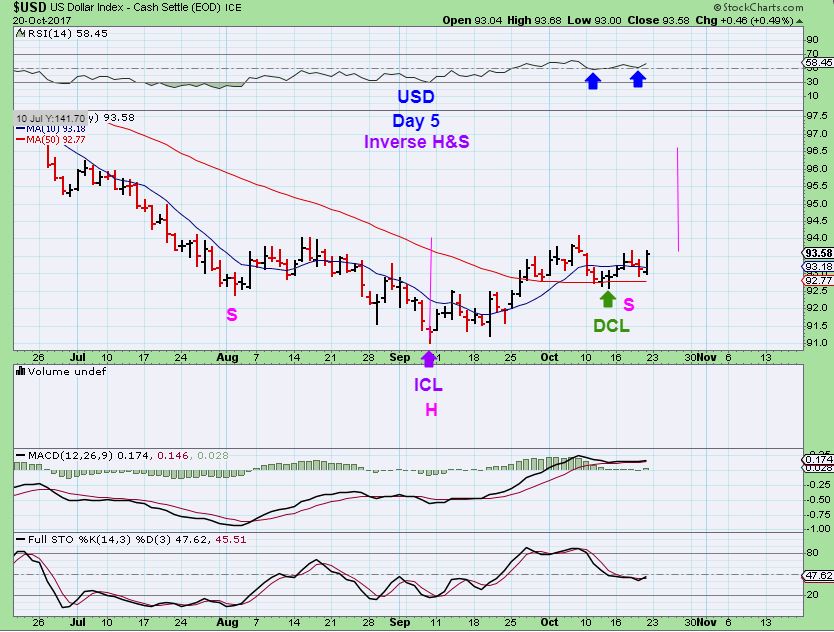
USD – The USD is playing out exactly as expected. It put in a YCL , ICL, and formed an inverse H&S. I have said that I expect that the USD can run to the 97 area. This will hold Gold down, we will discuss that bigger pic too.
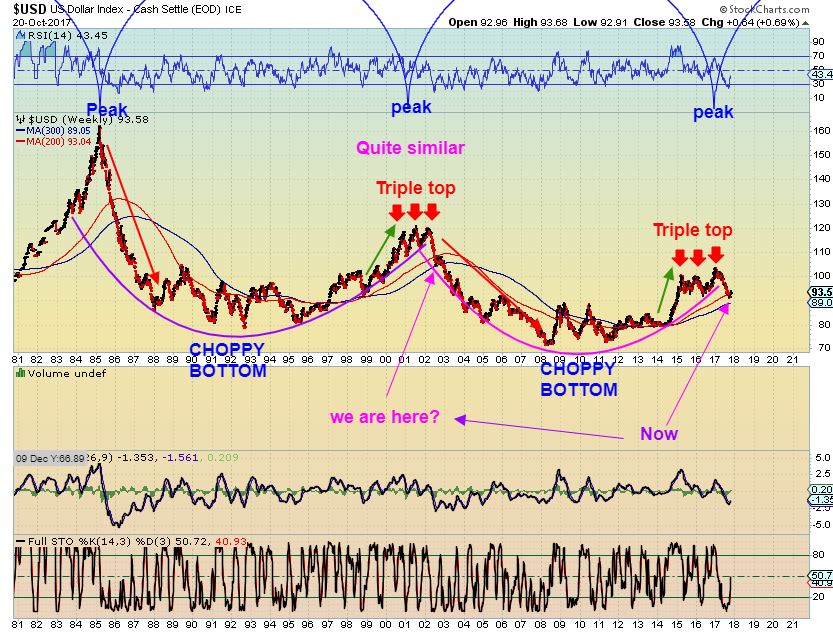
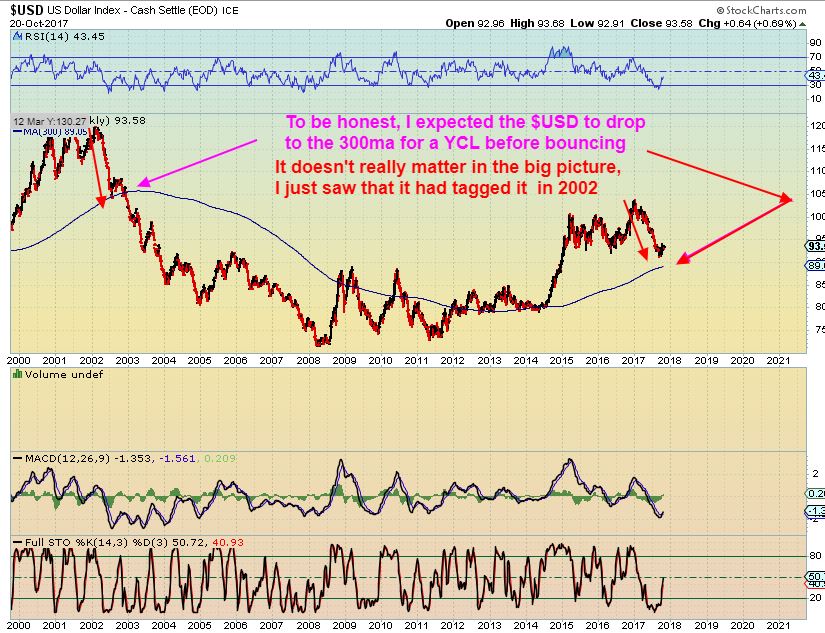
USD – Do you see similarities for the BIGGER BIG PICTURE? A Triple top near 2000-2002, then it dropped sharply to the 200/300sma, bounced & continue down. See the chart “we are here?” area for the ‘bounce’.
USD CLOSE UP OF THE ‘BOUNCE’ – I actually expected the USD to bounce off of the 300sma like it did in 2002 as seen in the chart Above, but it bounced off of the 250 sma area.
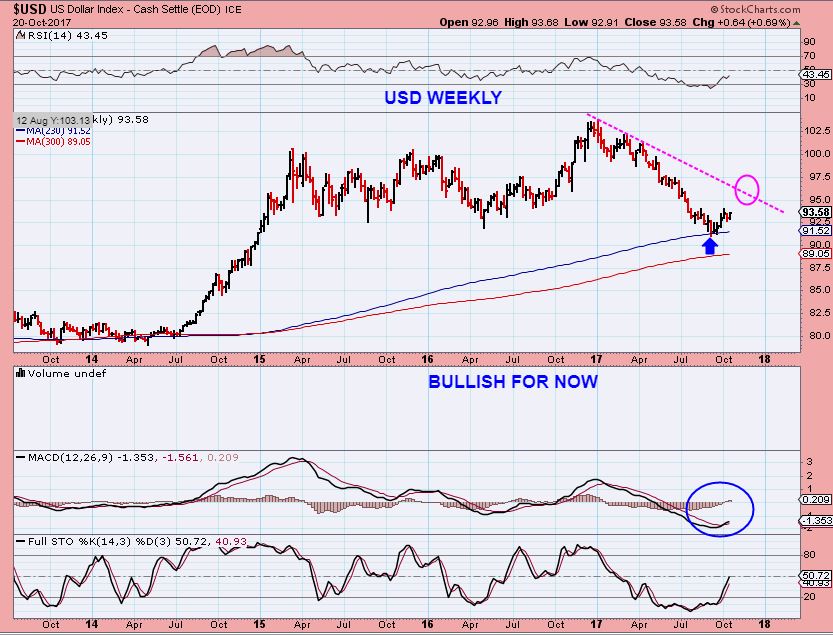
USD tagged the 300sma in 2002 and bounced.
USD BIGGER PICTURE- Please read the chart
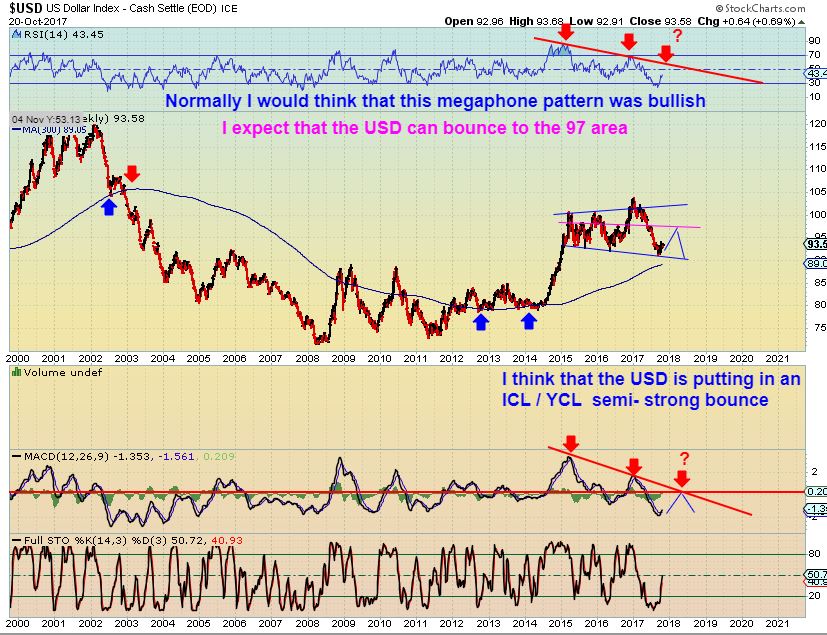
SO THE USD HAS SOME UPSIDE LEFT IN IT, AFTER PUTTING IN A YEARLY CYCLE LOW. THIS SHOULD PRESSURE GOLD MOVING FORWARD, BUT PRESENT AN EXCELLENT BUYING OPPORTUNITY LATER TOO.
.
PLEASE NOTE THIS: I am discussing that the markets could be heading toward a blow off top type move, similar to the Tech Bubble of 1999-2000. It would be beneficial to see what happened in that BIGGER BIG PICTURE time period in other areas too. We will do that now.
When the TECH BUBBLE Popped and earnest selling began in 2000 onward, the markets began to fall back to earth and consolidate those great gains, where did that Money end up going? Commodities. Let’s look at Oil / Commodities / Gold.
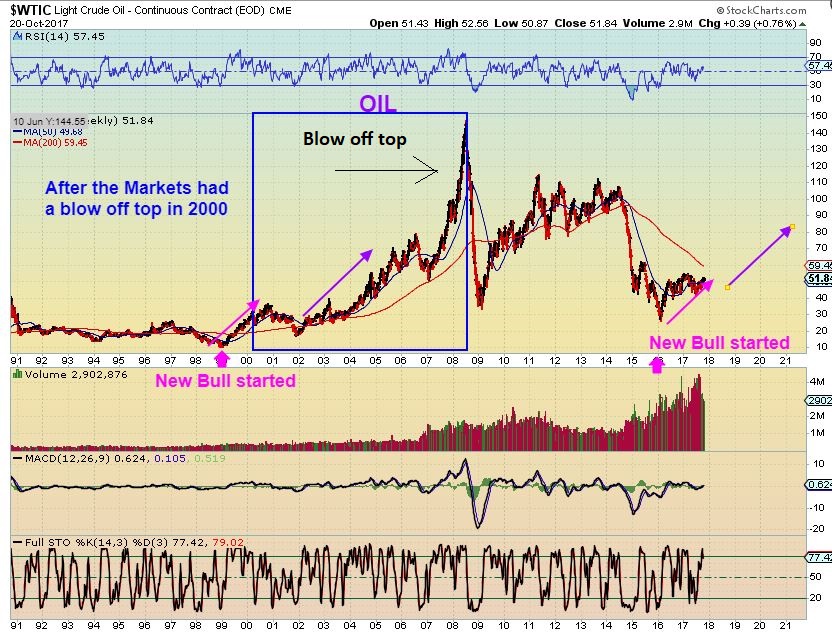
WTIC – Notice how OIL bottomed early in 1999, as the General Markets went parabolic. Oil went sideways and ran a lot higher after that blow off top in the NASDAQ. So, Oil bottomed and began a new bull market. Currently, Oil has bottomed already again and we caught that low right at my target of OIL $26. The next leg up may start soon as the general markets top.
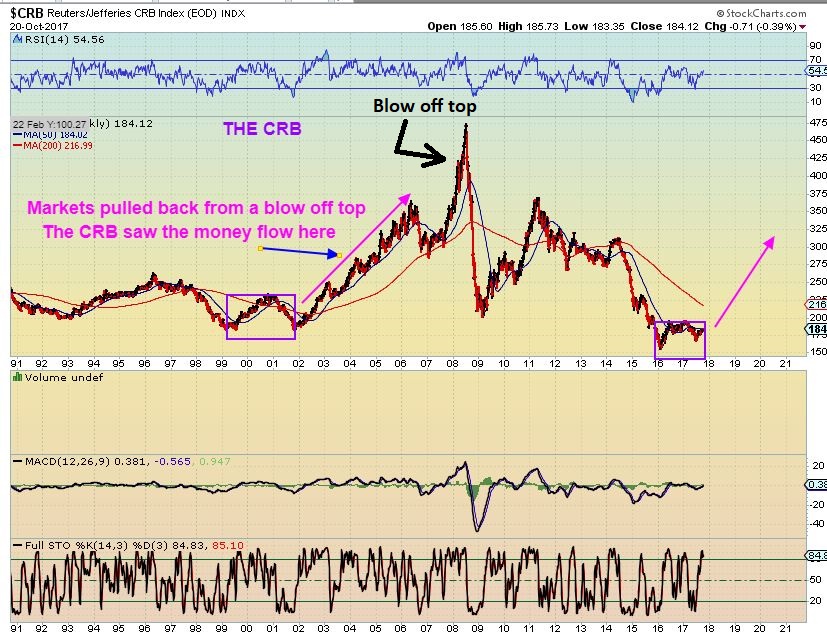
CRB – The CRB also tried to bottom a yr before the markets topped in 1999. After the year 2000, when the TECH BUBBLE BURST, the CRB bottomed and began to climb higher. It is also doing that now .
PRECIOUS METALS – The Market we all know and love to trade!
Note: I am not a ‘GOLD BULL’ as they are known, but I have done very well in this sector. I have shorted Miners on many occasions, but I do love to trade this market on the long side for the incredible gains that it offers, so let’s take a look at the Bigger Big Picture here too.
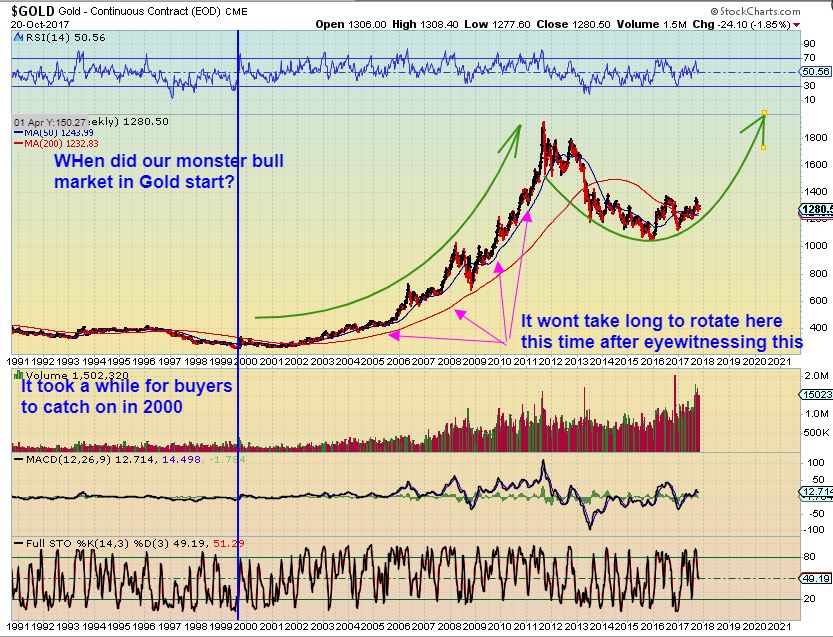
GOLD – We all probably know what happened after that 2000 Market top. The BULL MARKET in GOLD, SILVER, and MINERS took hold. The bottom was ‘in’ in 1999 and then after the markets topped, money really flowed into Gold, Silver, and Miners over the following years. Read this chart and then let’s look at some more charts…
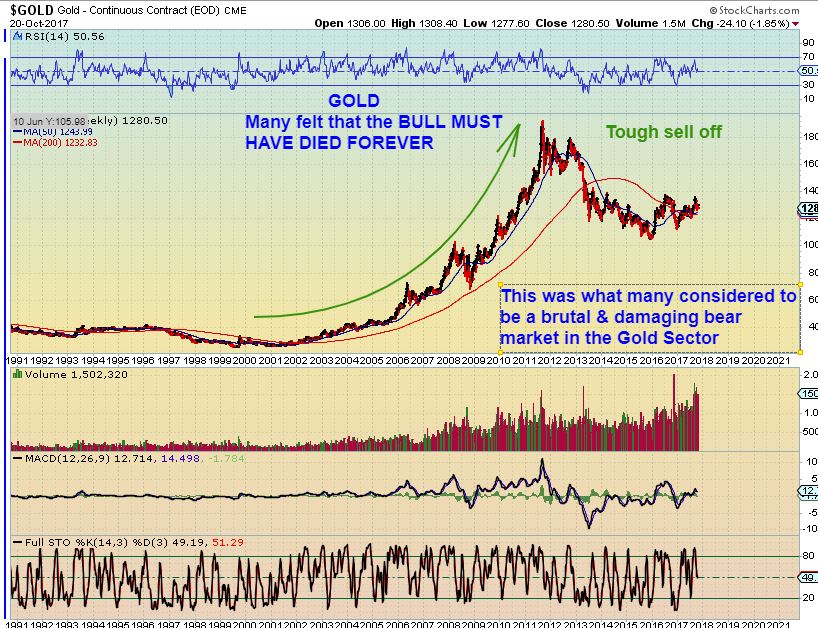
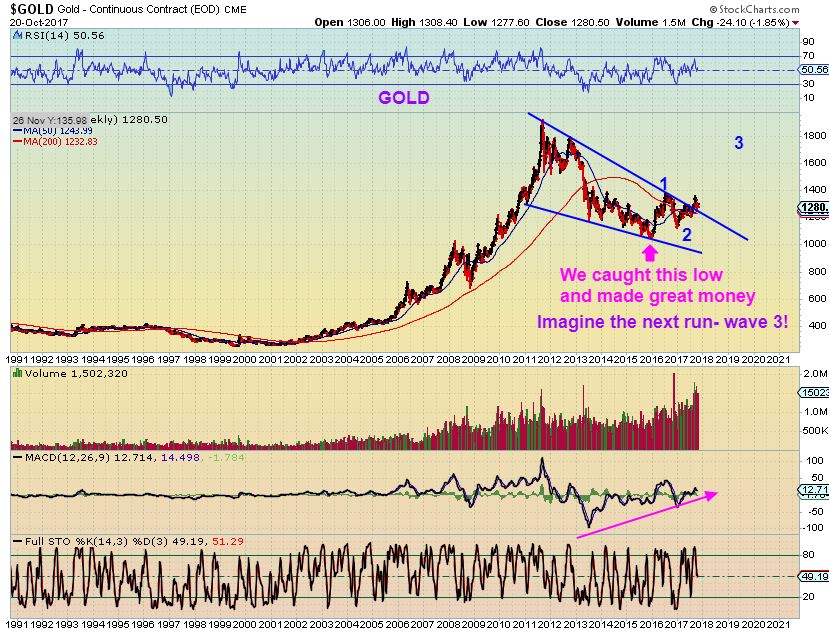
GOLD- Look at the chart below – The recent sell off from the 2012 top has certainly changed sentiment. I have received a number of emails where many feel that THE GOLD BULL IS DEAD. Why dont we take an unemotional, unbiased look at this SELL OFF.
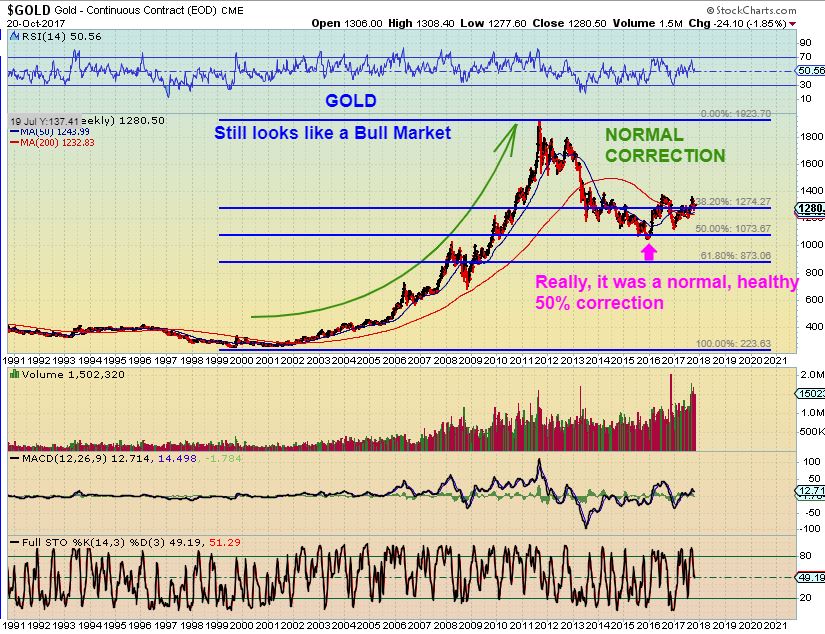
GOLD- Unbiased view – This was ONLY a 50% pullback in the overall bull market. If the Markets experience a blow off top soon, money should enter this small market again, and it doesn’t take much to push this higher. The gains that we made here when we caught the DEC 2016 lows were great, but they do not compare to what could be left on the table here. That was the start out of the recent lows.
GOLD– This is why I expect greater gains down the road. The rally out of the 2016 lows was just the start of what should be much bigger things to come. My ‘3’ of ‘5’ shown here is probably quite underestimated in the BIGGER BIG PICTURE, but I would expect a pause at former highs.
Over the past months (and even year), I have received a number of emails where traders are asking me, “What do you think of the Bull Market in Gold? Has it died?” They have attach various articles from writers that say it died in 2012. I have also repeatedly been asked about the current bull market in the General Markets with regard to Gold, saying, “You seem Bullish on the General markets, yet you also seem Bullish on Gold, Silver, and Miners? Do you really think that Gold & the General Markets can run higher together?” and other questions come up pertaining to my article on the YEN & GOLD, the USD & GOLD, etc. It takes a long time to explain all of the details pertaining to the bigger picture, so this article should help.
.
This report should answer the Bigger Big Picture that I am seeing right now. Yes, I have remained Bullish on the GOLD BULL Big Picture since calling the lows in Dec 2016 here, and you may recall that I called for OIL to drop to $26, and that was its lows. The Lows have been in place for Gold & Oil ever since. At the same time, however, I started discussing last spring that the General markets could escalate into a Parabolic blow off top, and people began to wonder how to reconcile the two ideas. I was also calling for the USD to top, when most were saying that it was going to $1.20 & then $1.40. So here in this report, I wanted to show how these various Markets can play together in the Bigger Picture. It is an overlap in timing, in my opinion. Often the top of one market overlaps the bottoming process of the other. Gold, Oil & Commodities have moved out of their lows, while the General markets are still flying, but may be approaching a topping period. We have been able to make some very good trades in all sectors, by timing the lows of Gold, Silver, Miners, Oil, Steel, Copper, etc. Riding the general markets with trailing stops. Trading stocks in many sectors, including Biotech.
In theory, Smart money builds positions at bottoms, as they slowly begin to sell out of the tops. They “Buy low & Sell high” so to speak. It is a bit of a process, but the charts can help you to see it better than I can explain it. Going forward, I do see more excellent opportunities for us to take advantage of as these markets continue to progress. I believe that there are huge gains to be made in the set ups taking place. And as always, as things play out, I’ll remain unbiased and open minded, to be able to capture the changes as they develop.
.
Enjoy the rest of your weekend, and as always, I thank you for being a Chartfreak too.
~ALEX
.
In the current trade set ups…
The charts of the TRAN & RUT in this report appear to want to move higher. OIL, NATGAS, and the USD also are bullishly set up. What about the SPX, NAS, DJIA? They may continue higher, but they did not have a visible DCL. Could that be because they are starting to go parabolic? It may be, so let’s just look at the NASDAQ WEEKLY.
NASDAQ WEEKLY – This is Bullish. Notice that the weekly chart has another bullish MACD cross. The last one ran for 4 weeks higher, had a 1 week dip, and then continued higher. This one has moved higher for 4 weeks too, even if we get a 1 wek dip ( to a dcl), it should go higher.
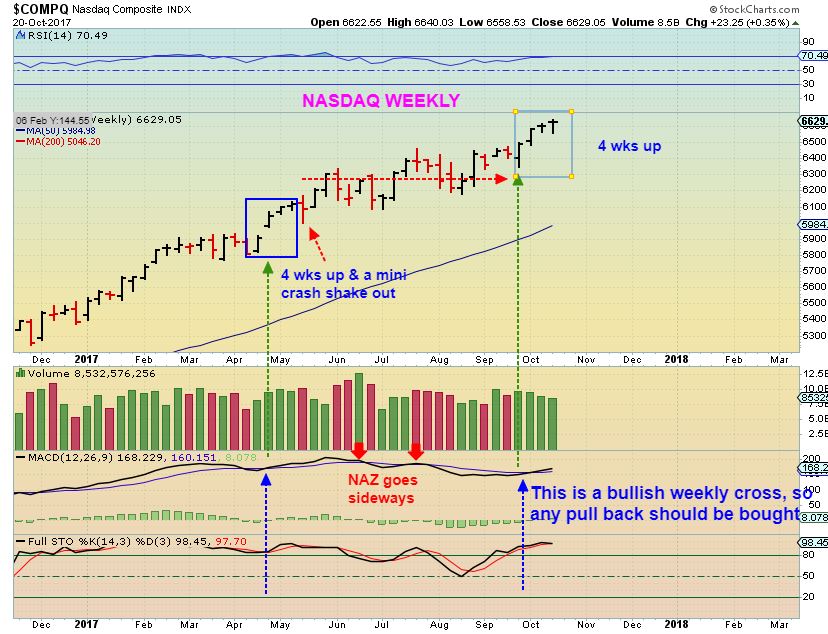
NASDAQ REMINDER – If we get a quick drop, to get a more noticeable DCL, each dip to the 50sma can be bought as a low risk entry. Using the chart of the RUT AND TRANNIES, we may have seen a DCL here, and that may be all we see. Again- If this wasn’t the dcl, and we get a dip to the 50sma (even with a shake out there), that would obviously be a ‘buy’- please read the chart.
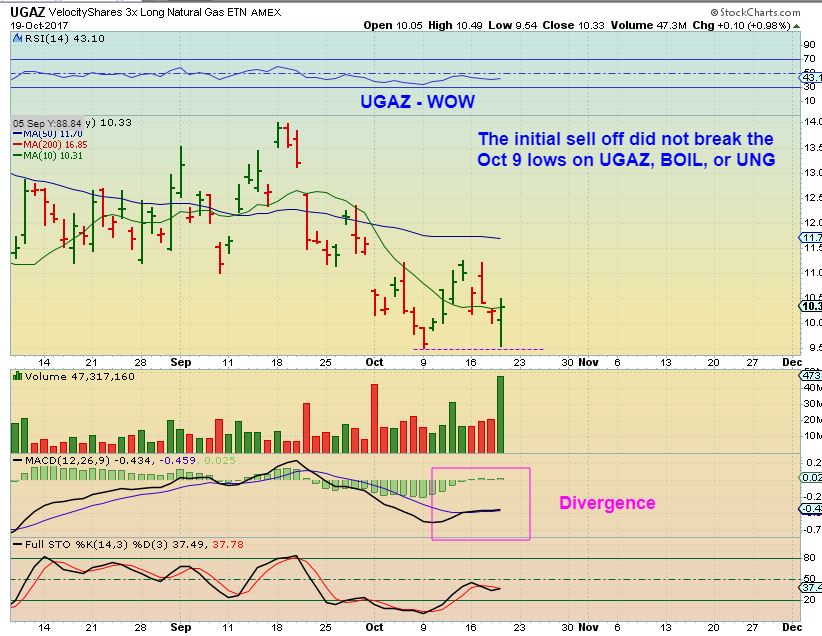
NATGAS – This should be the dcl. The August lows were not broken, but the OCT 9th lows were broken & regained intra-day on Thursday. The way NATGAS is playing out is VERY strange, because in the leveraged NATGAS ETFS – we actually saw more bullish results. See the Next Chart…

UGAZ – ( AND BOIL & UNG) Somehow, even though NATGAS appears to have dropped well below the OCT 9th lows, UGAZ, BOIL , & UNG did not, and I did not get stopped out. I believe that the lows are in place, and UGAZ moved a bit higher on Friday. I’m still long.


Thanks, Alex! Fantastic big picture analysis. A couple short term questions:
So, are you an advocate of a short position on gold (and I suppose also the Euro) as we approach your target of 97 for USD in this bear market rally?
And then what’s your short term outlook on oil? Rally from today’s prices, or a pullback to high 40s before the next leg up?
Thanks again!
These were actually questions in the back of my mind as well as I ended the report. Im currently Short IAG, potentially looking to add a Bear Lever. position in JDST as well.
And oil – same questions as peter…
I’m not shorting Gold or Miners here personally. I have a lot of long positions in other areas that I feel offer safer risk reward than shorting the precious metals. I’m not saying that there is no downside, there should be but…
If I was shorting, my position would be small. Why? If ‘anything weird’ happened with the claims being made between either N.Korea or the President of the U.S. – I think that Gold could pop $50 overnight, and would I want to be short then? Even though it could then still drop into an ICL, I wouldn’t want to be short on that day and try to claim that I am not emotionally affected by that. But that is just me and my trading.
Oil, Tough to explain here, I’ll try to cover it more in the next daily report. What I am saying is that I was expecting Oil to drop into a dcl timing wise a week ago, and they usually come by day 30 – 50 right?
Oil looks like its lows are in place for several reasons, but it is shy of day 30 as mentioned in earlier reports. THAT COULD BE A BIT CONCERNING until it breaks free to new highs, but I like the set up. Maybe you could even go back to Thursday or Wednesdays report and see what I was saying about Oil then.
So short term, I feel that the lows are in (dcl). I mentioned it after it reversed off of the 50sma & 200sma area, and that is where my stop would be. Can it drop after inventory Wednesday? Yes. Can it rally Wed? yes. I cant tell right now, but I have a low likely in place, so I’d go by that. This would be the 2nd daily cycle after a very right translated daily cycle. I’ll try to cover it in the next report.
Long the dollar? yes, Short the Euro- probably.
HI Alex,
this is top of the bill research
second to none
I’m really impressed
Thanks
Thanks Ray, I appreciate that.
It’s crazy watching these markets play out in big picture scenarios, and look totally normal, especially Golds drop from 2012 to 2016, right? Normal, but in real time, very uncertain and depressing at times.
Meanwhile, we ride the day to day, week to week bumps and fight the tide often.
Just a great report. Any targets on the Nasdaq we should be watching for?
I’ll have to cover that in the future, it may become apparent then.
There can still be pullbacks along the way too, they have just been less evident.
A most excellent big picture overview! Thanks much!!
Thanks Alex. This was a very good report as usual.
Alex, is it concerning that we “saw more bullish results” on the leveraged natgas ETFs, but the 50 is rising on $NATGAS, but appears to be on a decline with the ETFs?
I think we saw the same thing in JNIG vs GDXJ in July Aug.
Could be decay on the sideways chop that NATGAS has been doing for months, and Miners did last summer. GDXJ & JNUG Rallied after that.
Spectacular report CF….i seriously cant contain myself while reading along..:-) Mommy will be VERY happy if these structures continue to playout as u so aptly show…. .perfect timing indeed for MariaVacaTrader. Damn… U spoil us!!
Great EW labling BTW…thx for the exrra effort…Maria is very pleased 🙂
Meow
#WoopUgaz …..
Thanks everyone, Glad you all enjoyed it.
As I wrote it I worried that it wasn’t as clear as I had hoped and I admit that maybe it is a bit too wordy in some areas ( I always try to explain everything as though I am being asked questions of ‘why’ in advance), but I basically wanted to show the
way the markets can work together & then change it up later, in the Bigger picture, over time. .
If you look at GOLD & GDX, this is why I am not shorting this . It is still probably going to be bought on the dips for a bit, but the next bounce should help us to see if this can or cannot make highs for this daily cycle. I am expecting a L.T. cycle, so it shouldnt make it that much higher.
grrr ADHD
…. nipped my butt…
rekkafrezza
I’ve decided to sell my GNMX – As it continues to rise, I just see the volume dropping off, and I have very good gains
so I am going to lock them in.
OUT OF GNMX
Thanks for the heads up – I’m following you out
Yeah, this may start going sideways or drift around for a while, like the rest that popped do ( See MTBC, INFI, ECYT, ADHD). It seems that many drift for a while after a good pop
That tuned out to be a good sell at this pointr. It had turned green when I decided to sell, and I just looked, it is down over 5% by the end of the day.
It can pop higher tomorrow, but I just didnt like the tepid volume in todays rise
#NoConviction
HTGM Taking off, as mentioned this morning.
CUR – Not taking off yet
Cancel that, I just looked at my posts, Looks like I forgot to mention HTGM, but I did mention it a lot last week
as a recommendation. Looks to be breaking now
Charts from last week- another one that got a bit boring for while. Hopefully we get follow through now
https://uploads.disquscdn.com/images/0e98b40a941680ad8af312e9f6b91b9c0b5f5d3072d03c10f82ccfeafff1ba6a.jpg https://uploads.disquscdn.com/images/47bdce24b3db612e8931a2ace64eaaf0890f8a252080c232098427b7be6dccb6.jpg
HOS, back to my first entry… Tempting….esp with this doji
JRJC… nice
THAT ONE TOO- see attached,
ANd then look at it now.
https://uploads.disquscdn.com/images/11005de5079c6463660bd4dabcb93bcadc900125ccce577d425835f775aee20a.jpg
This is another chart that I had in our reports. It might be good to notice how this one ran day after day after day in August. This next leg could do the same.
https://uploads.disquscdn.com/images/6fe1631d697ba6b6f4b6018cdd7ce24e093a0e2eb10a31d90a8e65142e09cf55.jpg
Looks great 13% ago haha. Nice one to watch. Thanks.
Peter
Do you remember the email last week? The Blockchain picks – Are you still holding?? : )
PRELF…yes sir!
Also grabbed BTLLF today…similar company.
I dont know that one. Looks decent
YES!! I just saw that take off and was hoping you held on. THAT was a rough ride.
My blockchain choice changed tickers – In that email I pointed out BIOS, it changed to ticker RIOT last week.
Shook me out & I re-netered. Crazy moves on these.
Lmfao!
He is correct. I posted it in the reports last week when it ws down more than 13% ago 🙂
and it did look nice.
This was in our reports too : )
Even nicer since it was hitting $2.80 today – woohoo
https://uploads.disquscdn.com/images/668693ee220cdea5112a3110fc75c7edf0e48ad93d8b4e0b29ad7215a5c8b4ac.jpg
I FOUND IT! I DID FORGET TO POST THIS.
YOU CAN SEE THAT IT WAS DATED TODAY AT 10:51 a.m. in the upper left corner.
HTGM – I was going to say that it holds the 10sma and is a lower risk buy anywhere around there.
https://uploads.disquscdn.com/images/417e5b2db8b340e5fb21172a2d88d7e3edd29e027648e506b163d017eef10e95.jpg
mmmHmmm ….sure u were….. 😉
ha!
#timestamp
WOOP
dang… SVBL …. hmmmmmmmmmmmmmmmmmmm
Wheres the beef?? 18 K?
On an 11 cent stock, $2,000 could do that 😉
i know.. exactly.. watch it go tho
Add your $2000 and it’ll fly – lol
i didnt buy turd
U didn’t buy fertilizer?
shouldnt u be in bed?
Yes, I should -still a bit nauseous
#marketaddict
lol
*and SuperBratty
I wonder if a big name like WFT hitting new 52 week lows all of a sudden will foreshadow action in the oil driller OIH group?
very strange action with the oil services group, you don’t typically see this kind of extended pullback when oil prices are range bound at the recent higher end (52ish) like they have been. defn some negative sentiment issues here
HTGM – Pulling back from that explosive move today- I am adding
I SAID I ADDED ON THAT PULLBACK TO $2.40’s again.
🙂
Targets, anyone? or is this just too hard to “predict”?
Million dollar question…sell this rally or hold.
This is a tough one, because usually I sell 25 to 33% of the initial POP, but with this one, if you look at the chart, it really looks like it wants to go one day with follow through.
This one is like a volcano rumbling…(look at this chart refresh) It does this every few days , and at times, 2 days in a row.
https://uploads.disquscdn.com/images/c937e63e0cbd247ba7e6fd5d9a952010b488af014940703ceac1d5f6081e032f.jpg
So many times that it has popped in the past, it has given it all back the next day!
yeah… welllll .. .I’ll take a REPEAT of Aug 2016…. giggle
https://www.tradingview.com/x/EgpV9Ht8/
I’ll take a run back to March 2017 highs please
GULP …. be still my beating heart…. ;o)
VROOOOM VROOOOM
Alex…what do you think of BDSI? I had and sold days ago…..it seems to be holding up better than some of the other bios…think if might be ready to go yet? 3 year chart is nice….
The 3 year chart is excellent, it has already popped off of the base bottom, and has worked its way higher, so it has begun to kind of prove itself too.
The daily is good too, but it is pushing agaunst the 50sma and trying to break higher. It wont be ready to run, until it vcan break through ( And that could be sooner… or later. It is hard to tell).
Longer term, Barring earnings or FDA surprise, the chart is great.
Thanks! 🙂
GROW interesting…..
SKY
That is an interesting chart…hm….
RXII….flagging under that 200 sma….hoping this is getting ready to be a giraffe neck….maybe…?
Alex , What are your thoughts on GALE and OCRX here? both seem to have overtaken the 50D MA, and seem to have easy stops. Id appreciate your take on the charts .https://uploads.disquscdn.com/images/550c22a0f6480014def91af34dd04bcc65f5b7ea1ac48071a39c50048cc3e930.png https://uploads.disquscdn.com/images/77db1d8f86a510d2b112988b29d2f27aabee0cc209a58346fae99b30b16157d4.png
Well I really like the set up on OCRX ( Both look good for their own reasons – the other one seems to be trending back higher).
OCRX is pinched between the 50 & 100sma, and is sitting on the 50 – so it is low risk with a stop somewhere below todays price ( I’d give it some wiggle room- I would use a lower trend line).
I dont really know if it is ready to go,
but it seems to be close to the low. ~ Dr. Seuss
thank u Sam I Am
ummm …… is it possible that Oil repeats from 2002?
https://www.tradingview.com/x/WcqYC0jL/
Sold HGTM for a nice gain. Thanks Alex!
HTGM: sold half. Ditto on the many thanx to you MR. CF. Dont forget my earlier heads up on earnings.
Nice trade Crawdaddy – And I have Nov 7th for Earnings for HTGM.
I can’t believe the semis managed to stay positive today.
I went short MU 41.80 and long SOXS 17.71 – both starters.
THE TUESDAY MORNING REPORT HAS BEEN RELEASED