
April 29th – Sounds Like A Plan
Another week has come and gone and the markets have moved closer to the FOMC meeting and other events that can affect the markets. Let’s discuss the latest market action and what the plan is going forward.
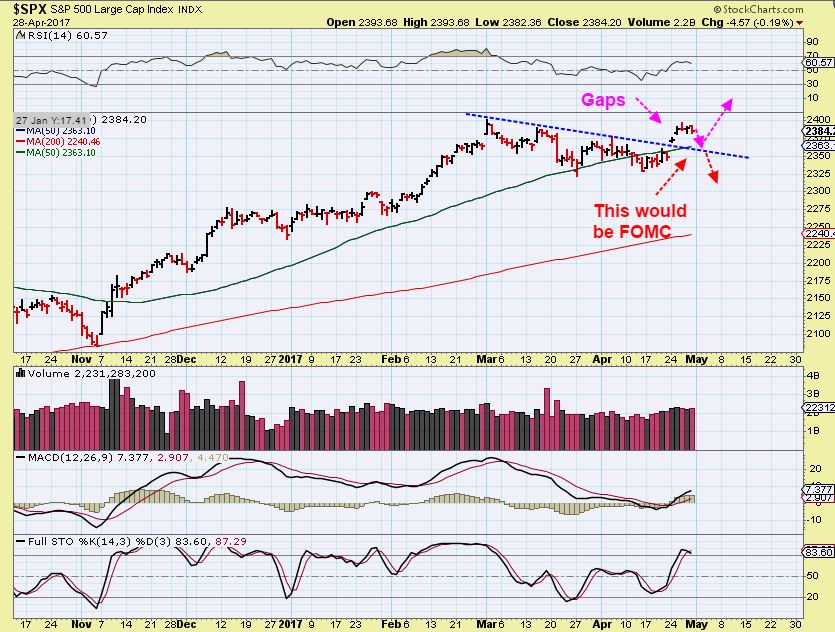
SPX – This looks like Day24 for this daily cycle and it has a Day 21 peak. We see a swing high in place and this can drop into a dcl. I am expecting some gaps to fill and likely a back test of support and the 50sma into the FOMC MTG Wednesday.
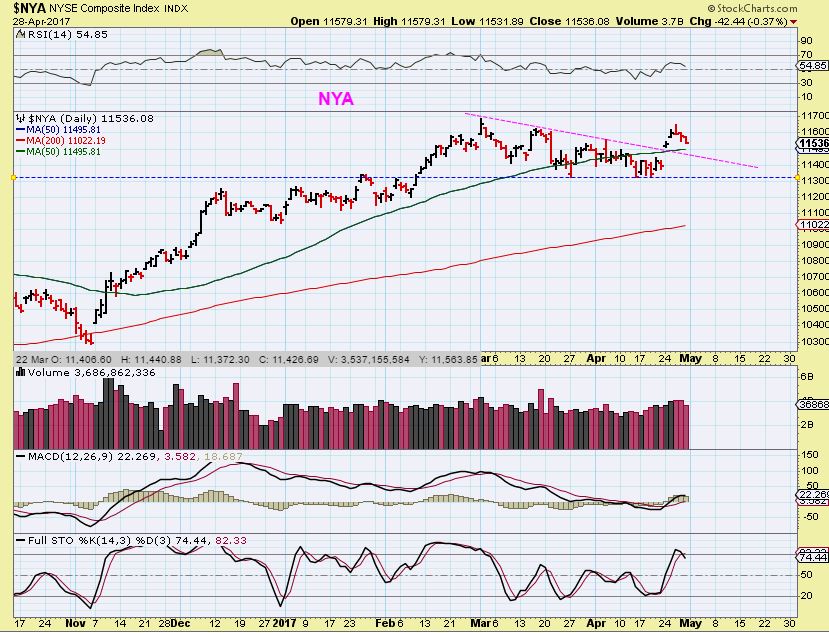
NYA – This looks like a back test so far too, but we possibly have enough time left in this daily cycle to do more than just a back test, so will it bounce around or consolidate?
There is more to this set up than just what was stated above, so let’s look at 2 more sectors…
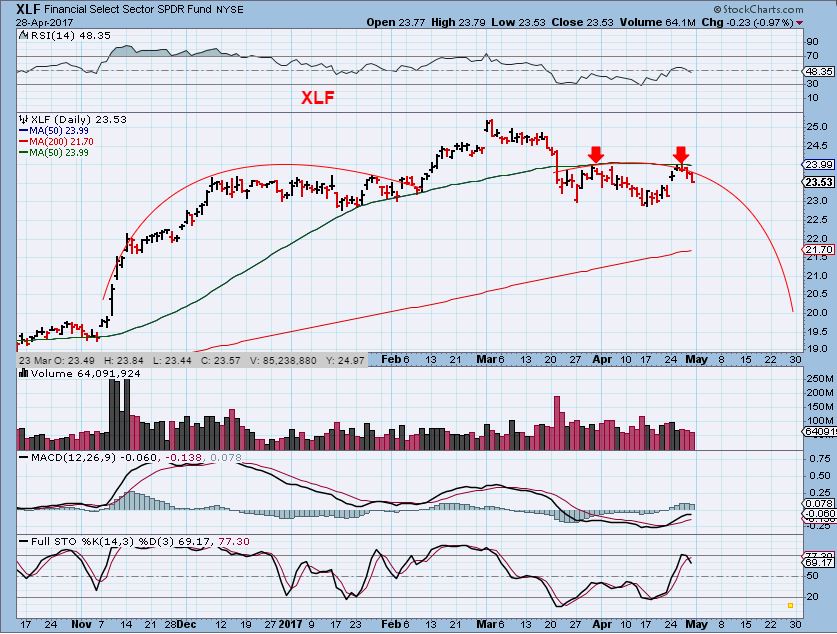
XLF – I have been saying that the Financials need to recover to give me a bit more confidence in the longer term trade set up. So far the XLF remains rejected at the 50sma. If this drops into the FOMC and then we get a decision that hastens the break down, the other markets may just keep dropping into new lows. This week could be pivotal.
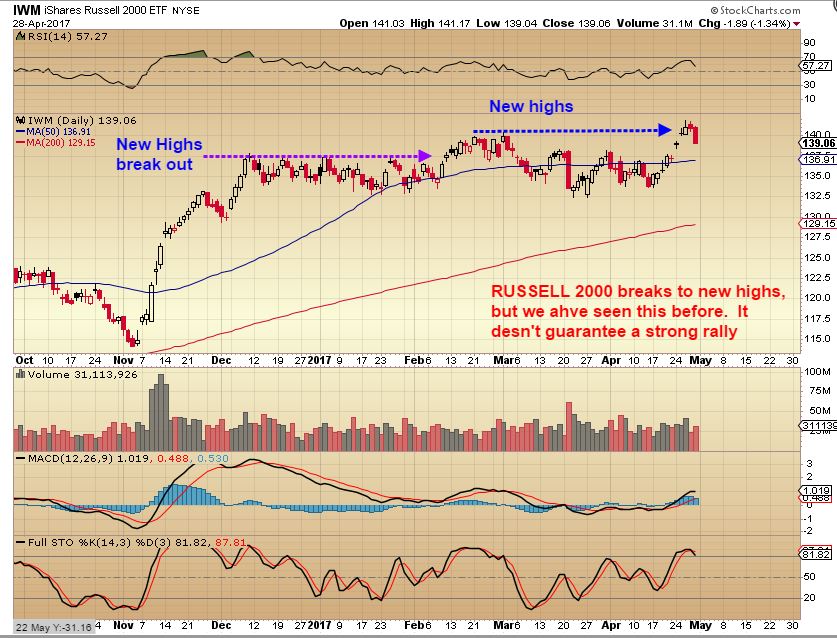
NASDAQ – The Nasdaq has been very strong and ran to new highs, but it too could pull back and fill a gap, back test the break out, and back test the 50sma. With ‘New Highs” , doesn’t that mean that there is no overhead resistance and markets will just run higher?
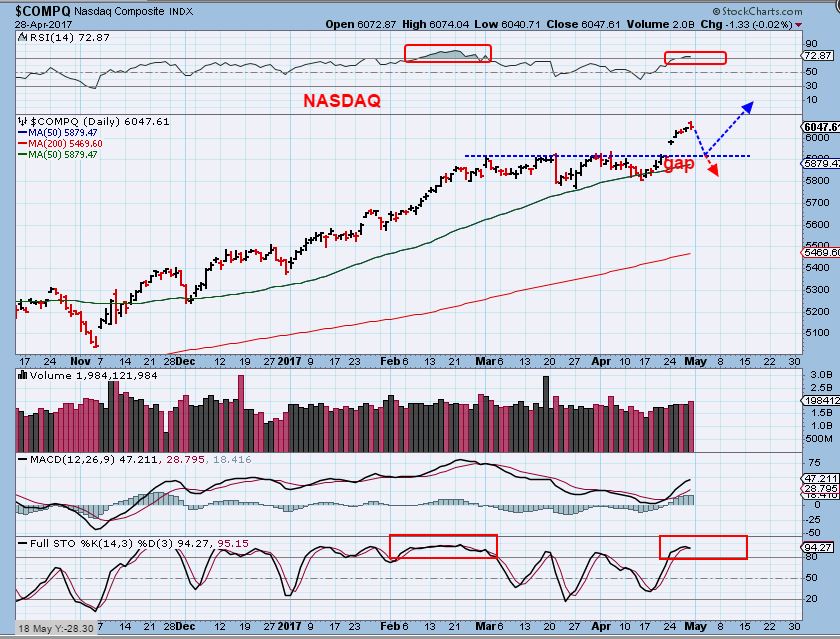
No – A break to new highs does not automatically mean that we will see a run higher and higher. We have the FOMC Meeting and the French Election Finals to contend with In the near future.
SIDEPOINT:
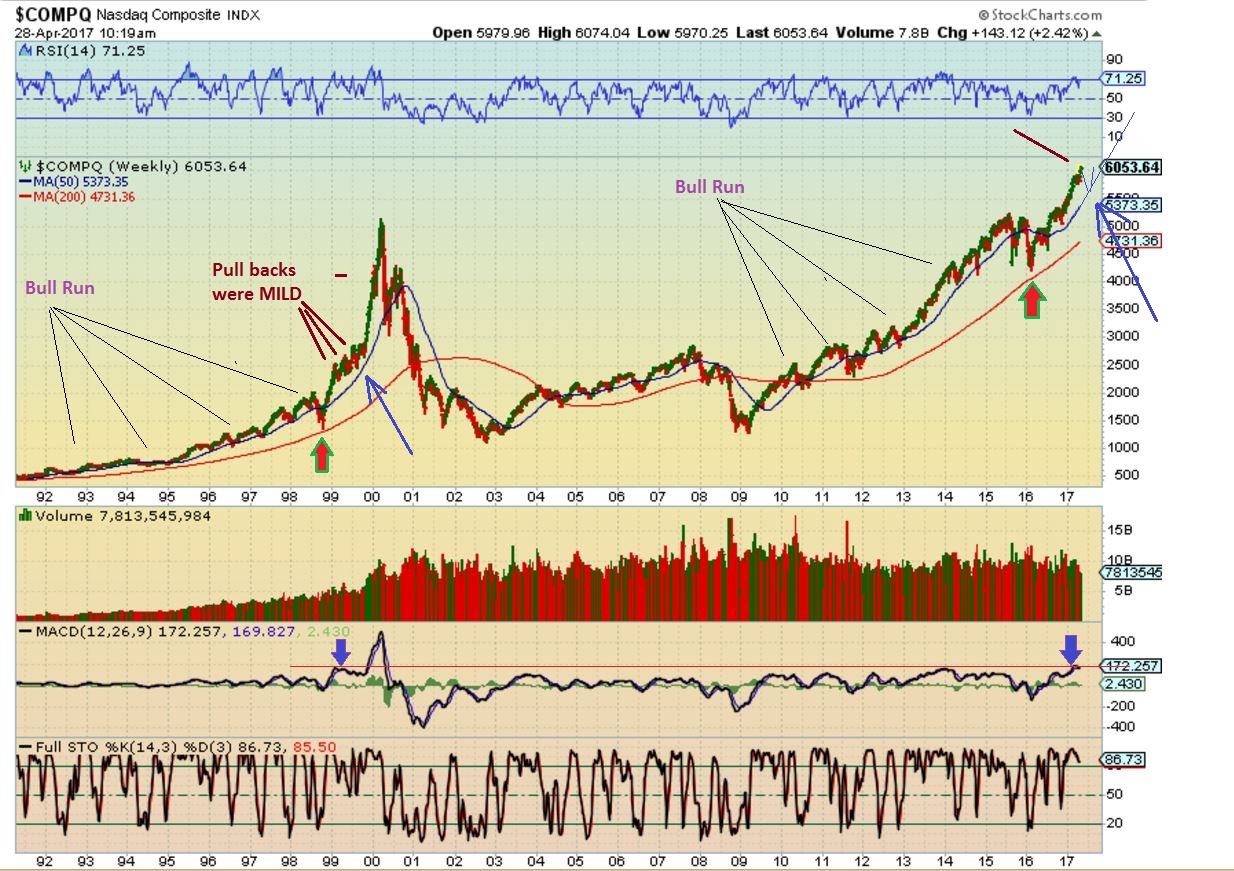
I was basically asked last week in the comments section , ( No quote) Could we repeat the NASDAQ blow off type of accelerated move to a blow of top, since today looks similar to 1999? Looking at the chart below, the answer would have to be “Yes, why not.” I’m not saying that it will, but the comparison is valid.
See the chart below : A long bull run, a sharp “shake out pullback” to the weekly 200sma area, and then a vertical move higher. I would not rule it out.
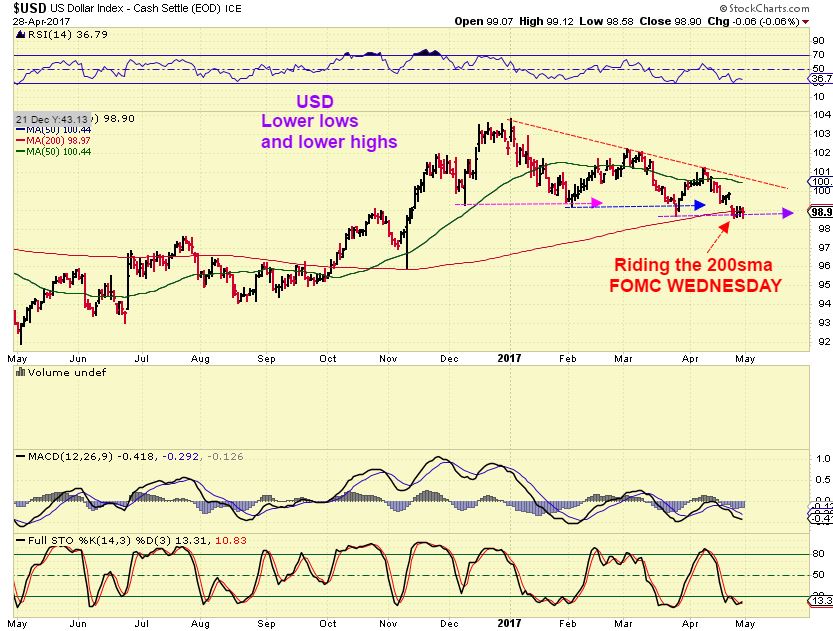
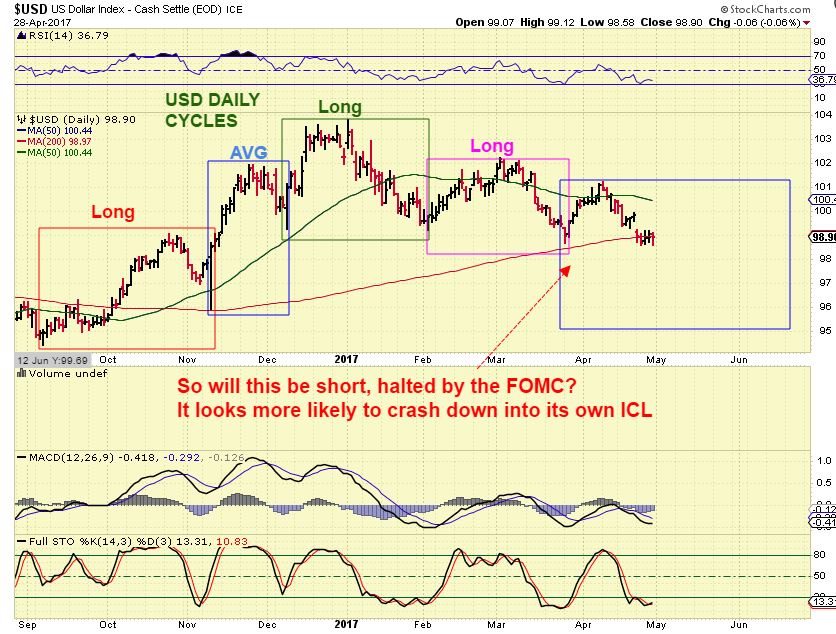
USD #1– So far we cannot ignore the lower highs and lower lows. The FOMC usually does move the $USD one way or the other as it dances along the 200sma.
USD #2 – I thought that we had an ICL sell off in January shown here, since we saw very short sell offs into the dcls in Nov & Dec, and then one long one in January
( See the chart , ignore the Boxes for now, just look at the sell offs & read the magenta note ) but…
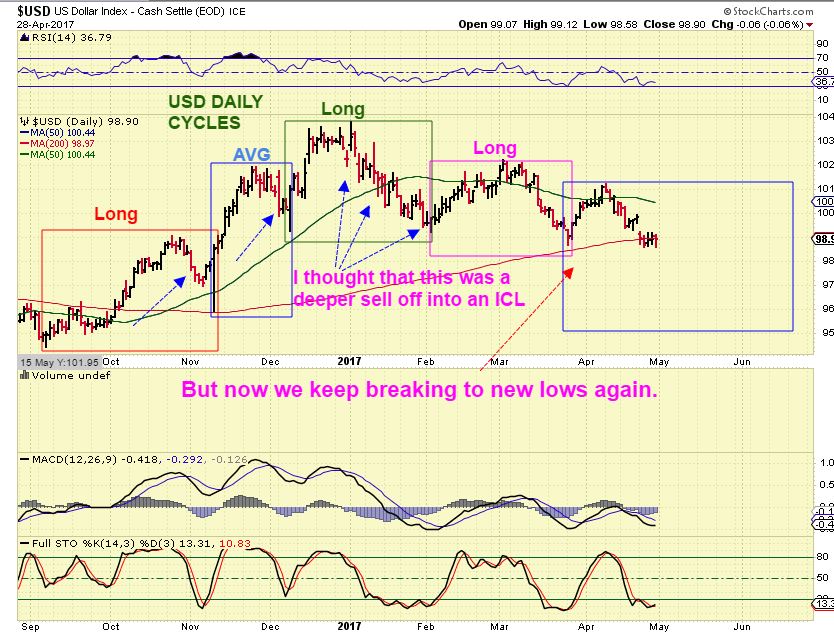
USD #3 – …but we keep breaking to new lows, and I dont think that the 1st daily cycle out of an ICL would be that weak, so….we must be seeking out an ICL now and January was just a LONG L.T. Daily cycle.

USD #4– So with the FOMC meeting, will we see this drop into an ICL? Really, we just have to wait and see what WED/THURS brings.

Now for the BOXES. I looked at the daily cycles of the USD too. We had a LONG daily cycle, then an average one, followed by 2 long daily cycles again. That had me wondering, would this one be short, perhaps halted by the FED decision? A sharp smack down and recovery could put in an ICL i.m.h.o., and TOP golds next dcycle too. The USD movement has been odd, dropping with Gold recently. We have seen this in the past and it usually resolves back to inverse relationship in time.
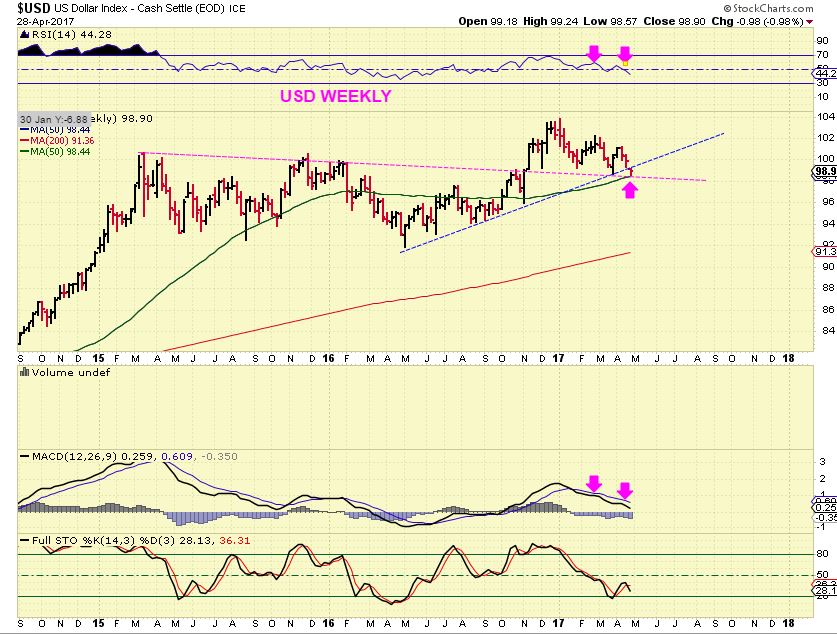
USD WEEKLY – The MACD looks weak, but the USD is holding up rather well around support so far too. I would not play the USD long or short until we get some resolution.
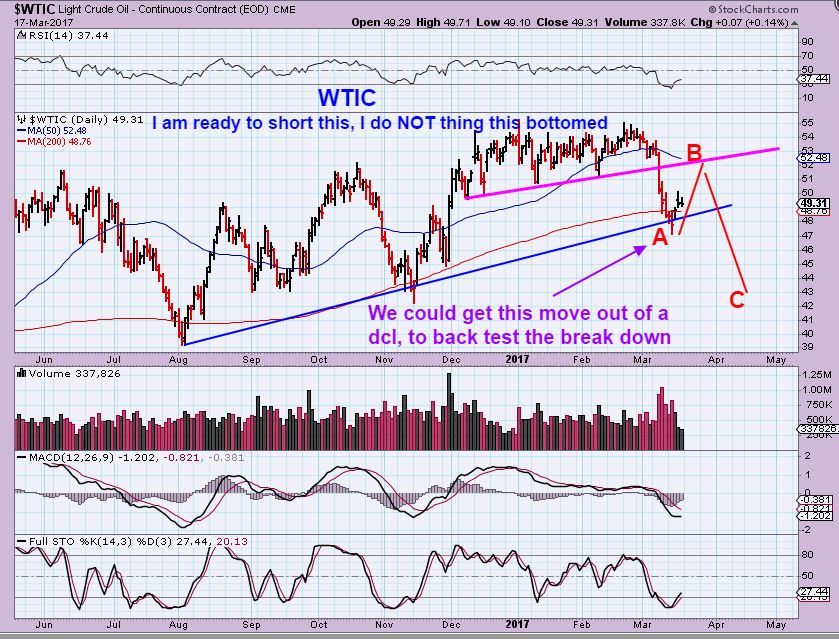
WTIC – Oil is at day 26 and on support, but Oils cycles can run 30-50 days long and that means that this could be close to a dcl, or only 1/2 way, right? Oil cycles vary a lot in length and need to be monitored. I also like to look for other clues too as time moves forward.
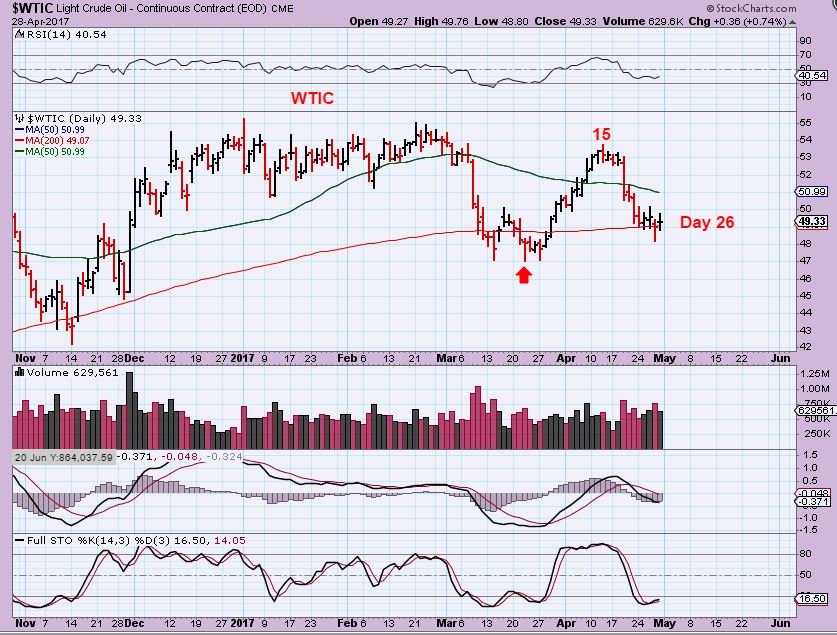
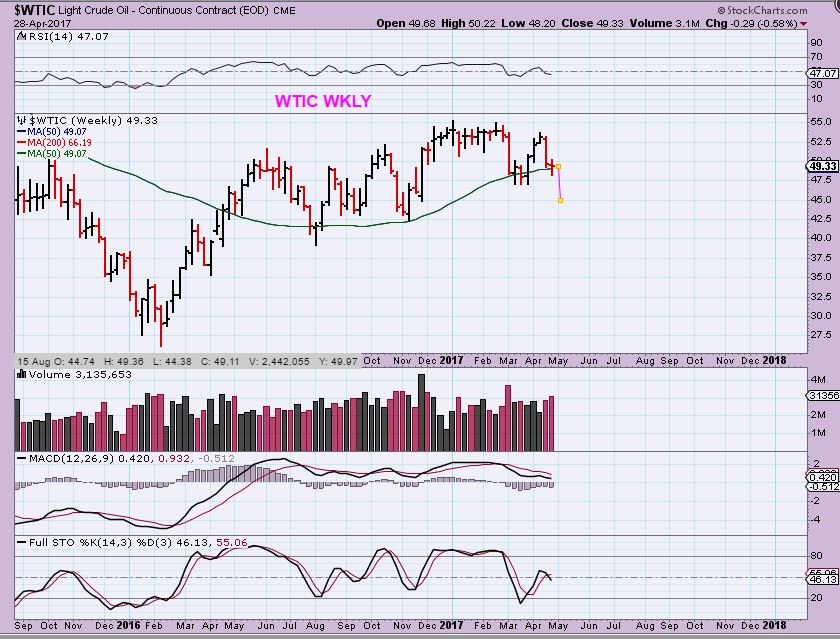
WTIC WKLY – Though it is on support, I feel that Oils weekly chart is looking weak. I drew in another leg down. Another clue is…
XLE – Energy stocks for the most part broke out and failed. Many false break outs occurred in Energy stocks during Early April, possibly signaling that OIL has another leg lower. I still saw weakness in that last 4 day rally & then it rolled over. I am NOT in any Energy stocks currently, except a small starter position in SWN ( More of a Natgas stock, but I need to watch it carefully too).
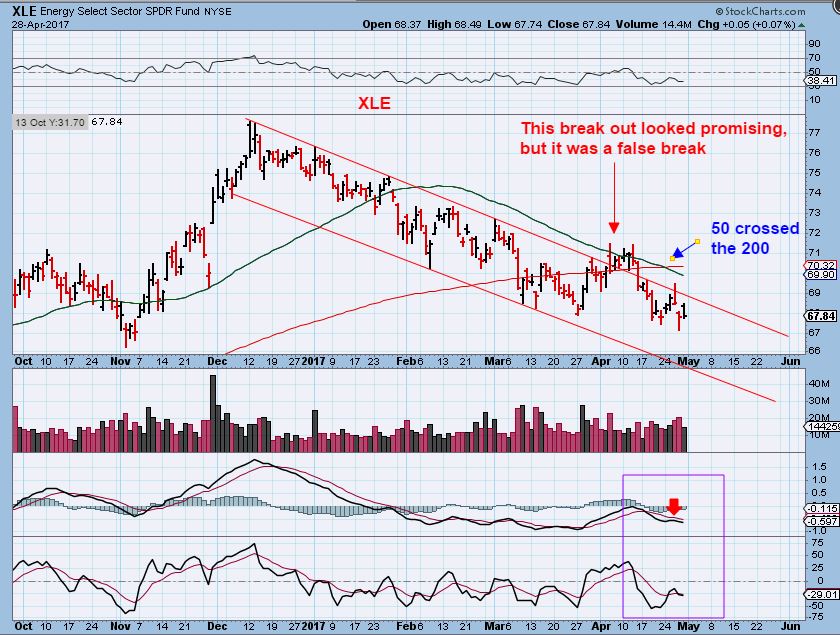
As a reminder: My original thought was that OIL would drop, bounce to a back test, and make new lows, so we should still be thinking that this could happen.
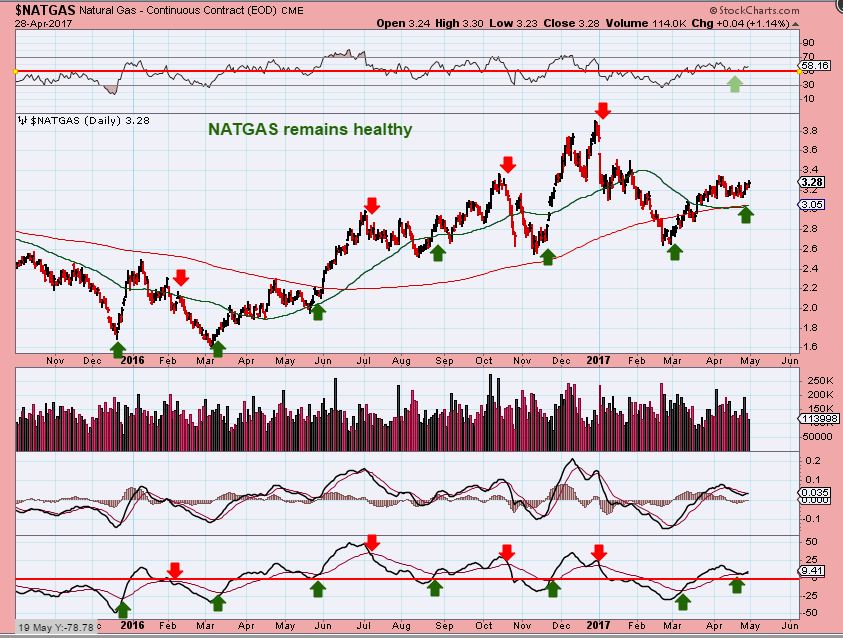
NATGAS – A bullish set up – I traded NATGAS ( BOIL & UGAZ) well out of recent lows and then sold it to re-enter lower. Honestly NATGAS has not really broken below where I sold it for weeks, so it is holding up well. It is a bullish set up and I want to go long again soon. I was waiting for a drop to the 50 & 200sma, but that just might not happen.
GOLD, SILVER, & MINERS
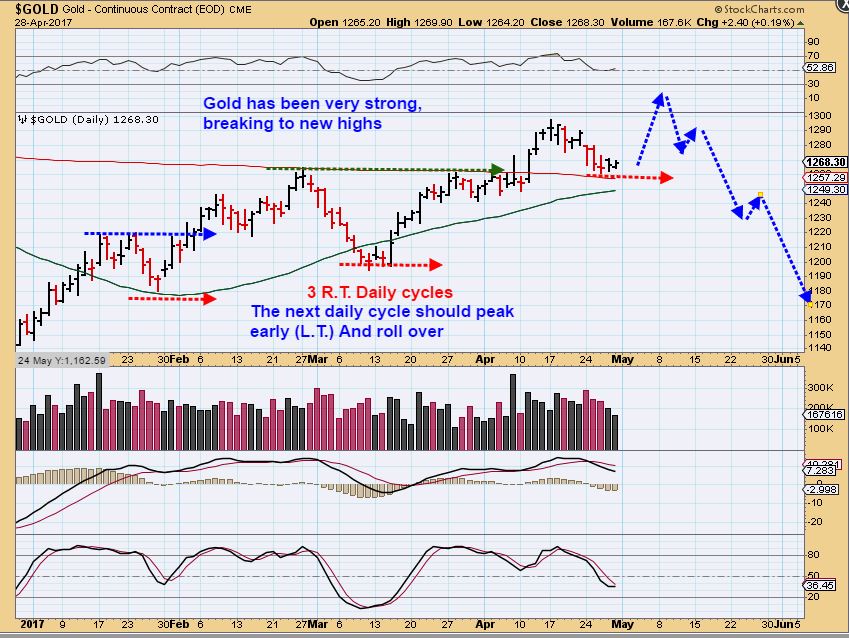
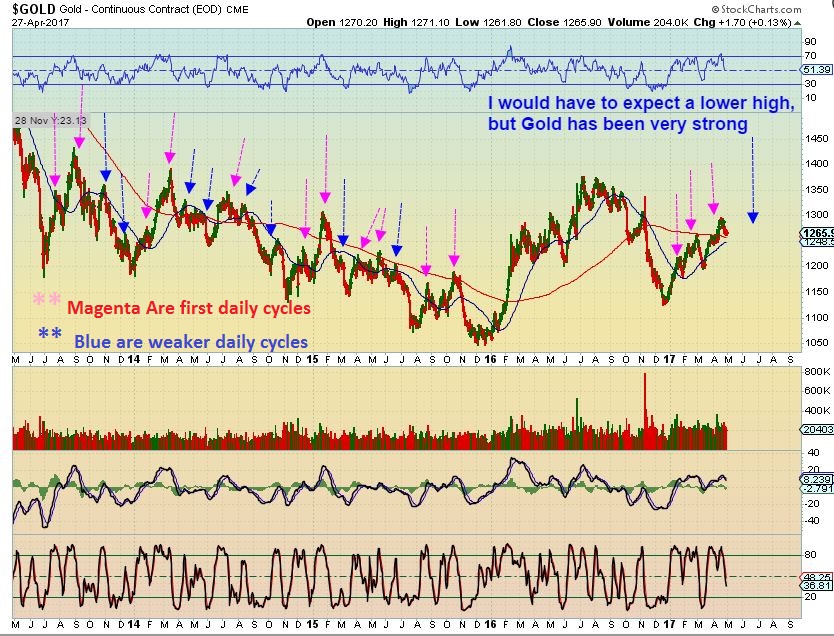
GOLD #1 – 3 daily cycles right translated is strong and Gold did that. The dip has been rather mild, so many wonder “Can this really drop into an ICL when it is this strong?”.
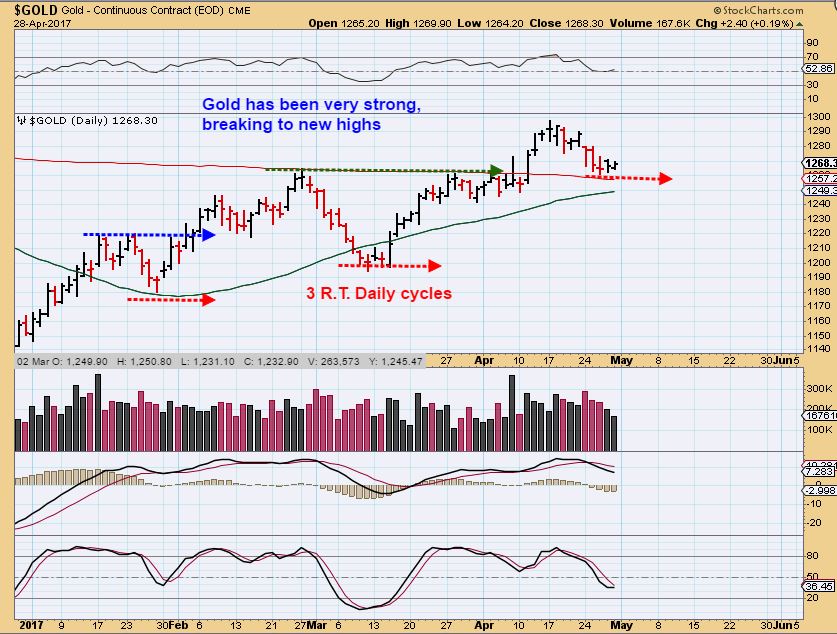
IMPORTANT CHART, GOLD #2– Excuse the typo on the chart 🙂 Gold looked very strong last May too, even breaking out to new highs with a huge 2 day pop, but the drop into an ICL still came ( red square) .
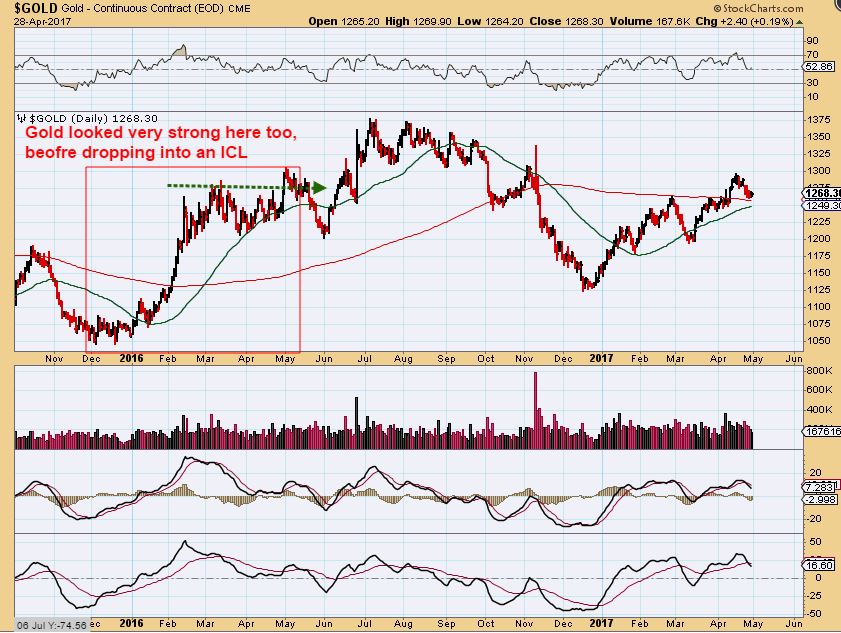
GOLD #3– What if Gold has a 2 day POP after the FED? Well, a break to a new high on the FOMC mtg would draw in all of the Gold bugs, but it is time for an ICL soon, so it could roll over like last May. This chart should say MAY- Not August…
Obviously I needed coffee. 
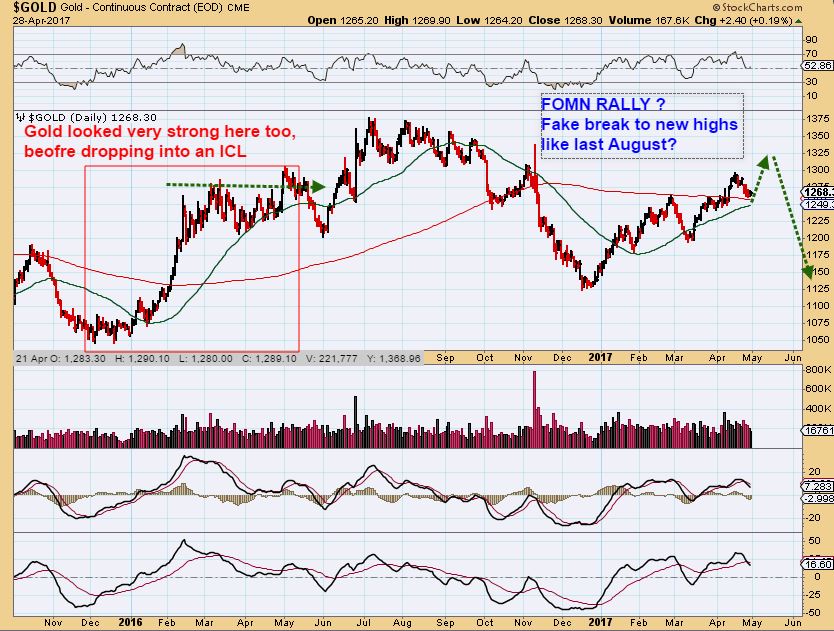
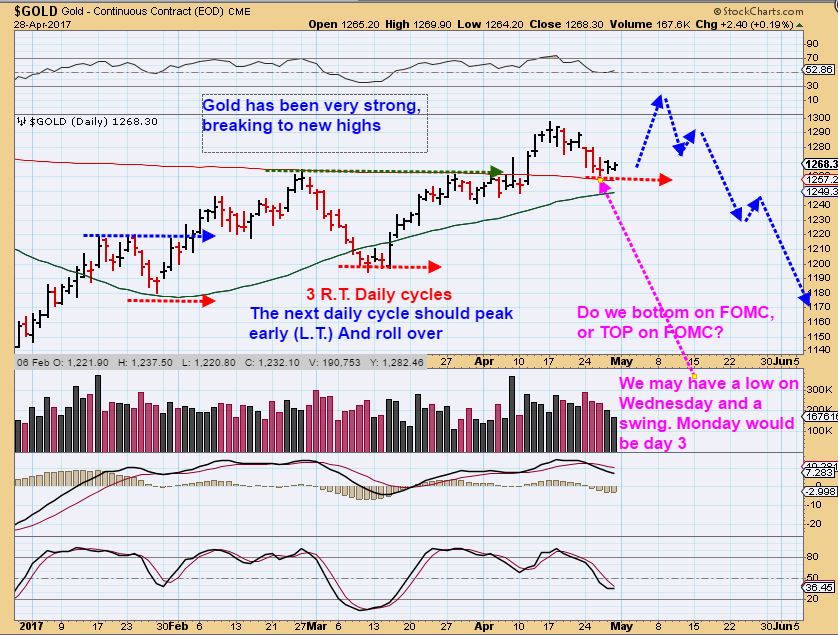
GOLD #4 – If you see this burst higher at the FOMC, it will look very convincing. Notice also that the last break out to new highs in April 2017 lasted 4 days, peaked, drop. This drop in Gold is as deep as the one in January, so this could be the DCL and pop at the FOMC could top out & drop.
GOLD #5 – Read the chart. A bottom at the FOMC also could occur, but the point is… we are due for an ICL in a 4th ( Or maybe even a 5th Daily cycle low). Playing Long here is NEVER easy and not even recommended. The charts of the Miners will help you to see why…
GOLD DAILY CYCLES – Even though very strong rallies within the first couple of daily cycles ( Magenta) do make vigorous moves higher, they rolled over into ICLs. This recent move does not look much better than other rallies out of an ICL. Expect a sell off into an ICL sooner or later, and Miners have been weak.
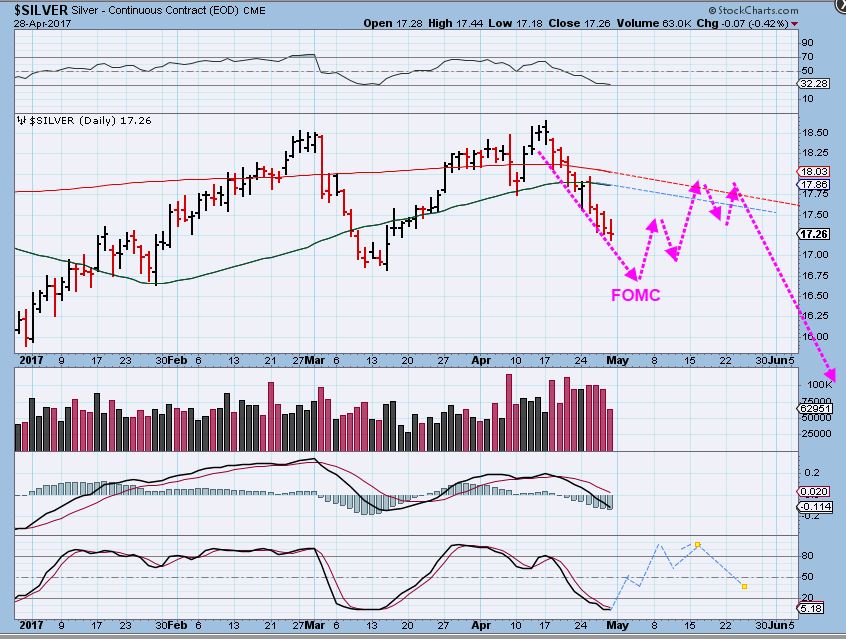
SILVER – Is Not as strong as GOLD has been, it has been selling off sharply. This should be a hint that GOLD will not just keep going higher and higher. When I look at this chart, I feel that Silver may telling us that GOLD & SILVER may actually BOTTOM ( DCL) At the FOMC MEETING. We could get a break out to new highs in GOLD ( like Gold did last MAY), and then DROP into an ICL. I have drawn in an FOMC low & Rally for Silver.
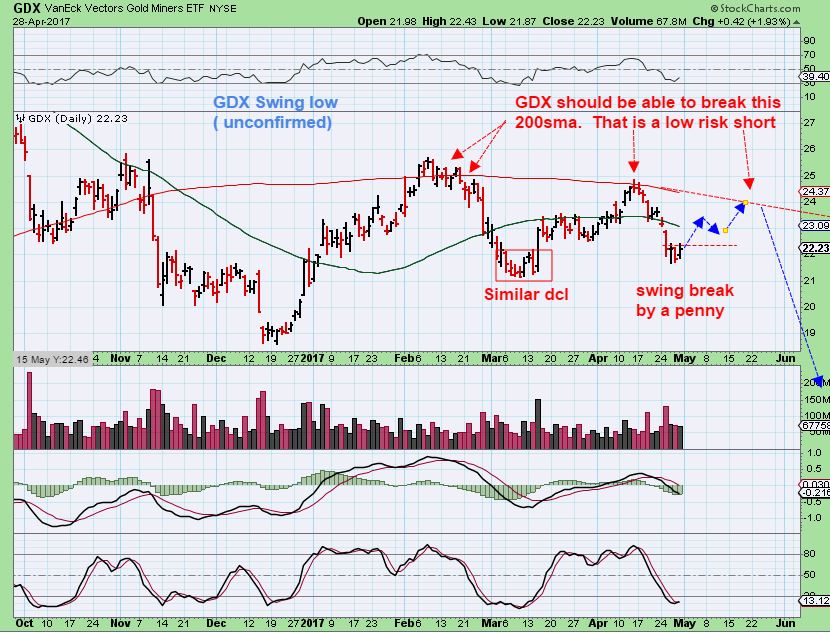
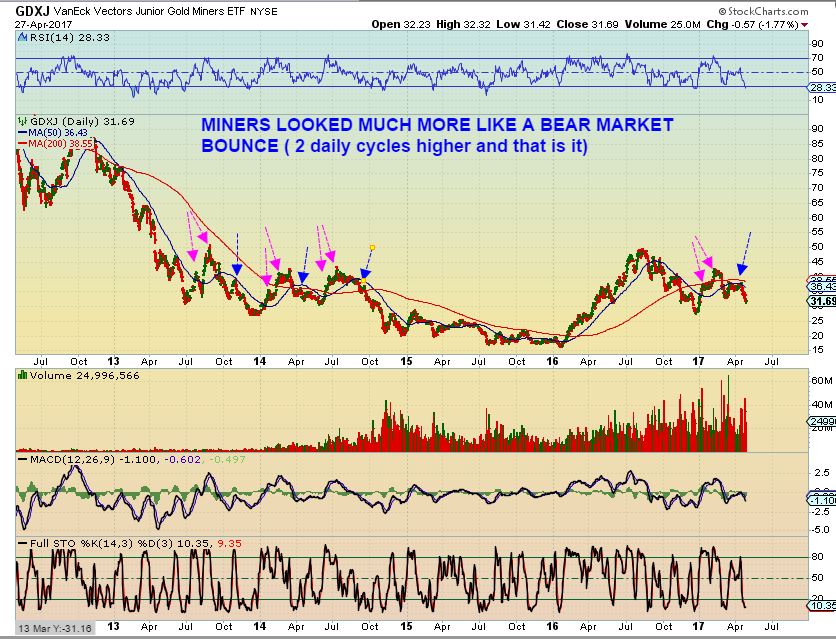
GDX also has finally joined in with GDXJ & has been selling off for the last 2 plus weeks. This may be a swing low last Wednesday like we see in Gold, so again it is possible for Miners to rally at the FOMC Mtg & drop later. Will Miners break to new highs? Unlikely, they have struggled while Gold was strong. Only time will tell as this unfolds next week. Some want to play the 4th daily cycle, but remember that You do NOT Have to be positioned when the FOMC MTG takes place, it isn’t the safest trade out there. The 4th daily cycle can be very tricky. Some should just play it safe and remain on the sidelines, especially if things do not clear up Monday & Tuesday.
GDXJ – The lows looked similar to last March lows, so this may be a DCL forming.
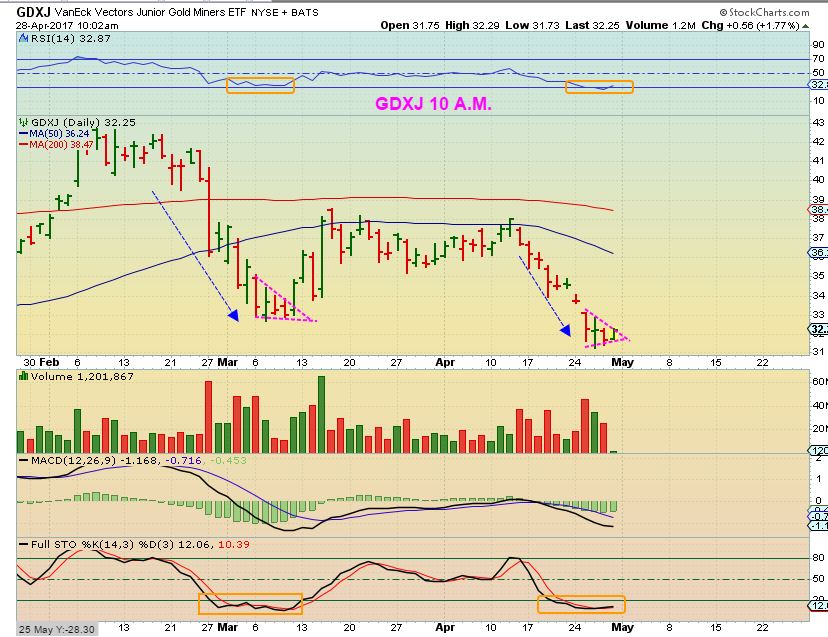
GDXJ – If GDXJ could not break above the 50sma on the 3rd daily cycle after 2 attempts, that should mean that it will not break through the 50sma on this daily cycle too. Is the 50sma the perfect place to short again, for those so inclined to short Miners? Most likely, I will monitor things going forward. NOTE: Notice how a run to the 200sma this time would still be a lower high than the March highs, so that COULD happen too.
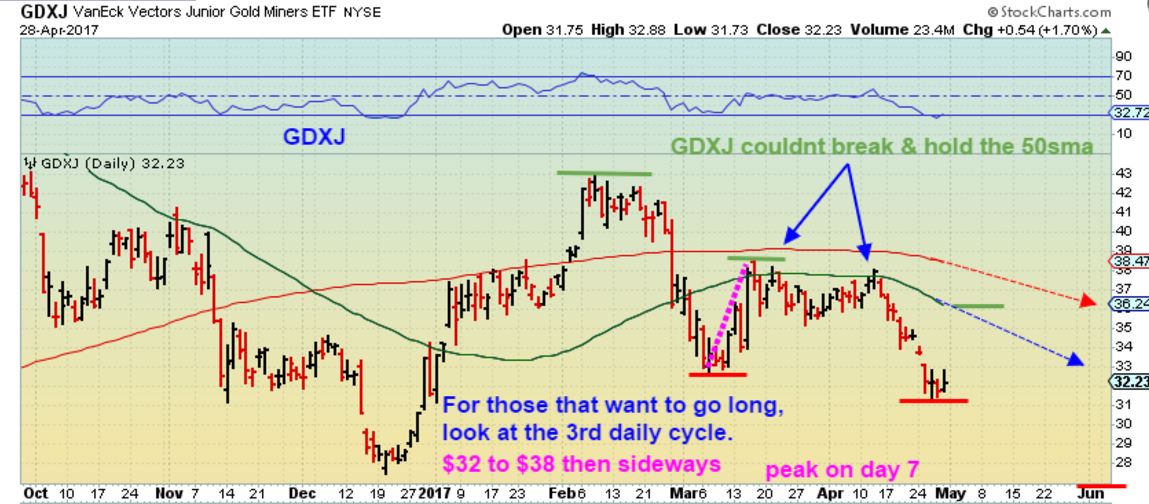
GDXJ – Just to give you a visual, this is not an exact scientific prediction. It is a guess using a 4th daily cycle as a guide – a weaker rally and the FED MTG propping Miners up in 3 days.
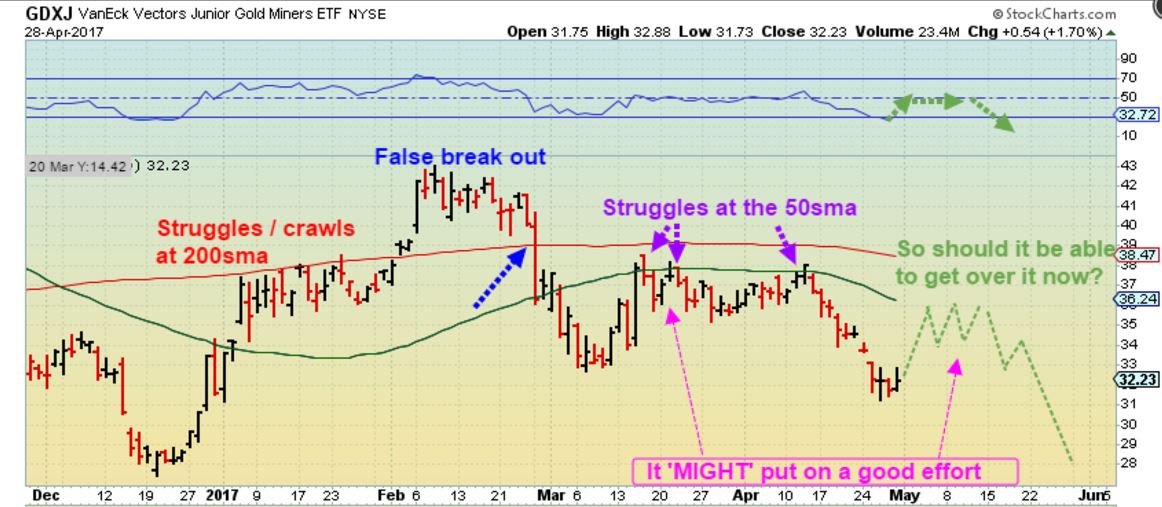
GDXJ – I hate to say it, but this was a weak effort by GDXJ, even though GOLD was very Bullish. See the chart, it looked like the old ‘bear market rally’ out of an ICL. Magenta arrows = 2 strong daily cycles in a bear market, blue arrow was the weakness that followed.
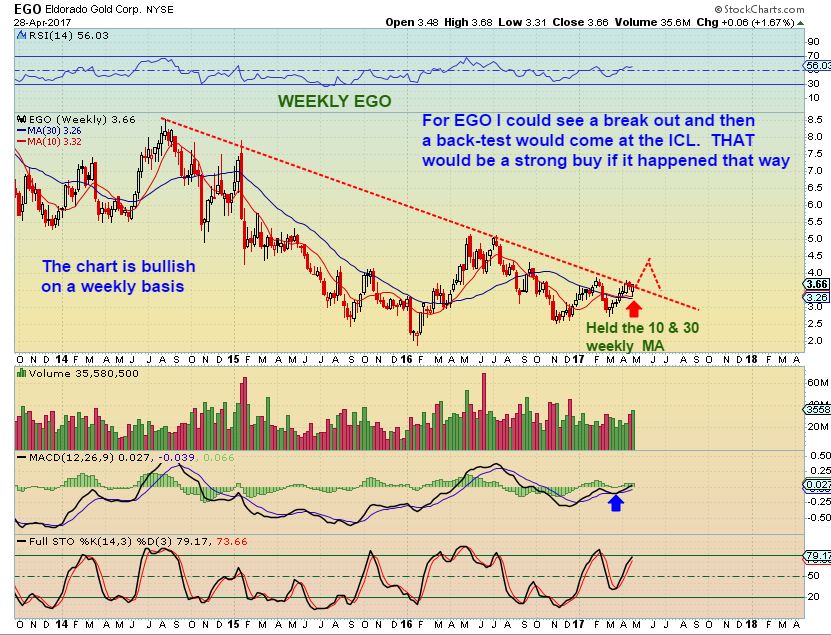
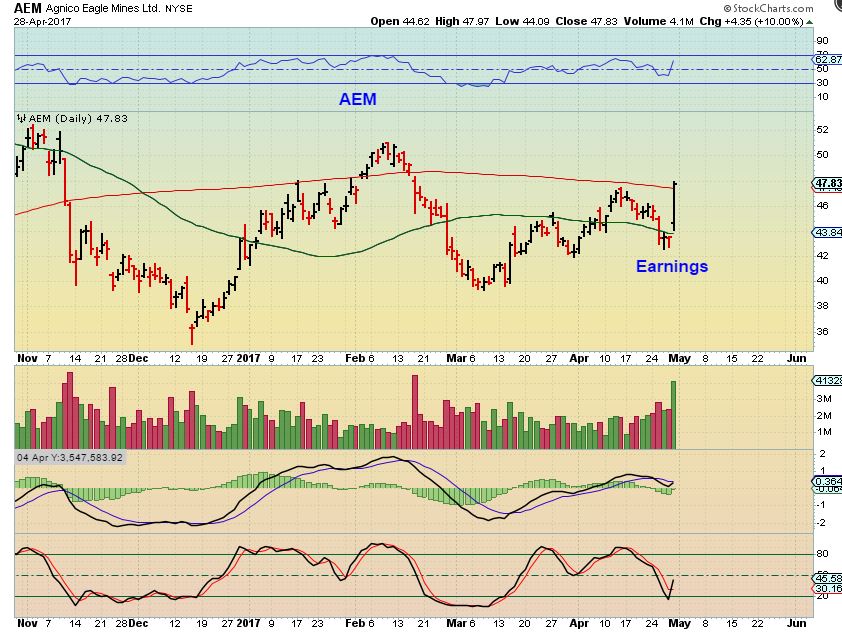
WHAT ABOUT THIS? EGO & AEM had a strong reaction after earnings were released. Of course I will be watching for ‘follow through’ and see how these earnings busters play out, but notice also that EGO got absolutely killed in February & March & then rallied right back. To me that means that ‘THE LOWS’ for EGO may be in place, but I would think that a drop into an ICL by GOLD, SILVER, and MINERS will hold back progress until the next Run higher. This could then be a stronger Miner in that run.
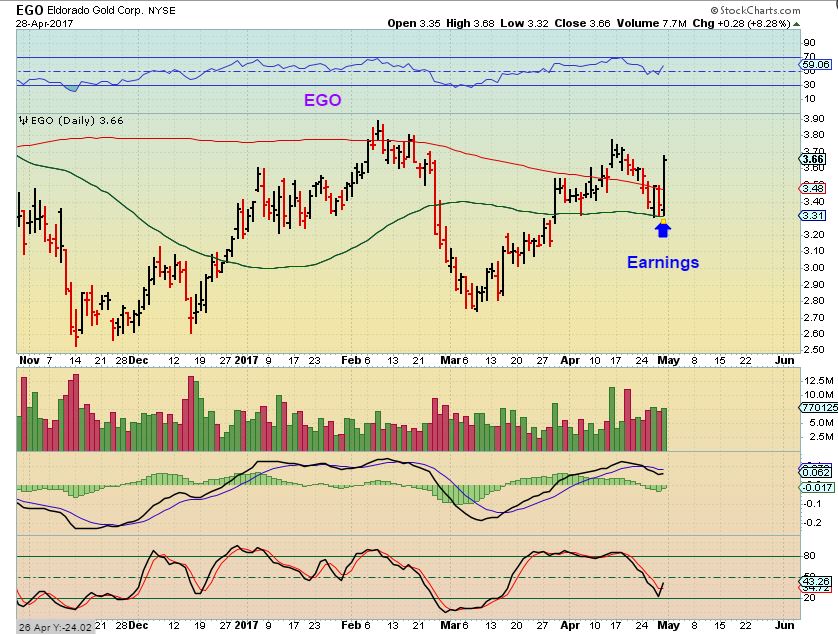
EGO WEEKLY – So if ‘THE LOWS’ are in place for EGO,and it POPPED after earnings, how could that play out? I could see it run nicely in this daily 4th daily cycle for Gold and then do a back-test at the ICL as shown. Ego would not fall to new lows, and it would be a strong buy then, because this is already a nice set up.
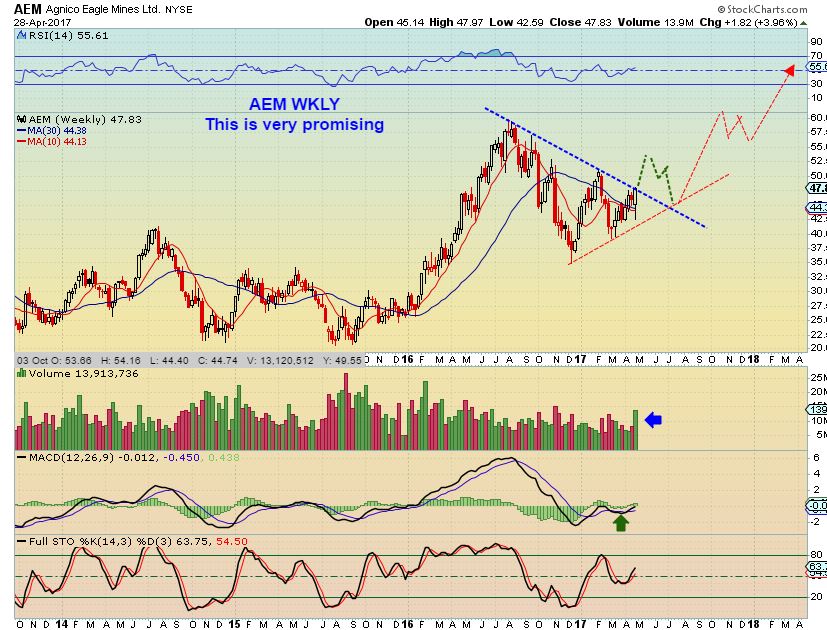
AEM – Ditto. These may break to new highs and then roll over & go sideways in the final sell off.
AEM WEEKLY – This is actually a great looking chart. Using TECH ANALYSIS ONLY, I would be buying both EGO and AEM with this set up. However, Knowing that we are expecting an ICL, I would expect that the 2nd chart could play out.
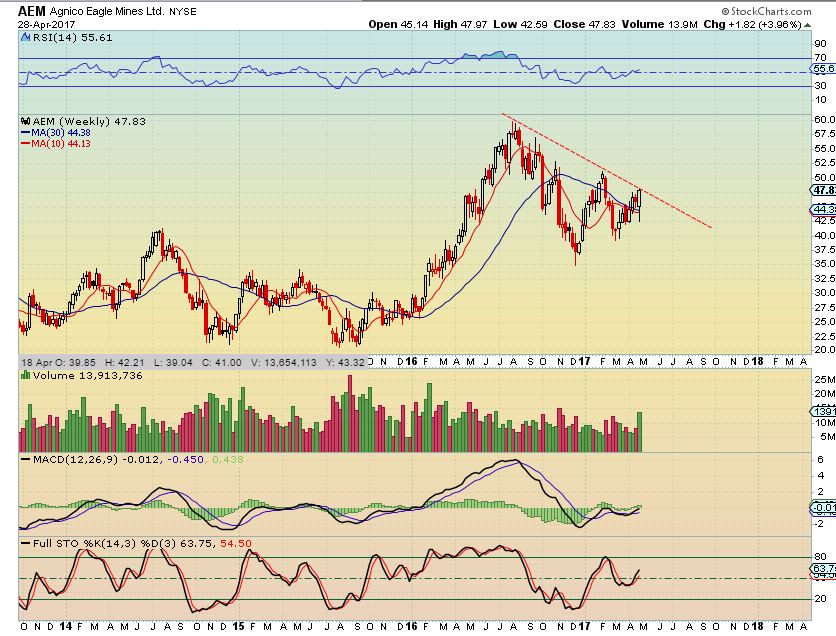
AEM weekly is an awesome looking chart though.
This is my analysis for the last few weeks leading up to the FOMC meeting and the French Elections. Add these thoughts to your own analysis and together it can guide you through the next few days and weeks of trading. Of course I will still have the daily reports and continue to analyze things, update thoughts, and follow the markets as things play out. With a Wednesday FOMC MTG, I’m not sure if anything really big will happen between now & then, but we’ll continue to Think Big-Picture, Set Goals, and Take action when the time comes. 
Enjoy the rest of your weekend and we’ll see you on Monday!
~ALEX
.
2 ONGOING TRADES
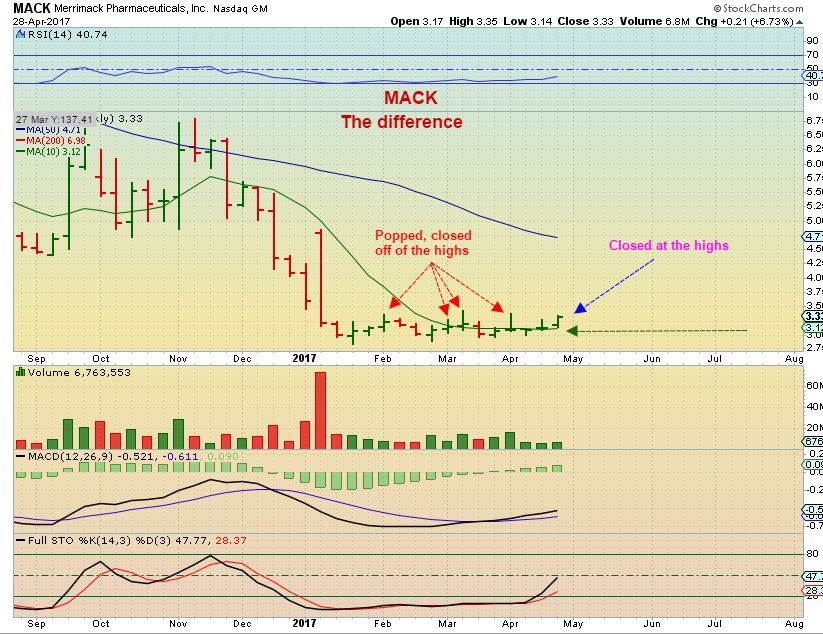
MACK WEEKLY – In the past, MACK has run higher in this base and sold off by the weeks end. This week it closed near the highs, remained on top of the 10 weekly MA, and we have a MACD cross. I’ve been holding this one for weeks, can I get some follow through please 🙂 It looks good so far.
EDXC PROGRESSION
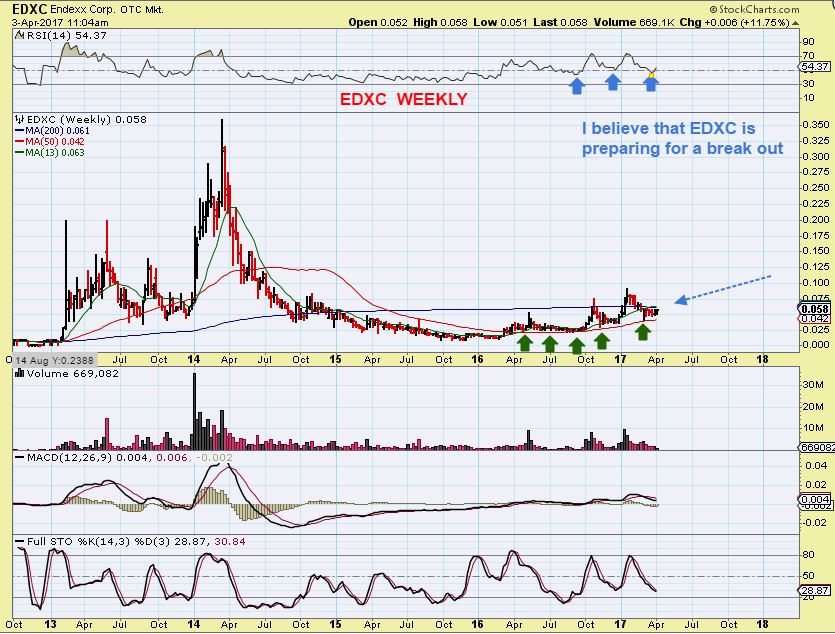
EDXC – APRIL 3rd – I pointed out that EDXC is setting up again and looked ready to break out. Notice that it was steadily holding up on the 50 ma ( green arrows) . This company has improving sales and recently came out with new products and a new contract for sales in their Tea market, so I like the story. ( Phito-Bytes).
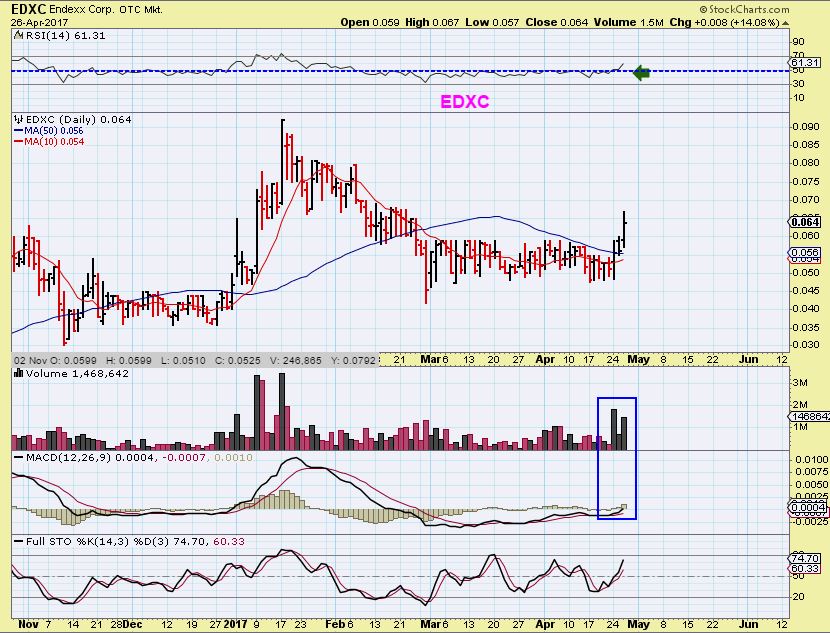
On April 26th – I posted this chart as it started to break out higher. This move put it above that weekly 200sma
I also posted this update for the weekly chart
EDXC – The last 2 times EDXC moved higher from the 50sma, it went up for 3 weeks in October, and 4 weeks in January. This is only week 1 and so far the move was big. It remains near oversold, not overbought.
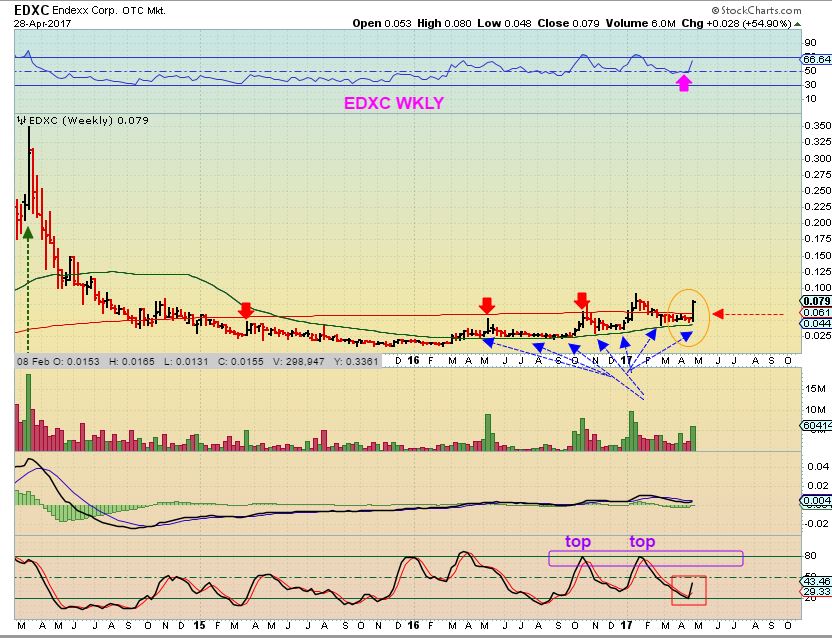
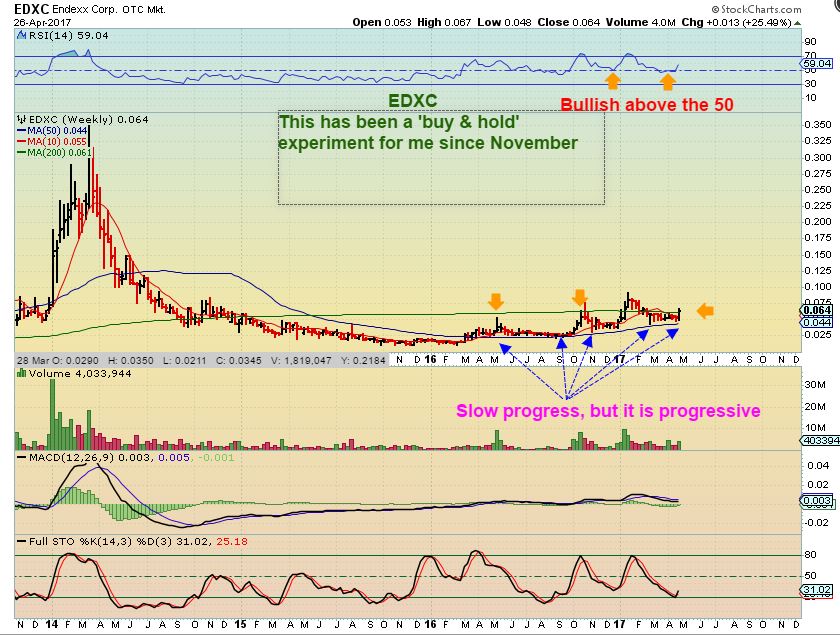
I believe that EDXC has a great chance to eventually run back to the former highs and even higher if they stay on track. They do sell a few new products and they have seen demand for these products growing. It has not been an easy ride if you watch it constantly day by day, but I don’t. I bought it at 3 cents and I’m just letting it ride. Here are 3 articles that discuss recent progress of EDXC . Continue to do your own Due diligence.


Check out STAF. They rejected a $1.10 buyout from an investor. Earnings coming up. Chart looks good IMO.
I do like that chart – Both the daily chart and the weekly 3 yr is nice too.
Thanks Alex. Great report again!
Thanks H50!
Alex, just reading up on EDXC, the autospence system they have, seems and sounds alot like what medbox was supposed to be? Have read up on that end of their business?
I remember MEDBOX – It seemed like they were trying to become a dispensary service ( like a vending machine – similar to those red boxes for movie rentals )? I’m not sure they even had a product, just that they were going to be a distribution service provider ?
Most of what I have read about with EDXC had to do with sales of thier various products. What I did see with EDXC autospence was that they were gaining approval for a way of providing their prescription product to customers after hrs, but I didn’t see details of how it worked ( And it seems to be more of a secondary convenience – not a main service of theirs).
In the end, I’d just have to say that I do not know the details of autospence.
As if FOMC wasn’t enough for this week, reminder Jobs Report comes out this Friday, 0830 Eastern.
Thanks Cason….forgot about that one. Jeeez busy week.
Maybe add LTBR to MACK and EDXC?
Yes, LTBR has been doing well, but it is not a trade that I am currently in. I had announced that I sold mine, but I still get readers asking if I am still in MACK? Or am I still holding EDXC. That is why I pointed those ones out as ongoing trades for me- just to show why I am still holding.
LTBR does look good and I did mention it a few weeks ago, but I do not own it. If I owned it, I would hold it and watch how it acts when it gets to the 200sma , which is overhead. It could break out above it and continue the run.
Its a good chart.
Hi Alex,
AKS…quick thoughts are you holding? At the lows this morning?
thx
I’m still holding, but I’m watching it. Looks like a double bottom with MACD Divergence so far. I think many areas are just POPPING and then bouncing around bottoming, rather than popping and taking off unfortunately. It could get boring before it gets better, I’m not sure.
If it breaks the lows, I’ll probably just cut it loose and take another look when Steel stocks steady up a bit.
Alex – that dip this morning in EDXC – good time to get more if one was inclined?
REFRESH – YES I WOULD THINK SO. It usually dips to the 10sma
https://uploads.disquscdn.com/images/922047a37d0459d9bd60c01353ab330c5a3ef3fa2010d5a2b3e5e555d9391da6.jpg
Starting to buy Uranium…..I may be a tad early though but want some skin in the game now.
Which do you like better…UUUU or URRE? Was just reading that URRE is starting to add a focus on Lithium.
As of this morning:
NXGEF & URG
What in the world ever happened to that PALAF
POOF !!! 😉
No idea although still trading in TO I belief….. ??
I’m not sure what TO is.
I still see it on chart services, but it has been frozen since March 8th. Cant find any news on it ( I dont want to touch it, I am just curious as to what has happened ).
TO: Toronto Exchange
Oh, right.
Actually the IIROC halted the trading, I think that they are like the SEC of Canada , so I would think have expected that trading was halted there too.
Yea agree….???
Or a share transfer ???
Yen looking for a bottom at the 50 dma ?
JO looks like it may have found it’s bottom……
https://uploads.disquscdn.com/images/87ffeb5cc483270c5a723fd304f40a4814ddb9b38a0751d19908729bc23452e9.jpg Only up 7000%+
on 350k volume?
The emerged from bankruptcy and cancelled old shares, re- issued all new shares
WEAT is on fire today!!!
Alex,… check out MACK on this 2day chart.
in past year, whenever price exited below the lower band, then re-entered and crossed above top of lower band, there was a rally
we are at a similar point again, so fingers crossed… will it reach the top band @4.70?
https://uploads.disquscdn.com/images/ed6732fd8d55efd0be0c908caa03b8c01e62c1f0a17ff4b123319041f8b51508.jpg
Suddenly, I believe in miracle 🙂
I was looking at that base and thinking that it just reversed at the top and may head back to the lows in this continual sideways base building. I like your idea better .
Flat base like that looks more like a bottom than a bear flag. IMHO
so far so good,, my PPO indi showing breakout and backtested coil.
i’ll sell if we fall back inside.
https://uploads.disquscdn.com/images/891cb0f5488dbcb3827ccf976369e267f22b9842c5a125732cd7e19633539e77.jpg
Chotfreak, what do you think of the ONCE chart below. I took the ride of the 2nd blue arrow and exited in the blue box. Looks like it wants to continue on again? https://uploads.disquscdn.com/images/c7b5d59a6a073ff2f7a98befe1c99f8e11eff3d97782d0b239fa5e4549c1a82c.jpg
At this point, it does look like a continuation of that move.
If you pull up the 200 & 50sma, it just broke above both & looks like it was supported there.
Refresh – Miners still do not believe that Gold is ready.
I would say that on the FOMC WEDNESDAY, they will finally act together again.
https://uploads.disquscdn.com/images/d6e81f5ea4984073abbd062fb5a09822da36b536c2de62cc7f08ceb4b53adb2c.jpg
CF,do you think CLF has bottomed?
I think many of these ‘are bottoming’. It can be a process and that means that the lows could be in, but this may not just take off higher, they may build bases.
Look on a 6 or 7 month chart and you’ll see that Many ( like CLF, AKS, X, etc) have gone all the way down to their November GAPS, and filled them. That COULD be the bottom of this sell off.
Thanks a lot. I am thinking that this is the yearly bottom for steel.
I think that the second half of this year could be very good trading,
but this bottoming process is definitely a bore 🙂
Gold just reversed and followed MIners down, and Silver joined in the sell off.
AT THIS RATE….we could get a dcl on the FOMC and then a short term rally topping out L.T. and roll over into an ICL sell off.
Obviously the rest of today & Tomorrows action will even give us a clearer idea.
did you add jnug the last minutes? or it’ still not low enough
No, gold just reversed and sold off is what I said in the comment above.
Miners were dropping, Gold was rising – one was lying.
Gold reversed and sold off.
I also said that we could get a DCL on FOMC – That would mean a low on Fed Wednesday, so JNUG here would be a big mistake
However- pretty light volume selling on GDX & GDXJ
Interesting ( And it may not last), but GDXJ is selling off and is down over 2%, JNUG just popped higher and is only down 1% now.
That means that the 3x etf is down 1/2 as much rather than 3x as much. Odd.
OK, that was a false reading on JNUG. I captured it here, but refreshed and it never happened. Probably one of those phantom candles but I wasnt using a candlestick or OHCL chart. So this move never happened, but it showed up on my line chart
https://uploads.disquscdn.com/images/270d8af7cef8b3923d234401c1eec16f0331788f95d2ce275a437d3dd6033ba8.jpg
it showing 16.80 on freestockchart so not sure where you have 17.667 ?
Yes, I mentioned in my comment that it showed this momentarily and then I refreshed and it was gone.
The chart for TGD actually looks very good right now.
Look at it with a 200sma and a 50sma, and this is trying to break out.
On an individual basis, it looks good, but it has been hit by ICL selling in the past.
Another bullish set up for the watchlist at the ICL
Alex, I stopped out of AKS by a hair. I read your comments, but not sure I understand how to determine when to know when it’s time to get back in.
If I got stopped out, I’d forget about it until it then proves itself.
Being stopped out is a protection in case the sell off continues, and it limits your losses, but jumping right back in during a bottoming process could lead to getting stopped out again and again.
When I am stopped out, I usually just move on and then I wait for a move above the 10sma, maybe a down trend line break out, etc. It means that the trade didnt do as I expected it to do when I bought it, now it has to set up bullishly again for me to be interested ( I didn’t get stopped out, because I have a small starter position and could afford a deeper drop since it wouldnt lead to a large loss. Different than if I went in really heavy & needed a tight er stop).
At this point AKS looks like a possible double bottom, divergence in the base is positive, but it could just base out for a while instead of taking off higher right away. It could also drop again – so it is rather neutral.
Thanks. Both comment are very helpful!
HPJ!.. think the party’s over for now.
That was/is a nice chart though…..
musical chairs…..
u da bomb 😉
hope you kept all your money!
yeah.. i heeded ur warning…
nice job 🙂
again…tx for lookn out 4me 😉
uDaBomb OLD man….
teehee
🙂
seems to follow gold /miners… lol
Yeah, it was riding that 13 sma nicely….until it wasn’t : )
but look carefully at that pattern… it’s right on schedule for consolidation…. craycray
https://www.tradingview.com/x/xICLo5VF/
Sorry, but I am missing what you’re overlaying HPJ with, and the time-frame. TIA
its overlaid with an earlier HPJ (from 2013/14.. i think), and weekly timescale
OK. NIce. I will have to test it out later tonight. Thanks.
yes.. this is a chart I made last july – I have been in and out… I told myself SEVERAL times I would just buy a couple hundred shares and sit still … butttt .. that was an epic fail on my part .. ha ha.. I cant seem to sit through the consolidations… ;o)
ps. that “we are here” is old … I will change it now … so you can see it better…
here… better?
https://www.tradingview.com/x/KmOT81Ci/
tx 😉
lets follow closely then…. if goes sideways here, you may be on to summink.
..and i mean a ‘sideways’ which may include hitting previous peak again, but in a trading range
SO NATGAS FINALLY dropping, UGAZ & BOIL gap filling, but will it hold support.
I’ve been waiting patiently for weeks to see how this plays out. : )
Maria’s observation of last years’ chart of NATGAS during the same time-period is still in play. Kind of scary actually…in a good way.
https://uploads.disquscdn.com/images/3963bb97998b7e17160f64eedaab8ce4e0f4bf319b17d0c20c82d171c850bc74.gif
Nice move higher in COPPER, but not a lot of reaction in copper stocks yet
SWN now has a MACD cross on the 5 day 30 min. Yeah!
Call me nuts, but I bought TSLA
Price target is supposed to be 400
I get $360ish as a 1st target, but I like it a lot.
I also still like the set ups on TTWO & JBL, but they can take time to run ( TTWO has done well though).
NAZ looks excellent today, SPX small consolidation, IWM…. iffy).
Earnings out on Wed…TSLA.
I think it looks good
Thanks for checking Alex. 🙂
I’m probably the only one here who cares about the general market but TQQQ just keeps rocking. I’ve been waiting for a dip to the 10 day SMA to add more but it never gives me a break. I’m heavily invested but I’d like to have more. Maybe the Fed Mtg and/or jobs report will give me a dip to buy. I’m very bullish on stocks long term so I want to remain invested in TQQQ as long as it remains bullish.
I’m in there with you, having bought TQQQ on the test of the 50 day ma @ $86.
No chance to add yet. https://uploads.disquscdn.com/images/800f8c90306b3204b244ab971d67ee00b0aad9a61d1a1087e708984520b4196d.png
That is a solid 15% gain.
When will you lock in profit, or are you just planning on riding it out, even if it dips?
I do look at those gaps and wonder if we get a back test gap fill post Fed.
Trailing stop is an option too – or partial sell if you went heavy.
That’s always the question … let it ride or sell some to lock in gains. In my retirement accounts I’m inclined to let it ride which means a pullback to fill that gap would give back almost all of my gains. So I may lighten up going into the Fed meeting. But I’ve found I make more money in my retirement accounts by not over-trading and I’m long-term bullish on stocks. I’ll play it day by day as I am a “buy and watch” investor rather than a “buy and hold no mater what” type of investor.
I’ve been using the 10 day ma, which is 6 points lower as a result of this sharp rally. I may move up my stop to today’s low, since this a 3x derivative. As ‘they’ say, a bird in hand is worth 2 in the bush!
I made a (personal, not based on data) rule to never hold 3x ETFs more than 2 weeks. If I’m still bullish at that time, I just sell and switch to regular version or a correlated stock. Got hosed on NUGT back in 2012 and hasn’t happened since:)
I agree. Sold mine a few days back as I felt it was too stretched. Now, waiting for the same pull-back to add again. Those gaps are calling – I hope!
You dont have to risk much to buy GUSH here! Less than 3%
Targets hit https://uploads.disquscdn.com/images/e68e672e4b596f4fc944f704391228ea10a227b80f6658290dd8a80875edab8d.jpg
Just in time for the FOMC
JDST trade was awesome.
I know, when it finally got going. Now I’d like to see a good bounce and then signs that this is going to be a L.T. 4th daily cycle. The next JDST trade would be a lot better.
Then flip to JNUG if we get the ICL .
JDST seemed much easier to hold then JNUG does.
My exit was total crap. But good trade none the less.
THANKS BILL !
REALLY GREAT WORK !!!
Let us know when we can temporally long with GDX or GDXJ.
See you soon back.
Just noticed on the 2 hour that GDX has a positive TSI divergence back to 4/26. Entered a NUGT trade here , taking a shot at an FOMC DCL. Hopefully they don’t run this under $21 and scare me off lol
I was just looking at JNUG and thinking very similar thoughts ( Even the part about running ti down one more time before the Fed) lol
I’m trying to figure out if it does turn up does it fill the gap on the 25th or make it back to the $24 area .. there is the lower channel that GDX might be forming and I’m concerned that if it breaks $21 it is going to the low $20s and I think the bounce from there will be much weaker. We shall see
GLD broke the 200sma and re-gained it. GDX GDXJ looking like reversal candles. Could be preparing to move higher after the FOMC ( Or even front run it).
Also I’m no EW expert but there are 5 clear waves down on GDX , with a positive divergence, and in the time frame for a DCL with an event that has triggered a DCL that last three times . It’s almost to easy … I wish it was at the lower trend line now . Still taking the trade though
The timing should be very close. I think the FOMC will trigger a rally with the timing set up the way that it is. I just cant tell if todays reversal candle is THE LOW or will it get slapped tomorrow too?
And a slap down will take 10% or so off NUGT.. I took a half position here because the trend line for GOLD and GDX is so blatantly obvious that I can see the banksters turning it here not letting to many on board and then run this right through the upper trend line and dump… If it does break lower I will add the other half then.. if not then I’ll have a nice enough profit as is
WRN:
Stop now below 1.09…..
Yeah, when I mentioned the move in copper below, many copper stocks werent reacting ( FCX not so good), but now TGB, HBM, WRN look better
I should have taken some HBM at the close…..dang it…..too late.
I was liking HBM & TGB. There’s always tomorrow.
Are you still in SID ? I am thinking of raising my stop to below 10 dma kinda tight though …..
REMX Too…. wutcha think too tight ?
I am
Was ?
URA…..adding 1/2 tranche…….
also DNN……
Gold and GDX both in a final wave 5’s for the low…..one more push down in the works ?
VIX close to breaking 10 again…..at the low of 2007 – 2008 …………
AMD dropped $1