
Looking For A Little More Traction
In recent reports I’ve been pointing out various Miners that have been setting up in bullish manner. On Monday we watched Gold fall to new lows again, but then Gold flipped higher and put in a nice reversal. Maybe now we will see the precious Metals sector gain a little traction? Let’s take a look at the markets, and then we’ll review some more bullish looking Miners.
.
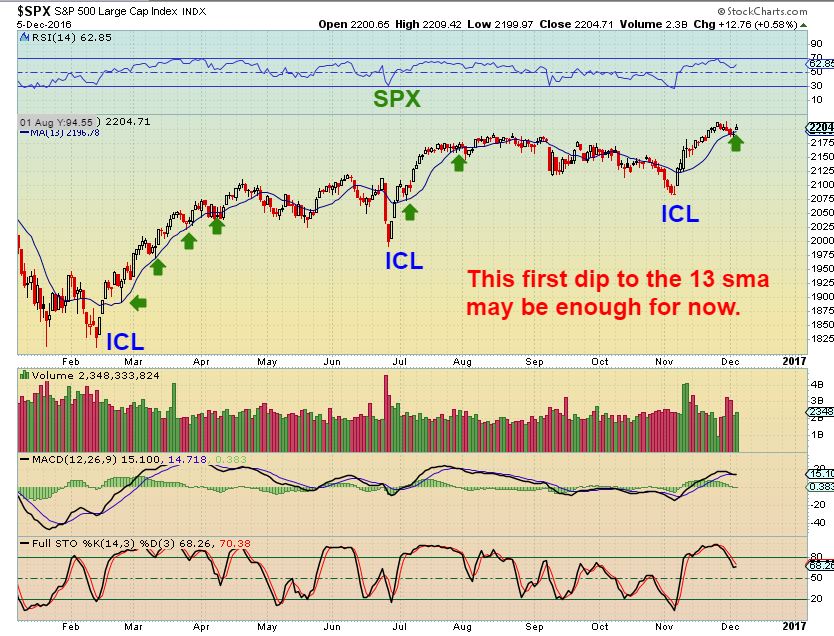
SPX – The dip that we saw may have finished its course at the 13 sma. We did see that in past moves out of the ICL.
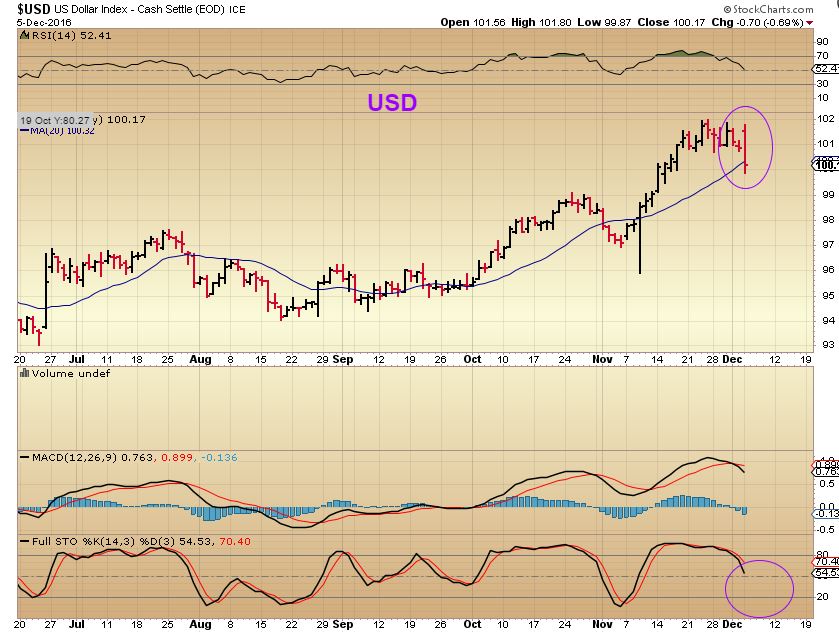
USD – We’ve been expecting a drop in the USD, and we sure did get one Monday.
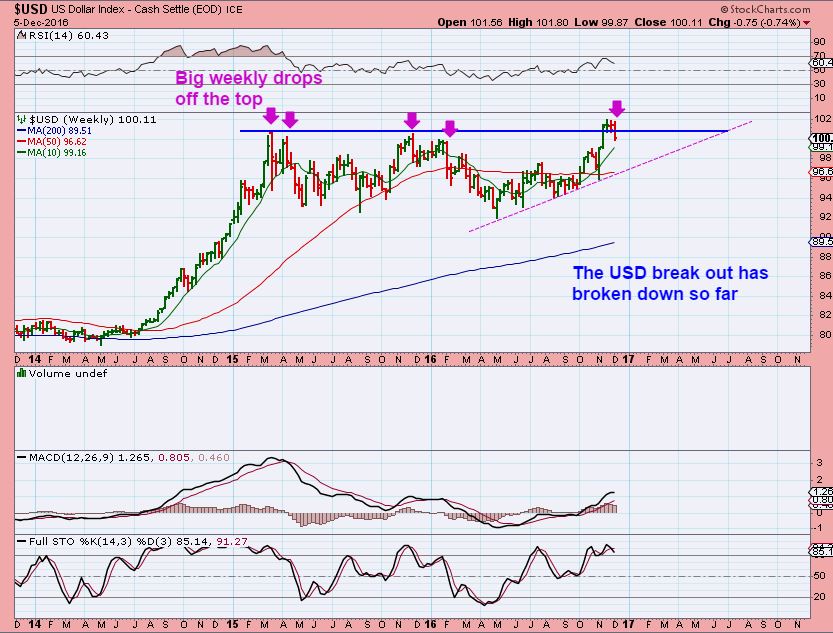
USD WKLY – I pointed out the USD break out 3 weeks ago. It has fallen back below the highs so far this week. In the past, you can see that some drops from the highs were long red weeks down. This would be bullish for Gold.
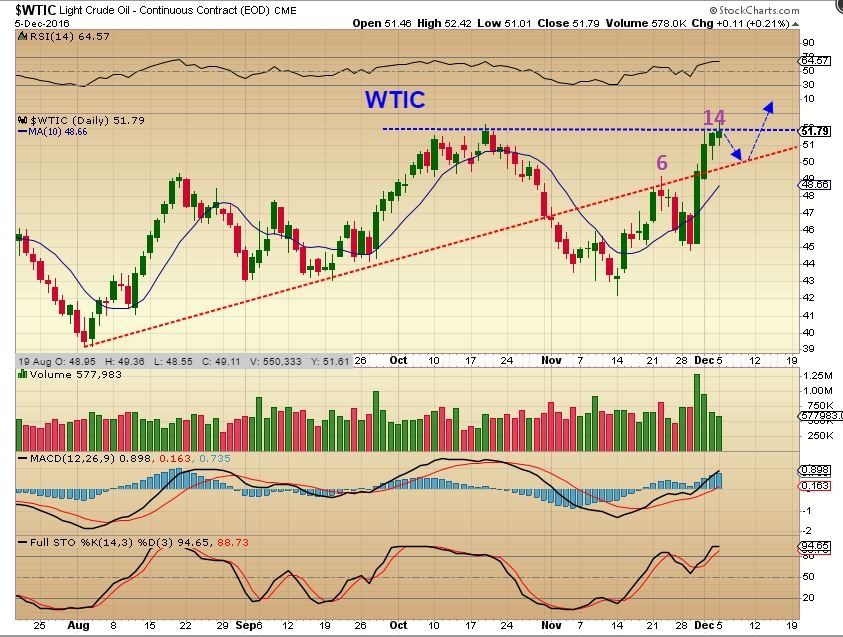
WTIC – This was my weekly chart in the weekend report. There was no big change on Monday, this looks like it wants to go higher. It is somewhat early in the daily cycle, so there is time for Oil to break out convincingly in the near future.
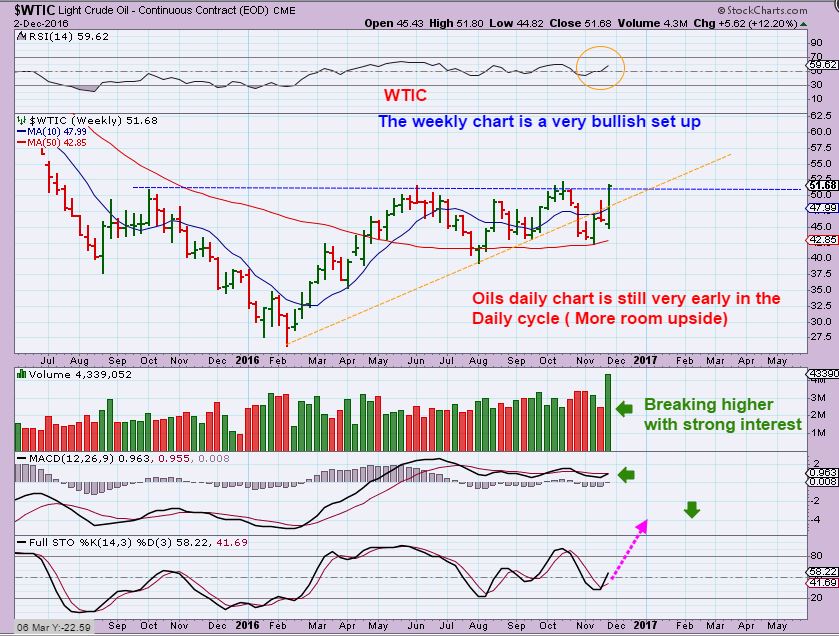
WTIC DAILY – We may see a small pull back first , before breaking above resistance.
.
GOLD , SILVER, and MINERS
.
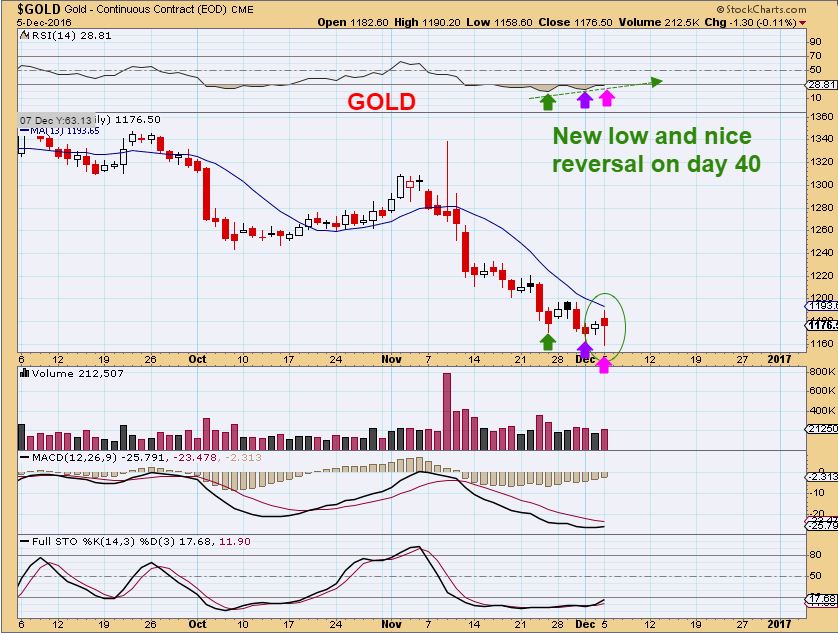
GOLD – Gold dropped to new lows on Monday, and then we got a nice reversal 20 points off of those lows. We are overdue for an ICL, so this 20 point reversal should finally be it on day 40. We’ll see if $1158.60 holds. A break and close above the 10sma is the start of confirmation of a low.
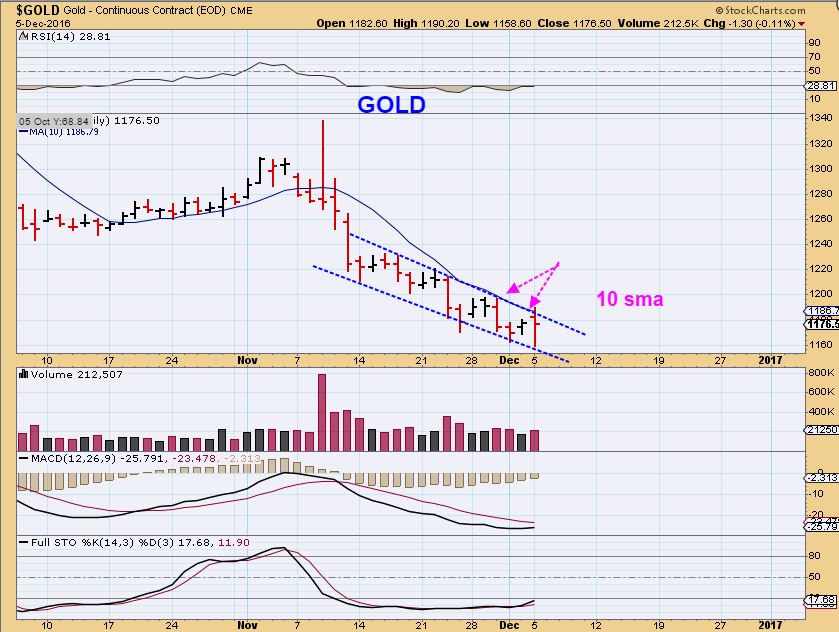
In the above chart I accidentally used the 13 sma, so this is where the 10sma is. It is in the $1186 area.
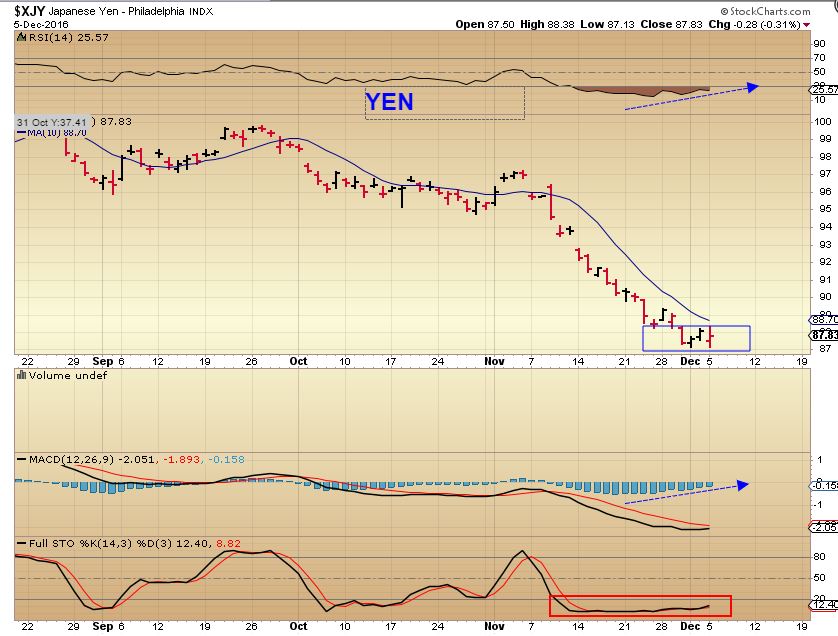
I discussed recently that I did some research and reports in the past on the close path that the YEN and GOLD take. The YEN also looks to be bottoming.
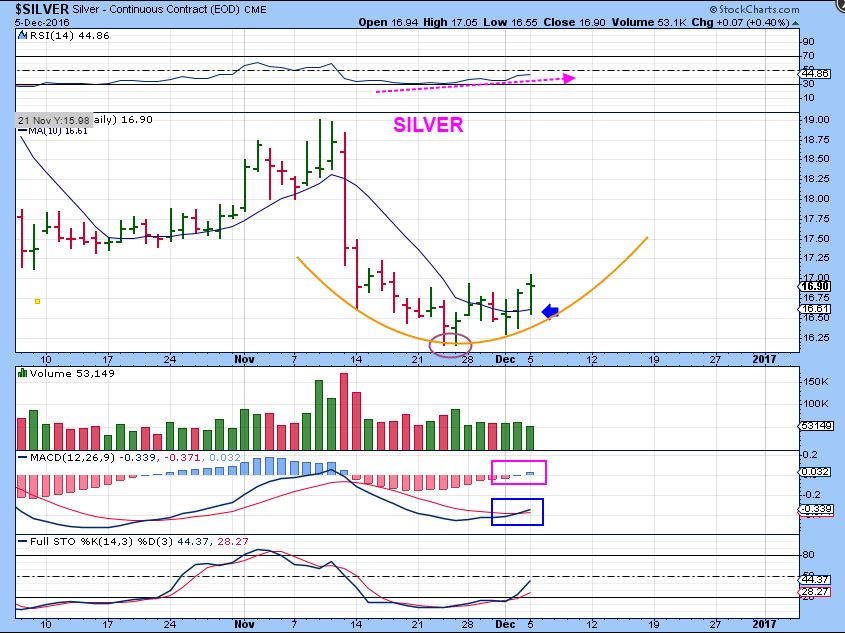
SILVER – You can see that Silver has been showing more strength than Gold. Silver closed above the 10sma Friday and Monday. Mondays drop in silver actually bounced off of the 10sma.
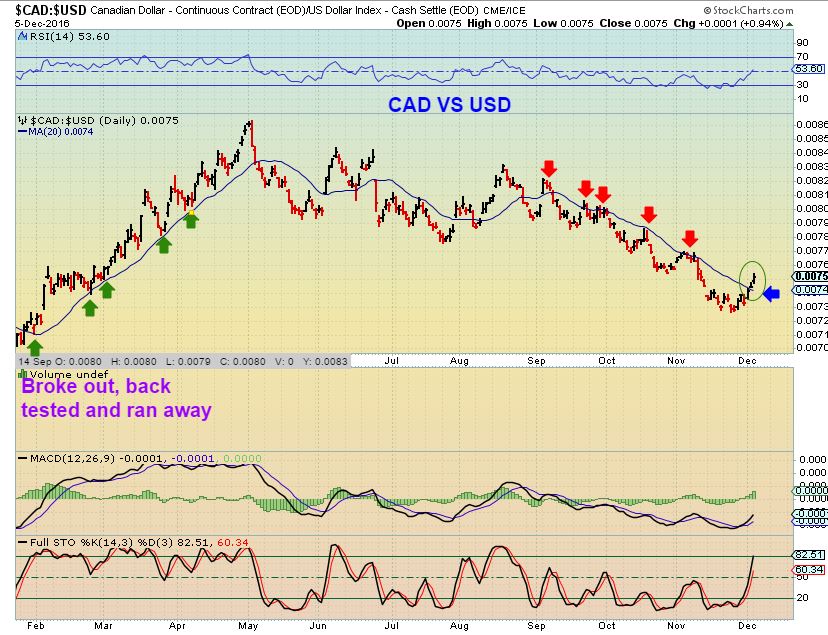
Also mentioned was this chart, captured after Thursdays trading. This is the CAD VS USD. A break out last Jan was Bullish for Miners.
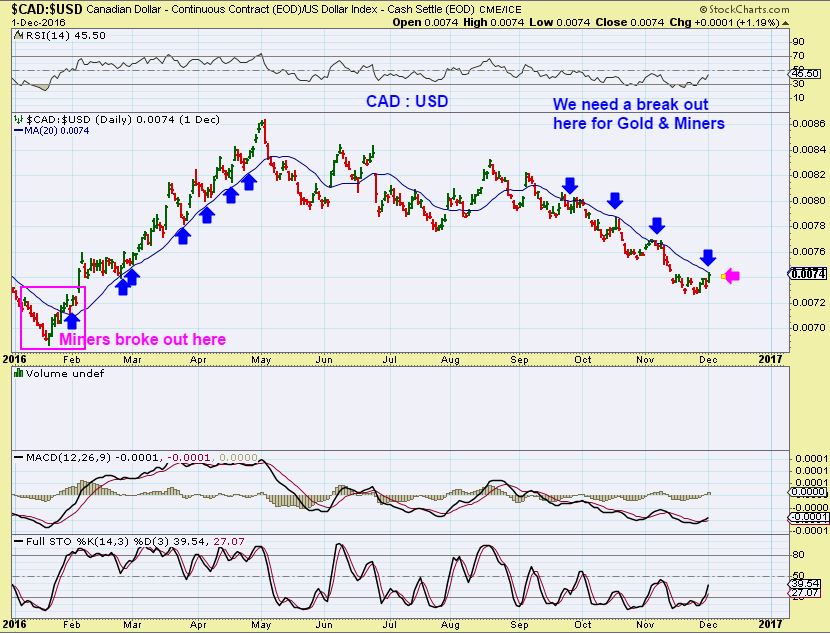
CAD VS USD – With the USD dropping, we currently have a break out above that 20sma taking place, and some of the Miners do look bullish.
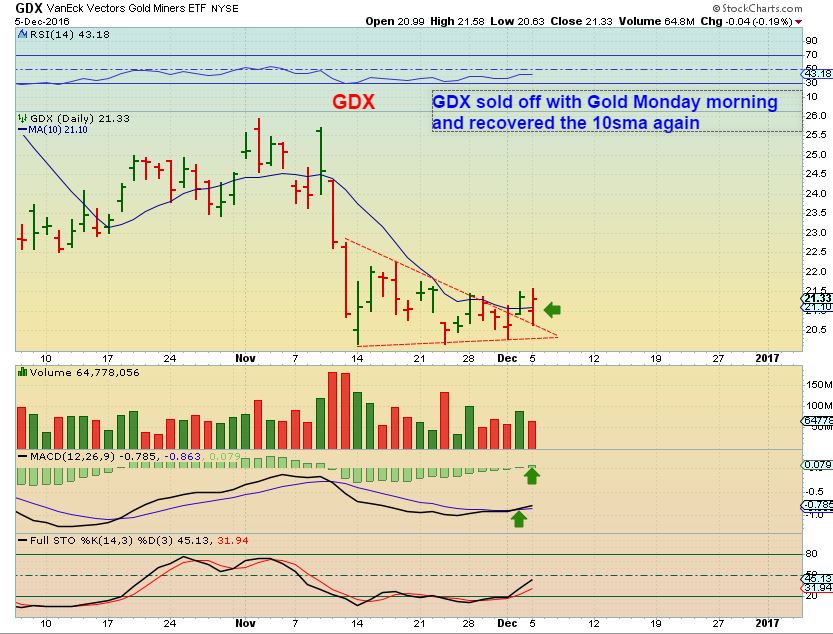
GDX – GDX closed above the 10 sma Friday and Monday also. The morning sell offs do not have any follow through lately. There is strong resistance near $22.50, and this sideways move is likely building strength to PUSH right through it. GDX is very bullish above that area in my opinion. I am Bullish here and now.
.
So there it is, it seems that the Precious Metals are just lingering at the lows. We see a sell off in the morning, and a recovery into the end of the day. While that is encouraging, we really look forward to the day when this sector really gains some traction. It should be happening any time now, we are due for an ICL and a strong move higher should follow. Let’s see what Tuesday can do for us in that regard, and after signing off, I will list some bullish looking set ups in this area.
.
~ALEX
.
Reminder: I always own a small basket of Miners ( usually 5 or so ) to reduce company specific risk. I may sell one if it lags too long and rotate into another better looking set up as time goes on. We have all seen the dreaded “public offering”, where a company raises money by selling a lot of their stock at a reduced price. Other risk could be that heavy rain causes a flooded Mine, there might be a Fire,etc. These and other types of risk that Miners carry are reason to buy more than just 1. So if you are not trading an ETF like GDX or GDXJ, I give a variety of trade set ups. DO NOT GET OVERWHELMED if I show more than 1 or 2 set ups. I show them as they form. That doesn’t mean you have to have a little of each, I only grab 4 or 5 at times, and use a little leverage when I feel we are at the lows using Cycles. Do some due diligence if you wish, and see which set up is one that you may want to own.
.
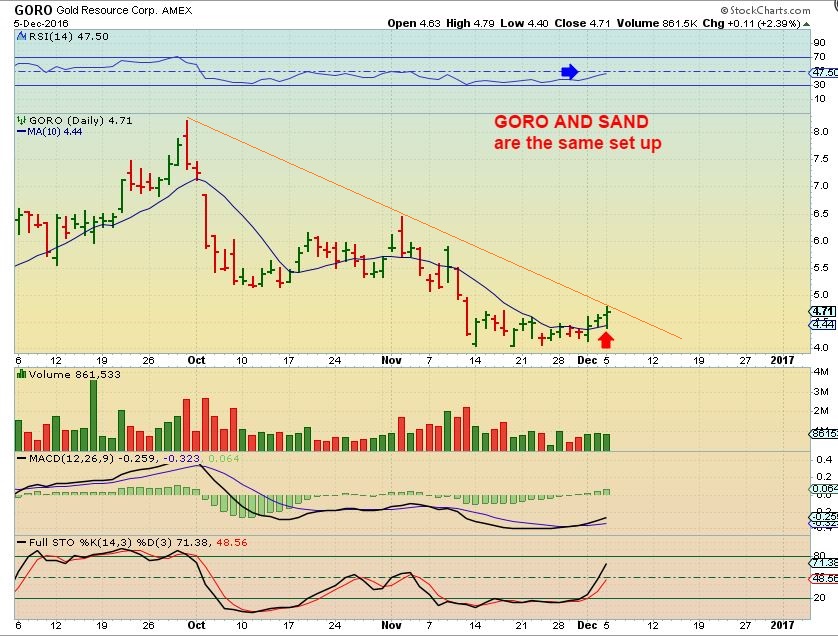
GORO – This is a flat base that looks close to a break out above the downtrend line. I found several Miners with this set up. It is above the 10sma and it can be bought here with a stop below the lows to keep losses to a minimum, but the potential gains good.
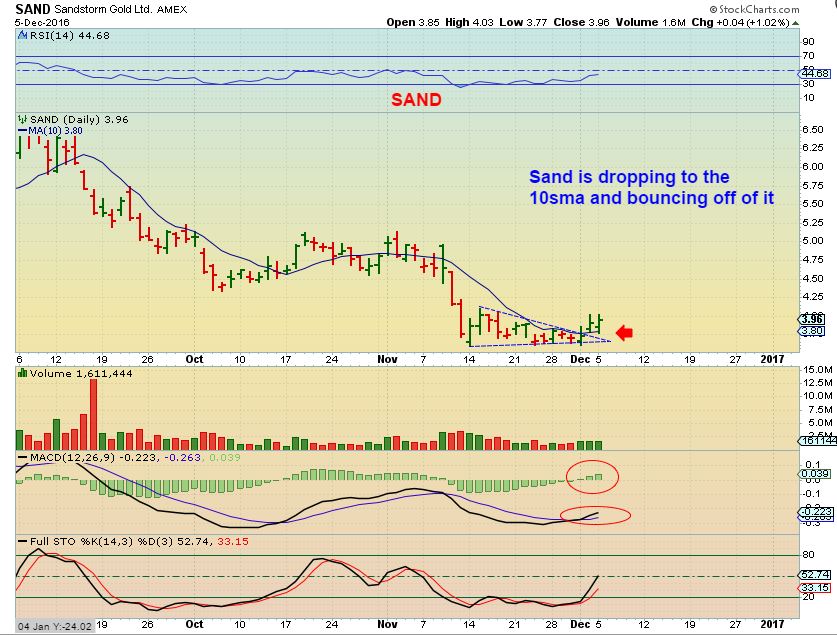
SAND – Similar set up. Stop below the recent lows.
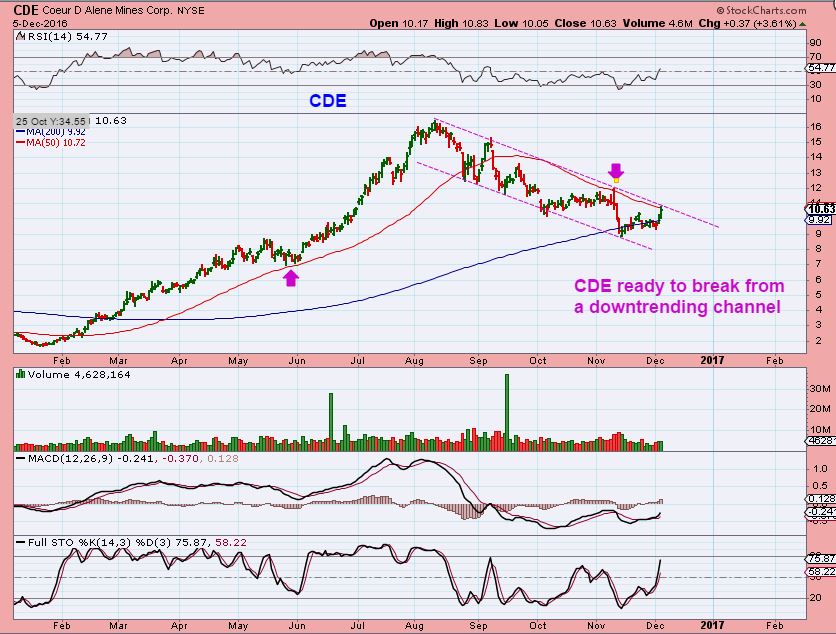
CDE – With Silver still at the lows, CDE has been moving higher and was riding along the 200sma. It almost looks ready to break from the down channel. A close above the 50sma is considered bullish too.
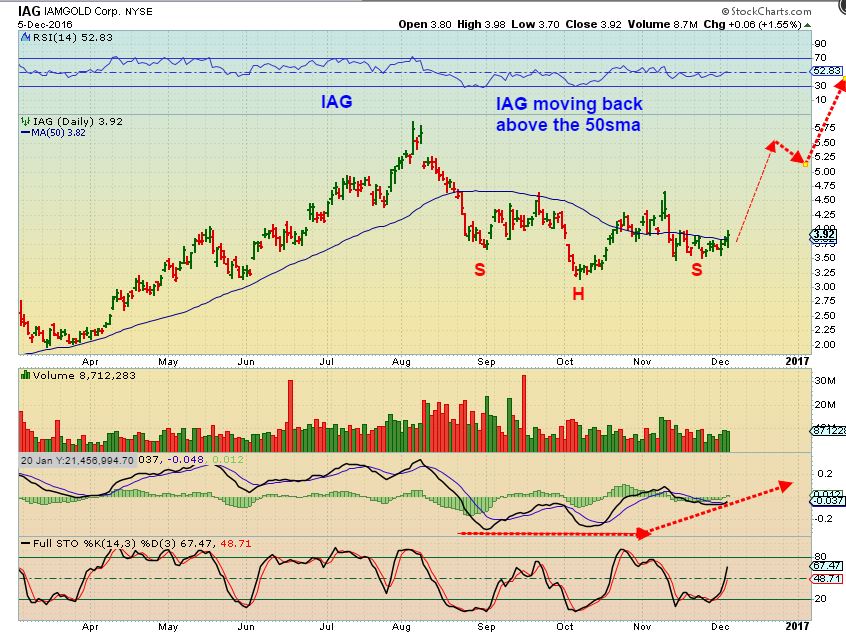
IAG – I have been pointing out the strength in IAG for a while. It could now be forming an Inverse H&S. Usually people wait for a break of the neck line, I like this here as it rises above the 10sma and IAG shows strength y remaining above the October lows when Gold has been making new lows.
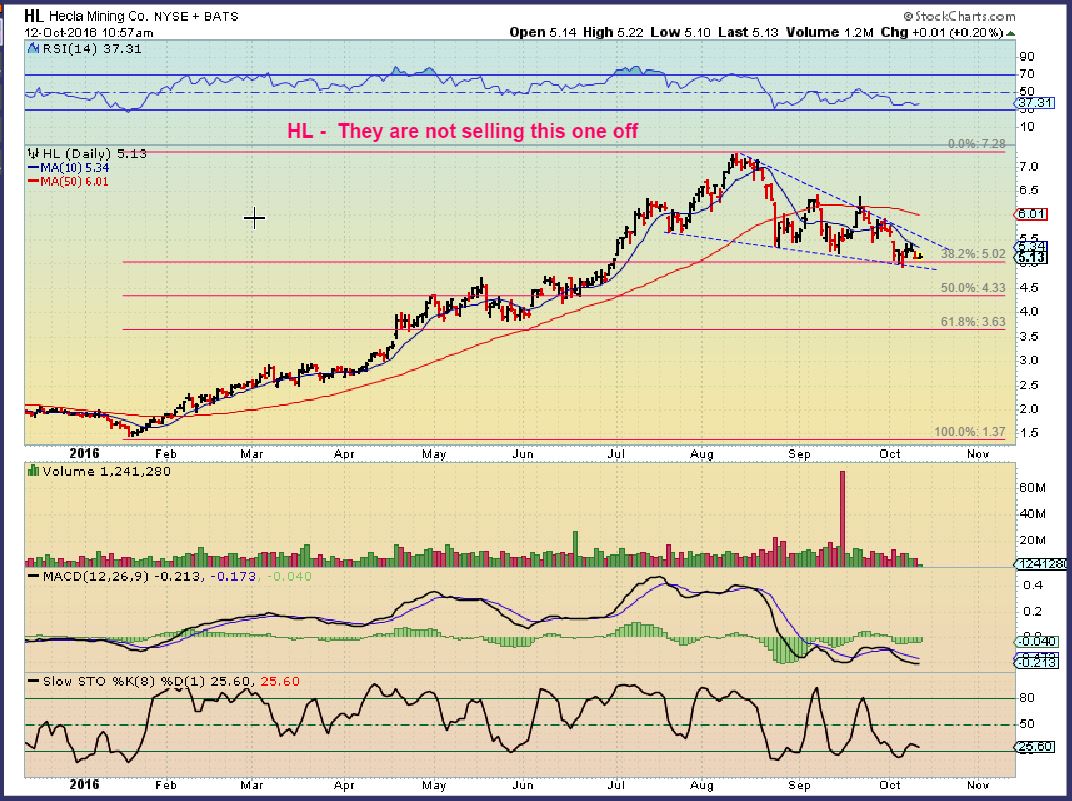
HL Chart #1– I have been pointing out HL for a while too. Here in OCT it looked to be putting in lows, and only pulled back 38%.
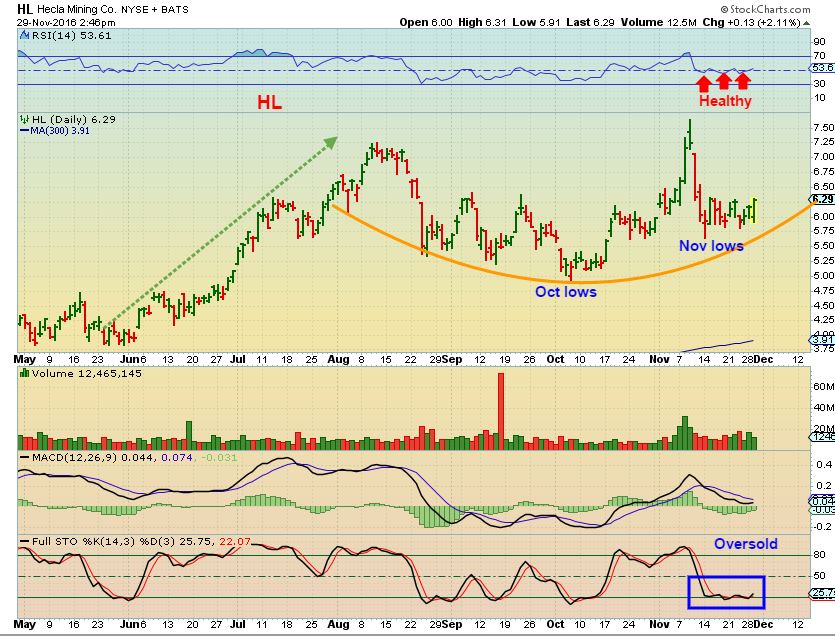
HL Chart #2– So here we see that last week HL also has an inverse H&S shape, with the Nov lows unable to get back down to the Oct lows.
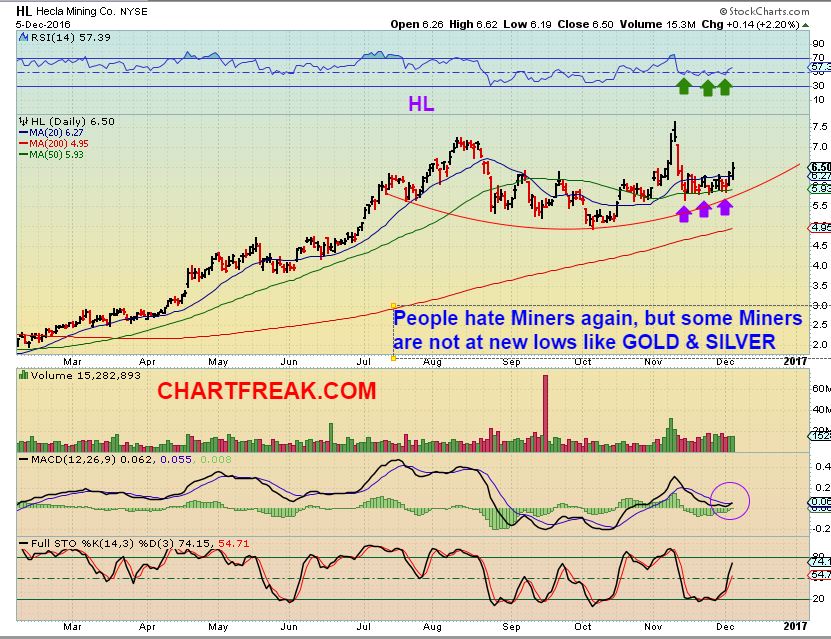
HL – HL was holding above the 50sma, and also moved above the 10sma Monday
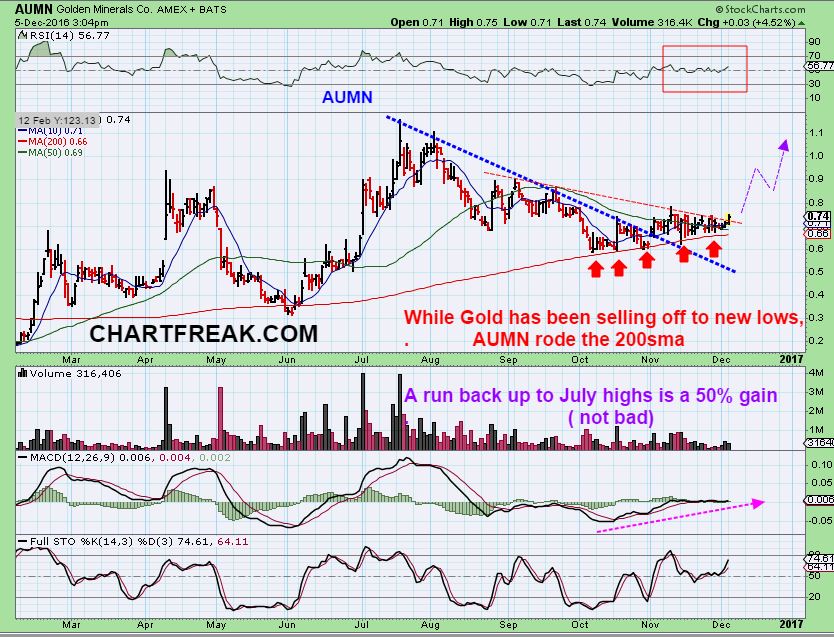
AUMN CHART #1 – In October, AUMN looked to have bottomed with a 20% burst off of the 200sma ( Not shown)..
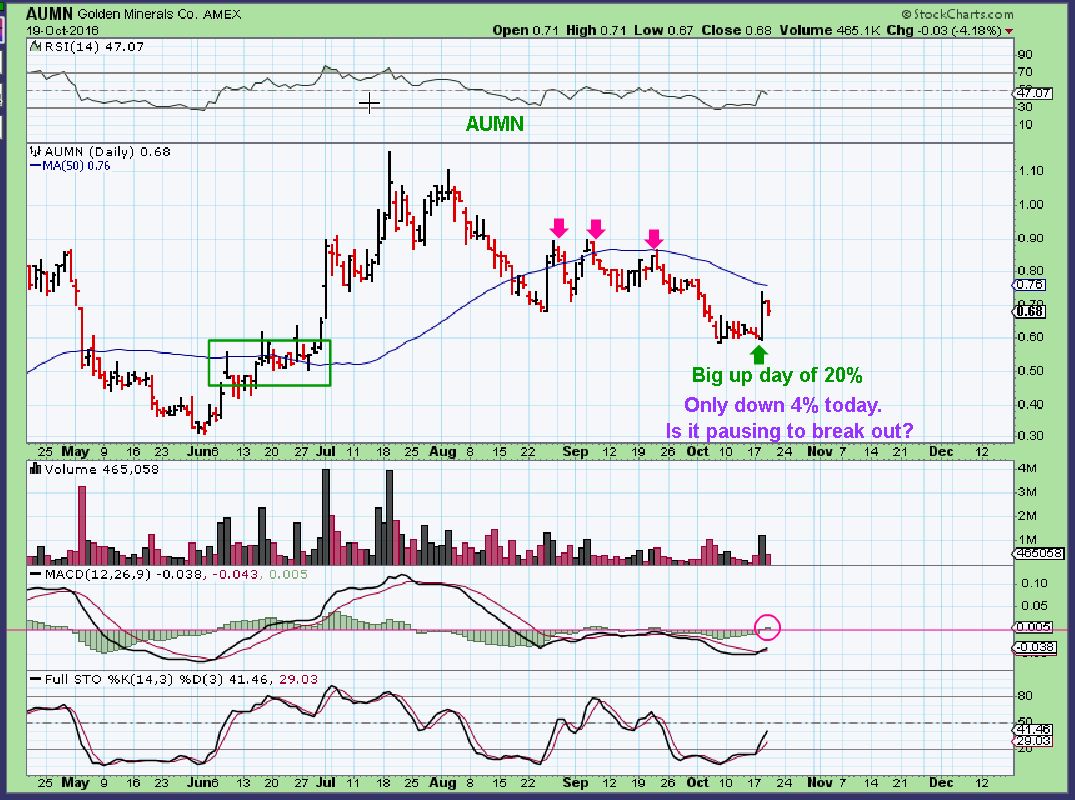
AUMN -I have been showing that while GOLD has been selling off quickly to new lows, AUMN has been riding the 200sma for weeks. This can be bought with a stop a little bit lower than the 200sma. Notice the potential risk / reward.
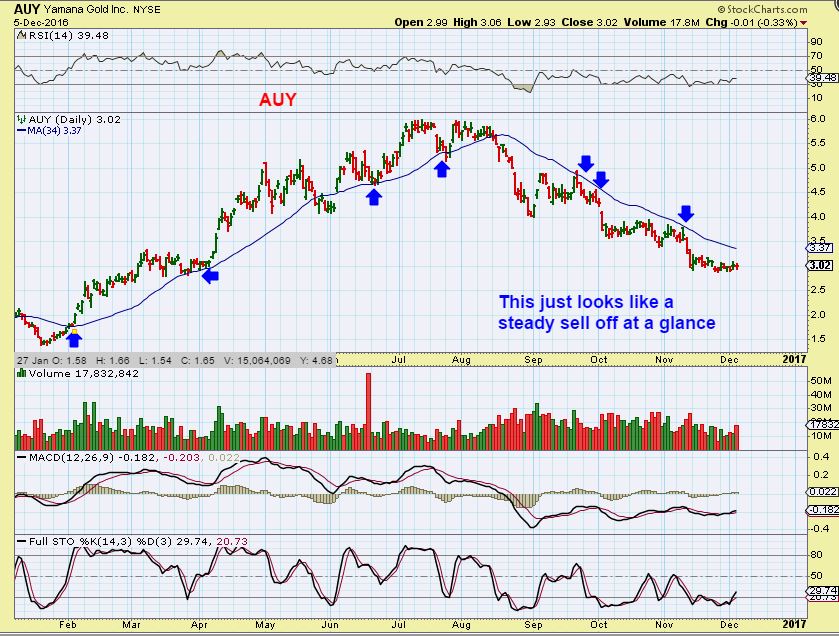
AUY – This just looks like a sell off, nothing more at a glance, however…
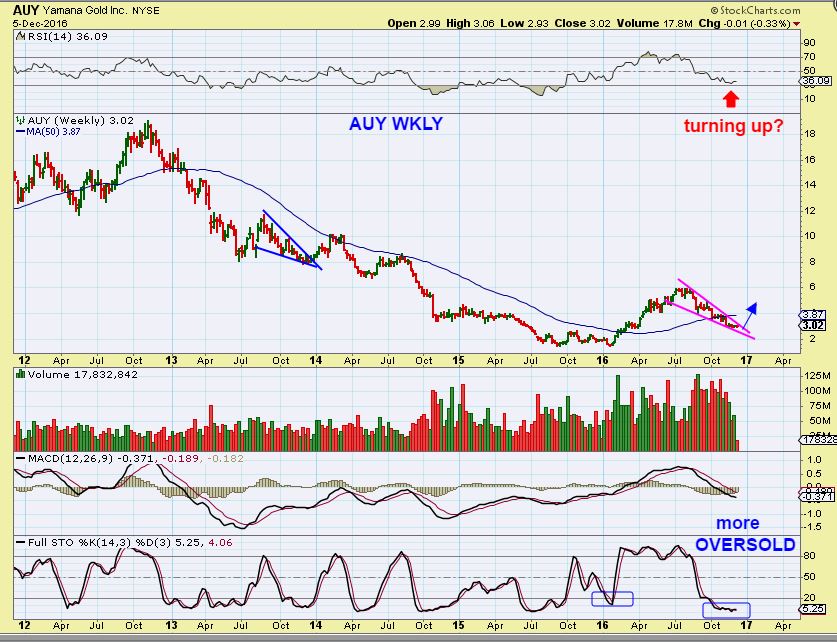
The Big Picture of AUY WKLY shows a bullish descending wedge pattern. It should be able to break out higher and run if this is an ICL coming up in Gold. The blue Wedge was in a bear market sell off an it still did well in a relief rally.
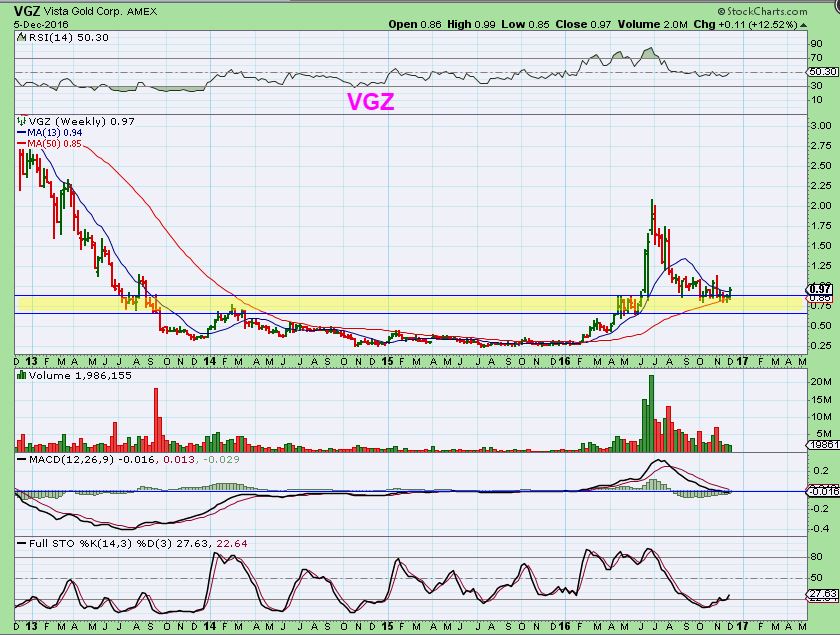
VGZ – VGZ popped Monday while Gold was still down quite a bit. Gold was at new lows and VGZ jumped 12% and moved above both the 200 & the 50 sma. Let’s look at the weekly chart also.
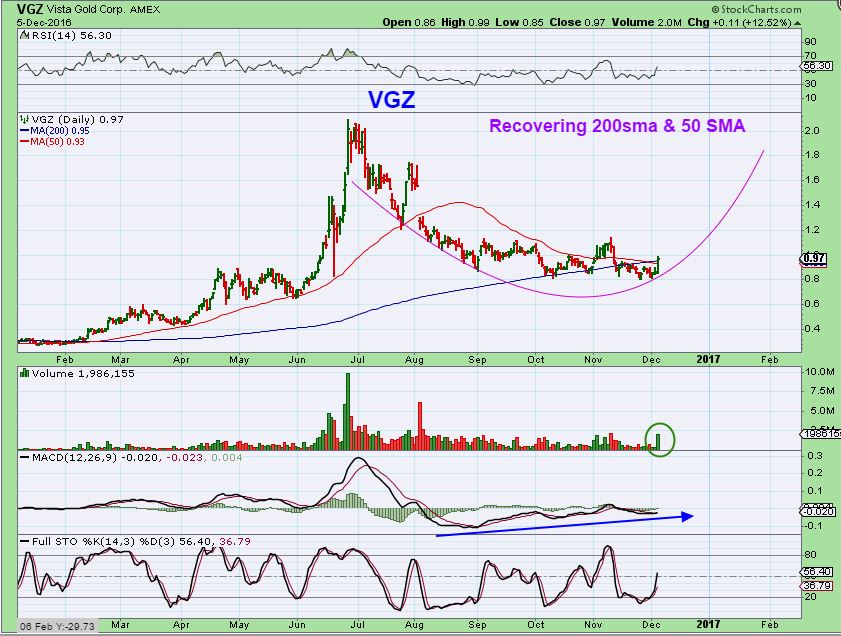
VGZ WEEKLY – We made very nice gains on VGZ last spring, some of us more than tripled our investment when it took off out of a base. It now looks to have back tested one of those support areas. A bit more than a 50% pull back.
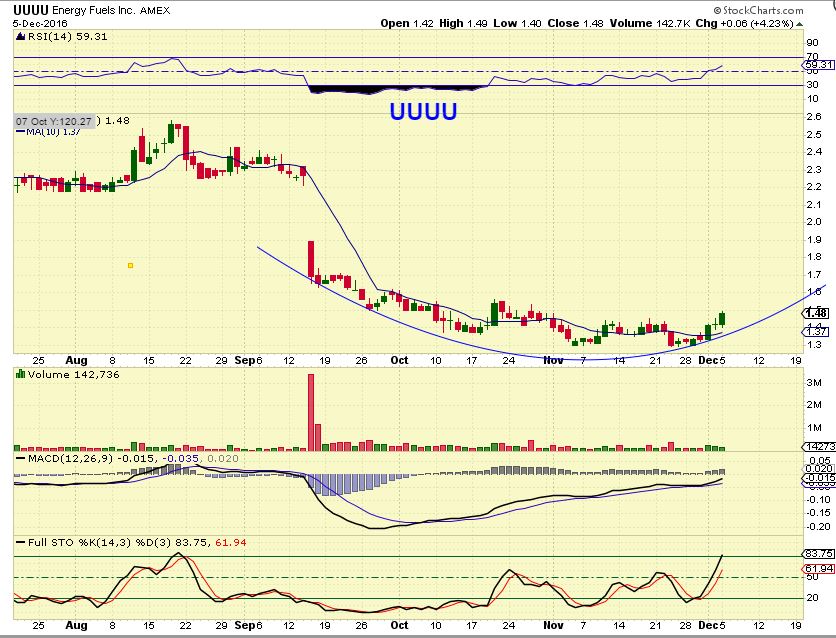
UUUU- This is a Uranium stock and I have been keeping an eye on URA ( etf) , UUUU, UEC, URZ, URRE, CCJ, etc. UUUU looks to be forming a healthy base, so I just wanted to point that out if any are interested in Uranium stocks. This could be bought in this area with a stop below $1.30 as a low risk entry.
Progress report:
.
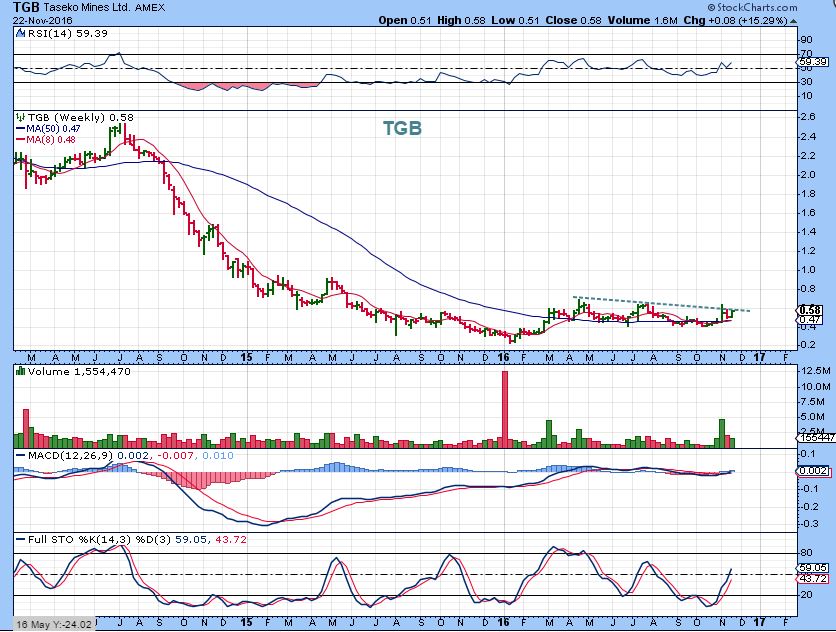
TGB CHART #1 _ I have pointed out TGB on NOV 22 when other Metals stocks were taking off. This was a lagger, but looked ready to break out then. I showed a Daily chart and this weekly chart with TGB at $0.51- $0.58 .
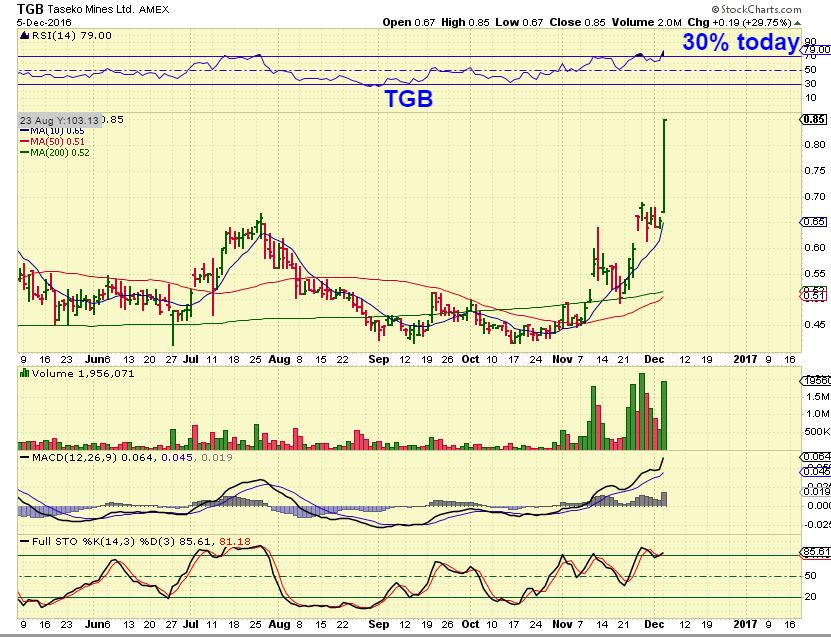
TGB – TGB had moved up over 20% since I posted it, and then Monday alone it surged another 30%! These stocks are buy candidates on a pull back.


Hi Alex- have you looked at IPI lately?
It’s funny that you ask. I hadn’t but one of our readers emailed me just last night about it.
It does look good riding the 10sma, but even better is the 3 year weekly chart.
That looks very good. The hard part is can one take a little draw down? It has moved from under $1 to $1.50. Big move, so a pullback could come, but this really looks like a good set up.
I’ll have to look into it and put it in tonights report. Do you want a chart today? I am working on another project , but I can throw one up if needed.
No that’s ok, just wondered if it looked promising to you. Sounds like it does. I took it off my watch list a while ago. That’s always when they start moving, lol!
Here is a weekly anyway. It looks good, but needs a bit more volume this week in my opinion, to break out with follow through. In time, it should break out with this bullish set up
https://uploads.disquscdn.com/images/f4d759200bda29edaae0ffd8218b019c92b431789d18271d3bf0b09a94dd29a7.jpg
Today the volume increase that I was asking for is coming in. Looks good
IPI up 11%. Please let us know when you take something off your watch list in the future. 🙂
Nice going.
Well Alex, its been a long few weeks, but to my eye, it looks like the corner has been turned (miners). NOW, how much upside to expect. Always tough.
Yes, if this is a YCL in a BULL RUN, I expect a nice solid run higher over then next few months. A turn to more of a bear market sell off would only give us a good bounce.
Looking on a 1 year weekly chart, this has been a long consolidation from the spring to the summer highs to now, and they can lead to explosive moves higher if their sectors remain bullish ( like CLF, FCX, AKS, X, and other long consolidations that made those stocks look like they were becoming lifeless).
Look at a 1 yr weekly of FCX – nice long consolidation leading to a nice run higher. lets hope that we have that in Miners.
Im not sure how long the daily cycle is for the USD? But if we are on day 20-21 then Id expect it to be right translated. Which may lead to a shorter upside for the miners. We need a few of those roman candles. 😉
Being R.T. means we’ll likely see a new high in the next daily cycle, but late in the IC, the next could be a left translated daily.
That would be a false break out and a long drop. We may have already started a false break out and after topping for bit, a longer drop. The currency markets have been tricky lately.
probe from Canada – prb is up 20 % – GOLD MINE STOCK
PROBF is the OTC version, and the chart is great, but I can’t trade it due to the low volume on that one.
Kind of a blah day so far. The problem in gold shares may be Buck up, Canada down. Also YCL down. We need someone to help us.
TRX – I had a chart for todays report, but I ended up with so many chart that I left a couple out – save them for when I write tonight.
Watch that 10sma on TRX. This looks explosive to me.
Also AUMN – 500,000 volume in the first hour? It wants to break out in my opinion
.
oh yes.. what he said…waiting verrrrrrry patiently in both myself….
please do explode… ;o)
I’m in both too.
im keepn an eye on this pattern too … it’s following along pretttttttty closely …
https://www.tradingview.com/x/wJ0V12hW/
thats what i was thinking when i said yesterday, that AUMN probably has a little joke up its sleeve.
oh. sorry-lol… didnt read all comments yest…was busy..
no.. i wasnt complaining 🙂
i didnt give it the technical treatment like you did
its lookn damn good now tho.. and nak and trx.. lol .. giddyup
yup.. i m friends with TRX again
GL2us
spoke too soon.. back to 0.45.
i hate you TRX LoL
u in GPL?? dang.. look at THAT pattern repeat… still watchn that unfold .. currently not holdin it
https://www.tradingview.com/x/TsBzkZ3G/
i am.. when are your superimposed candles from?
https://www.tradingview.com/x/B8qGm0cH/
but thennnn again… this one looks kinda sorta similar as well… i suppose we shall see….
https://www.tradingview.com/x/loKubijl/
thx M
$8 for GPL? Yes, please!
and nak.. man .. lookn gooood… ……. archin her back and reachin up
Alex: I have to ask: do you see any technical similarities between the set up that gave way between November and January of last year and this current move higher?
It is too early. As mentioned in prior reports, I have to watch and see how this unfolds.
Good enough.
One similarity is that Miners and Gold were not in sync back then either. They both did their own thing.
That is why Gold bottomed on Dec 3 and miners a month later.
The hard part about comparing the 2 time frames is that you’d be comparing a 3 year bear market sell off from 2012 to 2015 into a final low, to now.
That’s a good point. Yet, the one similar component both have in common is the looming interest rate rise. Unless I’m missing something, gold bottomed within days of that lone hike in 2015 although it took another month for the shares to bottom. But, gold did bottom. Also, the USD moved higher for a short period, again, days if I have that right and then declined ushering in this bull. If they raise rates again, I wonder whether an interest rate hike on the 17th may create a double top on the USDJPY? Or do you believe a raise in interest rates this time will be USD positive?
Gold bottomed before the interest rate hike in Dec 2015, and then it did a double bottom at the time the rate hike was final ( it was like a shake out, but didnt break the dec 3rd lows).
In the past , interest rate hikes were bullish for Gold.
Do you know what the date is in December for the interest rate announcement?
Dec 13-14
The FOMC meeting is for two days: December 13 & 14
The announcement is at 2pm on Dec. 14
Thank you for clearing that up, Alex.
Mark,
A lot of people are starting to talk about the possible interest rate hike and consequences. I’m going to discuss that in detail in the weekend report.
Terrific Alex. Such hard work you do! Thanks for all that and more.
My chart I think shows an under cut intraday low on gld around a day or so after the interest rate hike last December
Would last Dec rate hike and bottoming action then be comparible to this Dec though? I’ve been meaning to do that analysis bit haven’t found time to do it yet!
Alex- is the set up better if miners do hit a slight lower low before starting higher to reset the daily count? Seems we are dragging along many days since the low in miners but only a day from the low in gold.
They can reset on the next dcl
And GDX is back to red. Just no momentum or ignition here yet without the Yen bottom in place. Dollar/Yen up again today. BoJ not relenting. Testing everyone’s patience beyond belief no doubt. Is everything just waiting on the Fed next week?
I hope not but maybe? I really wanted a run up BEFORE Fed so we had room to initially drop in reaction without busting the lows!
GLD might be back-testing a short term bullish wedge on the daily chart. https://uploads.disquscdn.com/images/2c1158000677ad61ca11cb689d86f6953b61909bdbee251b076ea7275218f103.png
Noticing some PM stocks with the same pattern.
Fingers crossed.
Thanks Randy for your excellent chart.
What’s the bottom part of your chart? (Nov-Dec.)
Hey Geurt,
You can either click on his chart or at the bottom of the visible part of the chart should be a place that you can click on ” SEE MORE” if the whole chart doesn’t show.
Yes, If that is what we have here, these tight wedge patterns usually break higher ( Descending wedge / falling wedge) in a bullish manner.
Most silver stocks are pretty weak today. Someone probaby put a sell out on them. Probably means we are pretty much at the bottom.
Tried to post this earlier. Some of the break outs were pulling back.
10 SMA
,
https://uploads.disquscdn.com/images/839dce879d96171f09775c1991855b0178e43de7c3008169c92ecec60a373748.jpg
I assume that we should consider buying this on say an hourly turn up, especially if it turns close to the dashed line?
I’ve seen these bounce around and tag the magenta line in the past, and others I’ve seen ( Strong ones) just drop close to it , bouncing off of the 10sma, so it can be a ‘buy with a stop a bit below the break out’, but it can be a bumpy ride for a while.
Thanks.
magenta, blue green red …. so ‘colorful’ … actually, perhaps it’s ‘the season’ but they are looking mighty “Christmasy”
I took that NOG trade that I posted a few days ago.
It is working out O.K., but could pull back at resistance and present an opportunity to add to positions or take one,
It also may just break out & continue to move higher.
.
refresh
https://uploads.disquscdn.com/images/bd0b345cba49e3805547bc533b65f9afecb579e1c6847d44ec5d01cbd821355f.jpg
Especially nice on a down day for oil. Great call Alex. Now is we could only get back on the CWEI train, which left the station a long time ago.
That stock along with a few others, is etched in my memory forever.
Made great money on it, but it is still “The One that got away”.
I did the same thing with TASR years ago. Bought it above $5, sold almost as a double…and it just kept on going and going.
Just think about the ones that you sold at the top that then went down never to return. I can’t tell you how many I held too long. Much healthier to envision your successes. Boris Becker once replied to a question how he could hold his serve together on a match point when it had been so erratic prior. He replied, “I envision my successes.”
True true on that.
yea… the age old problem…. just set it and forget it? or ride the waves?
wish i had stats on that one…. but it sure SEEEEMS like it’s better to just set & forget … in this case – and a few choice in energy & miners…
GDX- Dropped lower, Landed on the 10 SMA, Now rising again.
#Typical
#StayFrosty
Watching the hourlies The Buck up (but may be turning down), Canada, YCL, GLD down. Seems like we need more help from these guys.
Locked and loaded. Gdx,Ag, OAS, Sgg, Xon. Let the games begin.
I hadn’t seen anyone mention the ECB meeting this week as a possible catalyst for gold. maybe they take a hard line to keep the euro from melting any lower and assist our cause : )
Miners need some serious senior leadership. ABX, NEM, AEM, GG not acting “great” and showing no signs of life. No disrespect to the AUMN’s of the world, but without some of the big names to boost the ETF’s, nothing is happening.
I’d like to see them all hold above the 10 sma, but it’s going to be close.
Maybe this can help us?
https://uploads.disquscdn.com/images/a92c706aa5ba0310aceda3c908f4e36074953e70f78762f01327f5720488e062.gif
Funny, I just looked at this chart again.
Gold just Topped in July and has sold off until now.
This one bottomed in July and ran up through year end.
We’re in trouble, Gold is doing the opposite : )
Here is one more up to date. This one also gives us hope into Feb. https://uploads.disquscdn.com/images/d28e081f4ccdee93cf86cd1587c0b34994e14e8121f70e815c8ad1bdada94d5d.png
Sure didn’t work in September though? But also notice Jan/Feb aren’t too bad either.
Alex, It looks like the PM bull went out to pasture or is chasing a heifer. Oil is what is floating me now. Any more great picks like NOG and WPX? BCEI came back from early losses today and PKD is neutral.
that is funny….. 😉
I actual was going to try and elicit your help while on the back of that sucker if you could just steer him into the chartfreak’s corral.
https://uploads.disquscdn.com/images/95eba8a624f6277495db8dc18aae8f7cfbea415425771385592a4bf78205774e.jpg
Too much! But, that’s a man Baby! You had me laugh out loud.
ok.. this is REALLLY me ..
https://uploads.disquscdn.com/images/21fe291a80a0c0e41c4231c9cd9ecb33f3081e1fd27307ad8eda5ee527eb04cb.jpg
ahhhh my beautiful Arab Dotsun……… some gorgeous horse flesh right there ..
he ‘ran like the wind’ … took my breath away …
#memories
when was that taken M.. 1940s?
teehee
hahaha… close … mmmm prob 1980ish?
Well, at least you’ve got a great picture to remember him, and obviously a treasure since it was so close.
Beautiful horse.
Maybe AREX & PGH
SN & Qep trying to break out on a 1 yr wkly , might not be ready yet
Thank you .
It’s a bit extended now so wouldn’t buy here, but OAS has been a beast since bottoming in Aug. Doubled up since then and you’re not messing with a Jr. that is daily trying to stave off bankruptcy.
Alex – Looking at a 3 year chart of oil – from about April til now looks like a big consolidation – what do you think the chances are of it breaking out above that $53 something area in this intermediate cycle?
It’s still a gorgeous inverse H&S. It has a good shot of doing so , barring any crazy supply overload reports or any of the OPEC players or Russia reneging on their deal.
c’mon AUMN push a little harder! (any vetinary-midwives in the house?.. AUMN trying to give birth to a baby bull)
GIDDYUP AUMN!!…. aftermarket (0.82) +14.5%
dayumm!.. now dropped back agin.
im giving these things the kiss-of-death today
Yeah, what did you do? I’m not seeing any AH action. Maybe 1 cent on the bid. Maybe your broker/chart gave you a bad candle real quick, who knows. Happened to me plenty before then it just goes away.
that 2nd last candle was Worden’s aftermarket.. it hit 0.82 (hour chart)
https://uploads.disquscdn.com/images/1ec84264f33e5cc0e748fb9a6b038f2c050d5027579f1ee3b1fdf153f6a3944c.jpg
Moo!!!
Logging off for a while.- G-Nite
GDX down to the 10sma on pretty light volume. I think this bounce in the USD is just a bounce for now.
We still have WED, THURS, FRI to mop up some profits, Let’s go Mr. Gold ( and Yen)! Wake up.
I was really hoping for a run up PRIOR to rate hike, but with 6 trading days left, by cycles it’s too late for gold to make a run and then get hit bad on 14th. Having trouble relegating that with miners cycles which had earlier low (thought no much has happened yet). Read conversation below with Mark, that hits some of the concerns, but definitely an area that needs more analysis, imo. I’ll look too but don’t have the answer yet!
Nat Gas! I took a look took his morning at all daily and intermediate lows from 2016 this AM. Based on time since ICL, we are due for a daily cycle top soon. Likely time to either hedge or take some off if long. Expect pullback any time now. But 2nd daily cycle could take a run at $4. Spring futures now in backwardation instead of contango like late summer/early fall. That is bullish for UNG and derivatives. Too late to post chart, sorry. Maybe later this week. Zzz….
For any that might be holding UWTI or DWTI – they are being delisted this Thursday – Investing.com has a good article about it – says that it’s possible Credit Suisse would be redeeming the notes for cash but the bank hasn’t yet stated that it will be doing so – I don’t understand it all so don’t take my word for anything – just wanted to give a heads up – I don’t own any –
I understand that they don’t have to redeem them and may not. So it’s probably wise to sell them before they are delisted.
Yes, that was what I gathered from the article – I assume maybe a lot of holders are unaware…it traded 20 million shares today and was only down 52 cents….I would have thought folks would be dumping them left and right…..maybe tomorrow they will….I would be if it were me….
Yeah I saw that about a month ago and have completely avoided both since then.