
Weekend report – See No Evil
This week has been another active week in the markets, lets see if all is good, shall we?
.
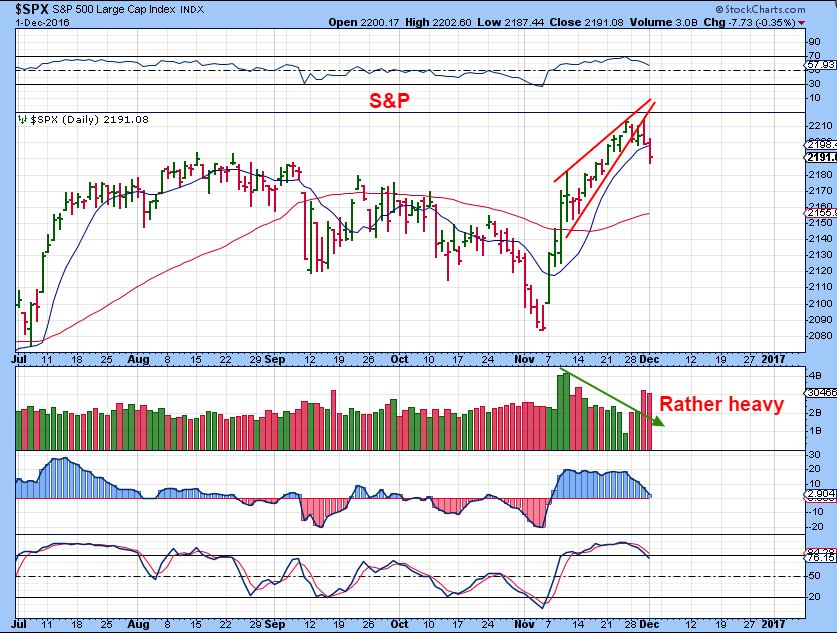
SPX DEC 1st – Expecting a dip to a 1/2 cycle low, this bearish rising wedge was pointed out and is now playing out. Could it drop to 2160?
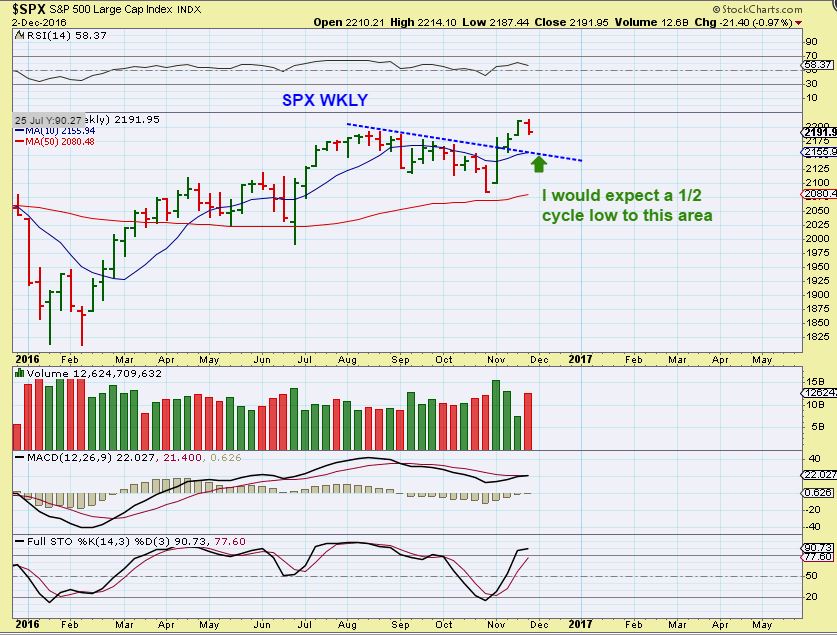
SPX WKLY – I think that it could.
Here is something to keep an eye on that looks a tad more bearish than the S&P …
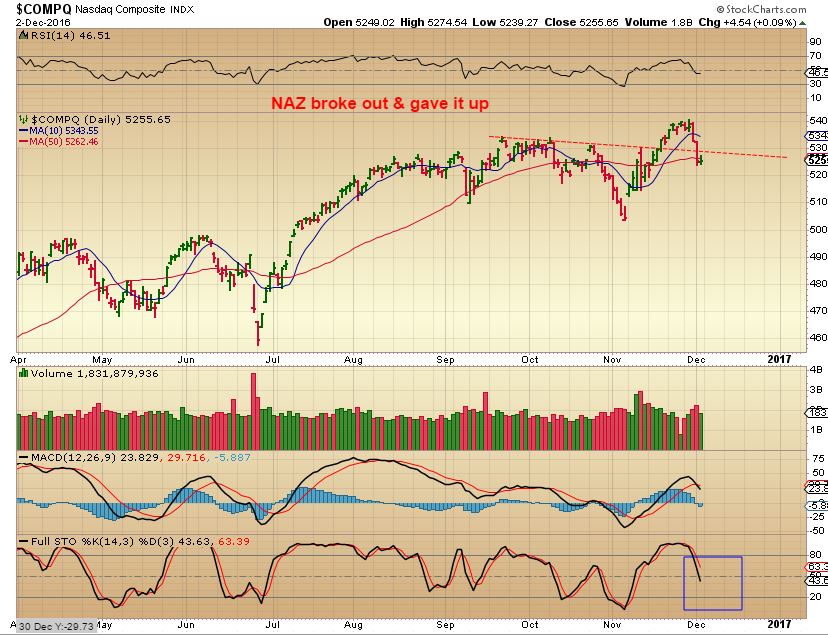
NASDAQ – The NASDAQ actually gave up its recent break out and dropped pretty quickly. It rolled over as they say.
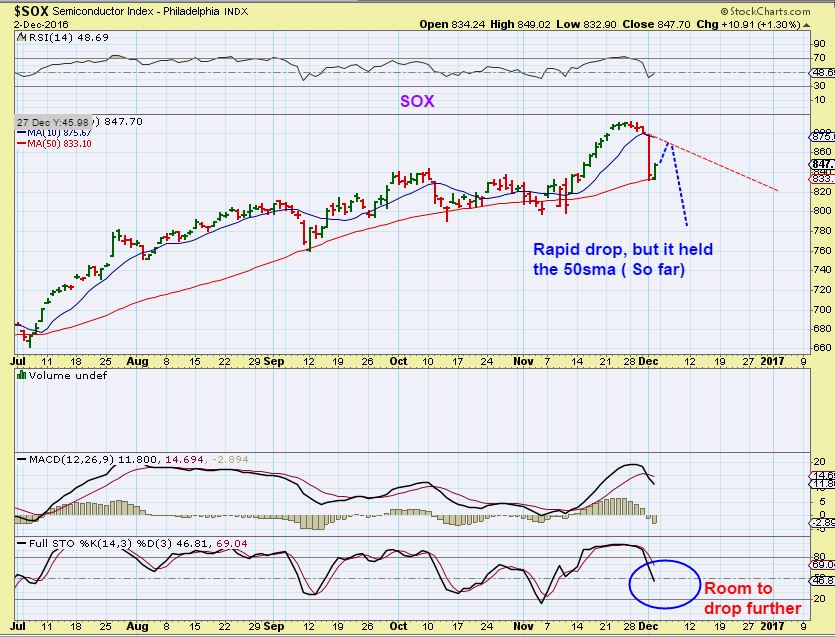
I had pointed out that the semi conductor index looked to be taking it especially hard. This was a serious looking drop, and it occurred in many f the semi stocks.
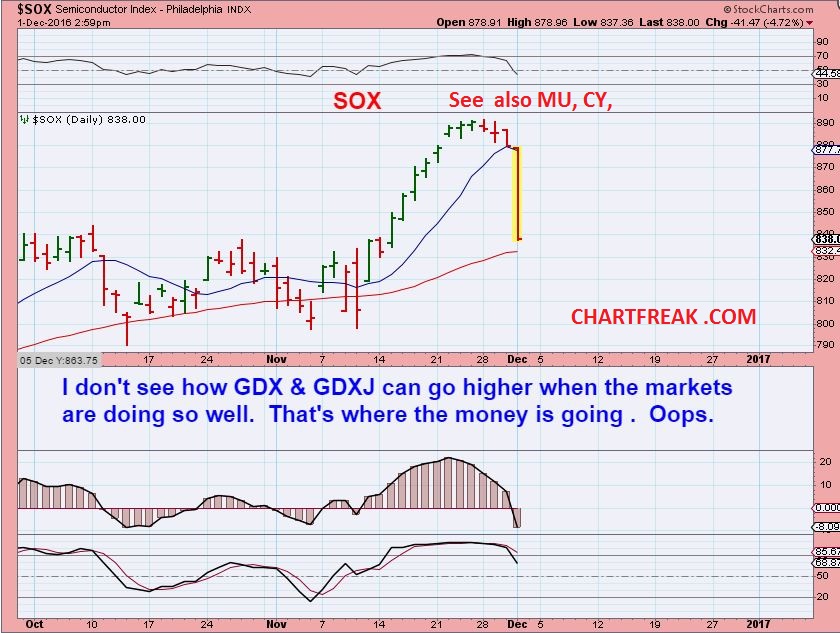
We now see that the SOX reversed at the 50sma, and that is encouraging for the bulls. The question still remains, will this market remain healthy or is this a Bull trap to suck the buyers back in?
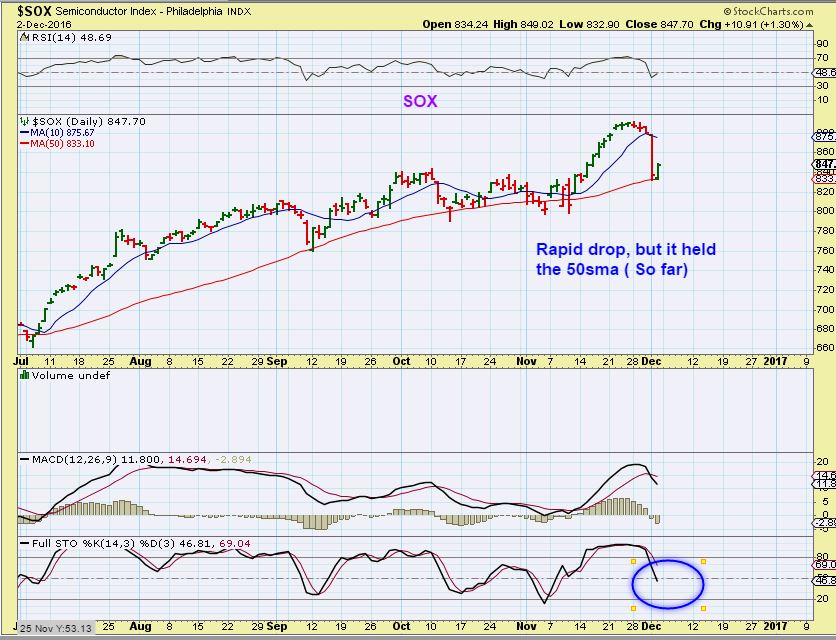
Could this be a bull trap bounce? So far, if it is to be viewed as a 1/2 cycle low, it could be bought with a stop under the 50sma. The drop was so sharp, however, that stops must be honored in case this starts selling off again.
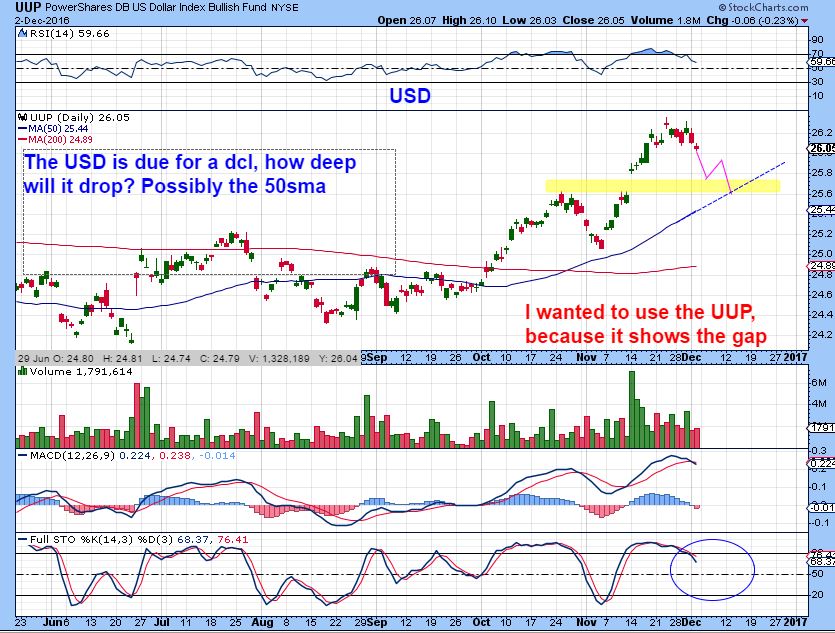
USD – The USD is due for a DCL. Using the chart of the UUP, you can see a gap and the 50sma is quite a bit lower, so this is an area that the USD could drop to. The stochastics is overbought.
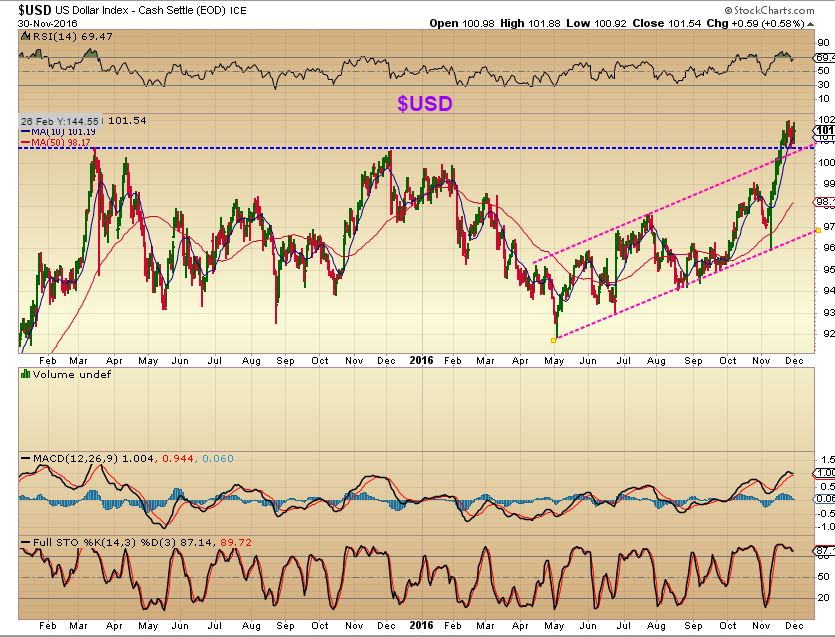
USD NOV 30 – above 101 stays on top of this blue & Magenta support line. The USD is currently at 100.66, and that is still at support as far as I’m concerned. A deeper drop could begin a new chapter.
 .
.
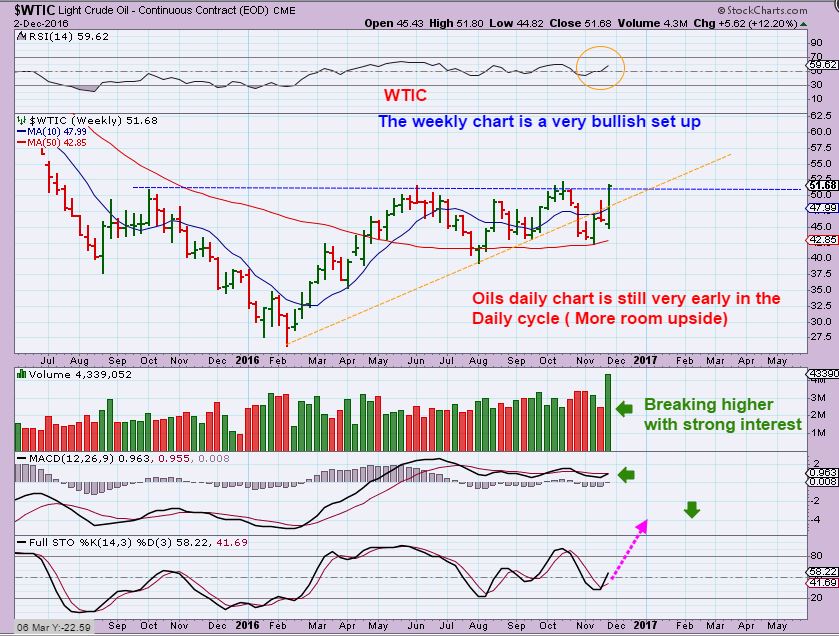
WTIC WEEKLY – This chart looks very bullish at this point. Oil is pushing for a break out with Big volume, it recovered its break down, and is early in the daily cycle. Plenty of room upside i the weekly stochastics too.
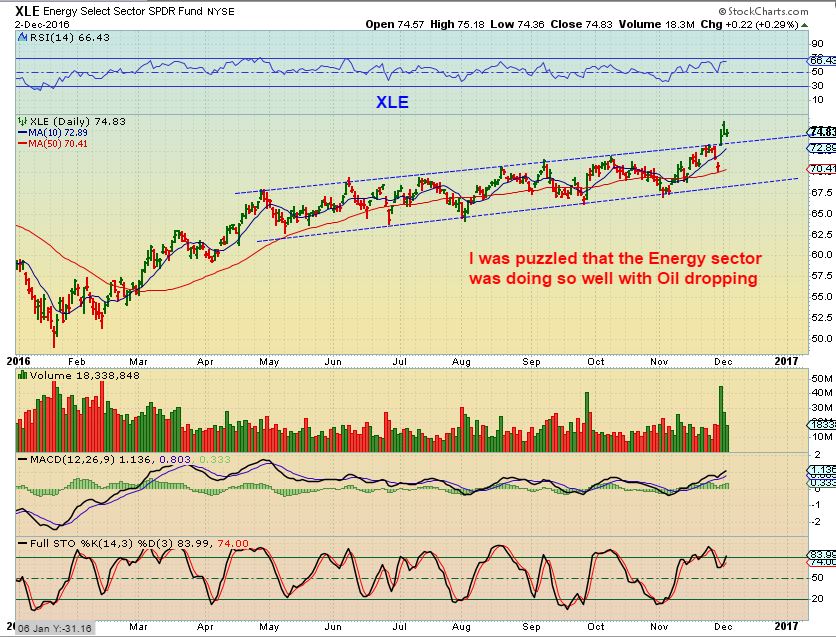
** I had been pointing out that I was puzzled that as Oil broke down below the trend line of the Intermediate Cycle on Oct 31, many energy stocks like OAS, AREX, WPX, etc were still setting up bullishly. I even showed that the XLE was bullish while on various days , while Oil looked to be breaking down. That was odd.
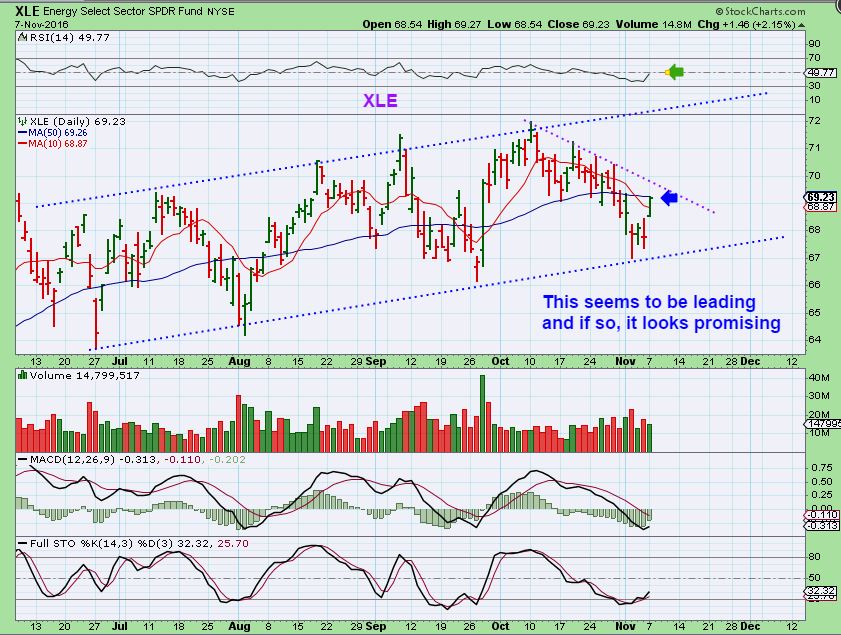
The XLE has broken above its multi month up-channel. This could take on a steeper trajectory after a possible back test or bull flag here. Energy stocks could out perform.
.
So lets discuss something else at this point, lets add Steel and Copper to the mix.
.
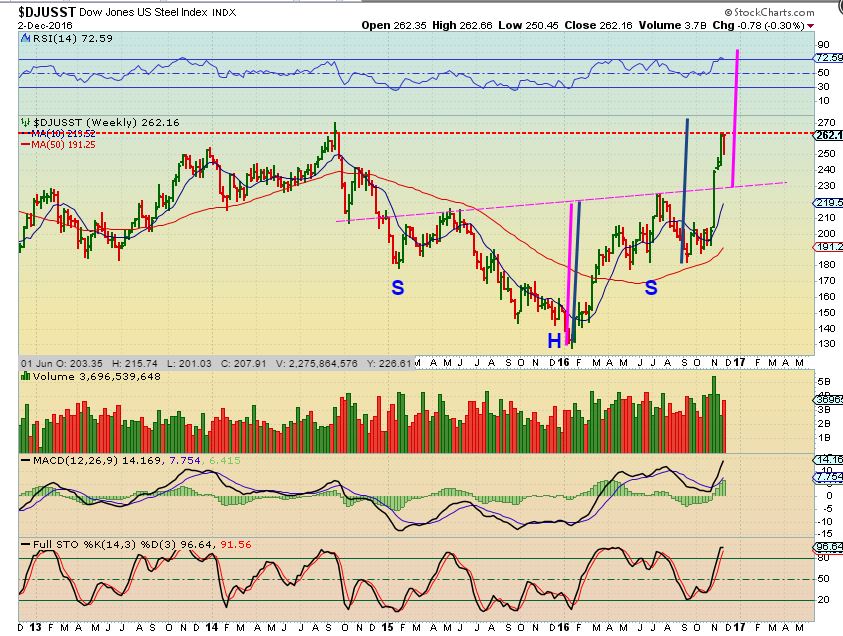
STEEL – I had pointed out in September that Steel was shaping up after bouncing right off of the 200sma. This was Bullish.
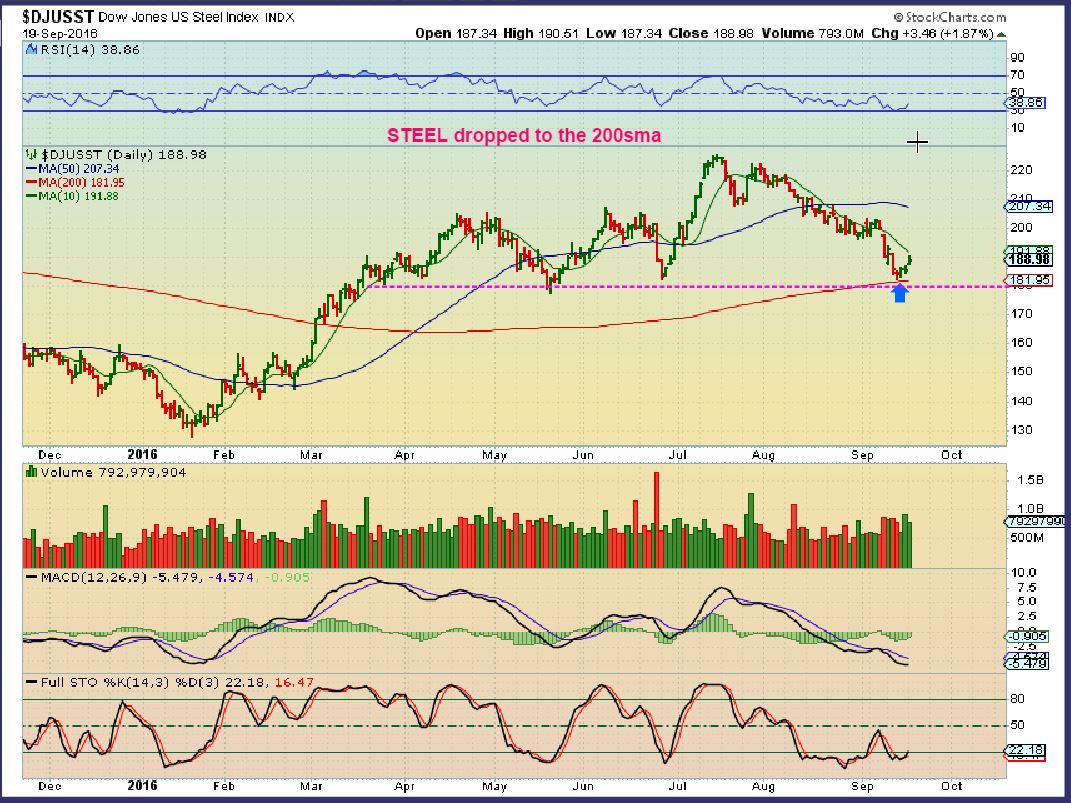
STEEL absolutely took off when Trump was elected. His ideas of rebuilding infrastructure and helping the economy has juiced the metals again ( Steel, Copper, Aluminum, etc). Last week was explosive, with Steel breaking to new highs. We caught these metals companies in the spring using X , AKS, CLF, SID, STLD, AA, FCX, CENX, HBM, VALE, ETC ETC, and then they went into about a 6-7 month consolidation. This is now another area of interest again.
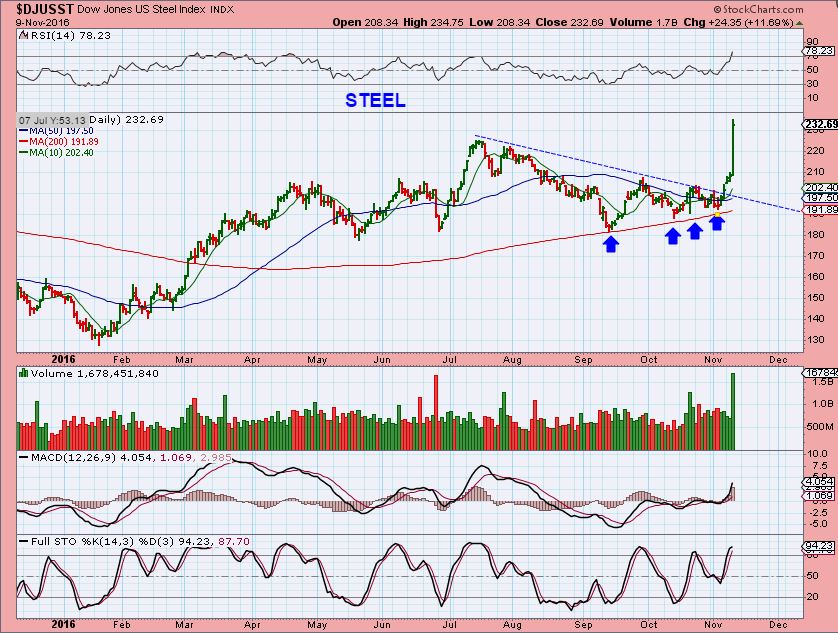
And Inverse H&S target is almost met (conservative blue) and has further to go with a stronger measured target (Magenta).
A look at COPPER
.
Pre Election : Copper was trading around $2.10 on the week before the election, and I was pointing out that it was now breaking out at $2.20. I didn’t think that it would absolutely bust out, just that it was bullish.
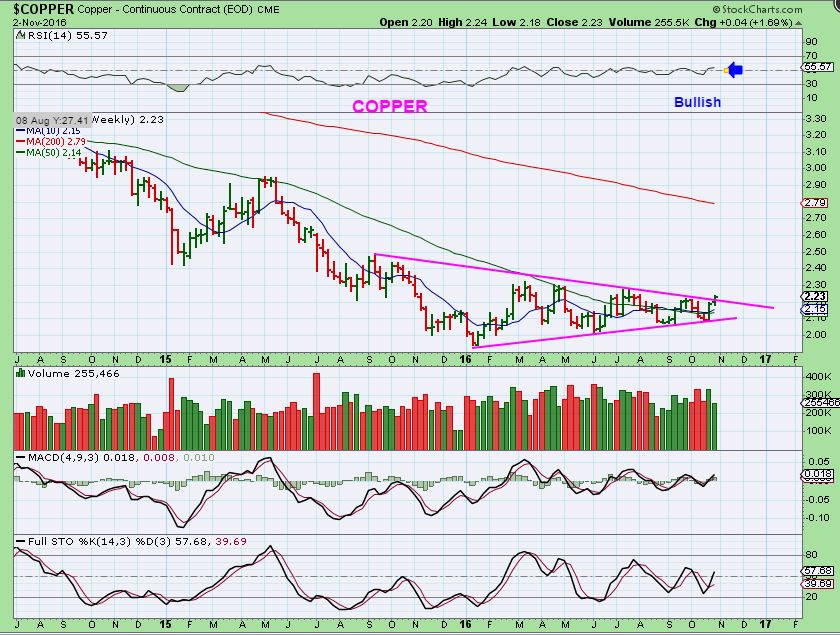
POST ELECTION: Copper hit $2.75 this week! Boom after the election! This is a major break out foretelling much higher prices. Copper is bullish.
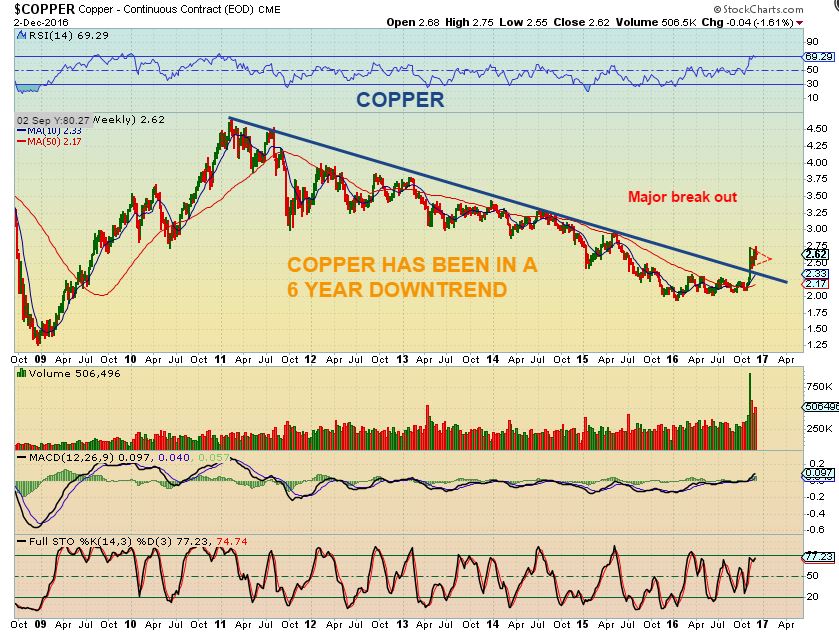
So let me mention this. I see Copper move from $2 to $2.75 and predicting much higher prices. We saw Steel take off like a moon shot and now steel prices are quickly on the rise. Is this a sign of inflation going forward? Isn’t that Bullish for Gold? Usually inflation is very bullish for Gold. I have to wonder if Big Money is dropping Gold price to ugly levels to load up as others sell everything they can. When the selling stops and the shorts are forced to cover, will could see GOLD & MINERS Shoot up the way Copper and Steel just did, along with their stocks. Time will tell.
.
GOLD & MINERS
.
There is not much more that I can say here about what we are looking for in the near term. I will just point it out here briefly again, and then I will discuss a few other things. Good, bad, and Ugly.
.
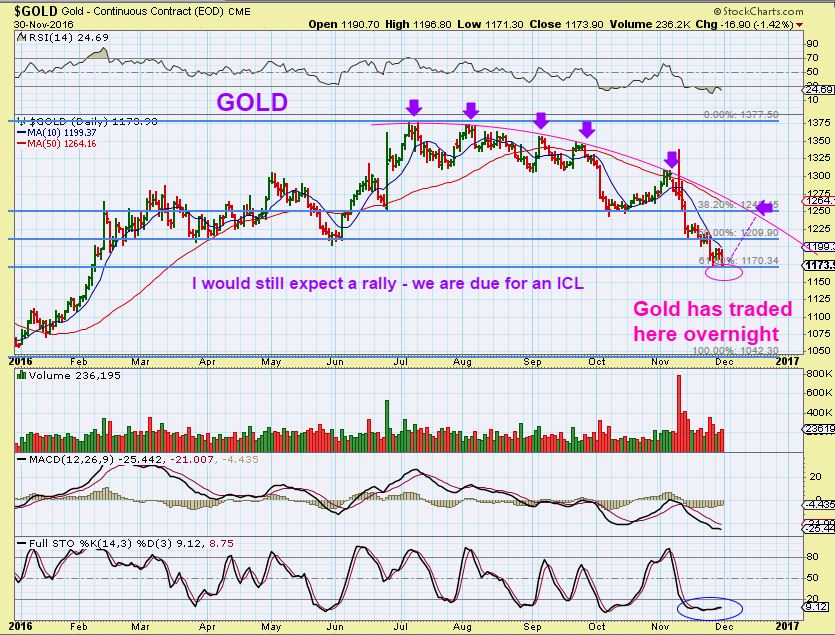
GOLD – I posted this to show the 61.8% retrace was hit, I’m expecting a rally soon, even bear markets have rallies out of the ICL. Then we will monitor that rally as it unfolds. See the chart for a minor target.
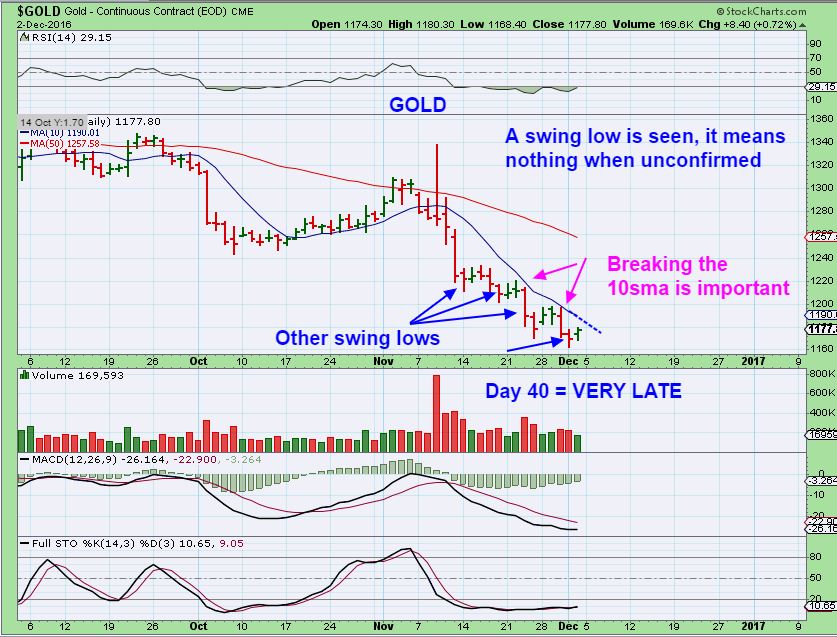
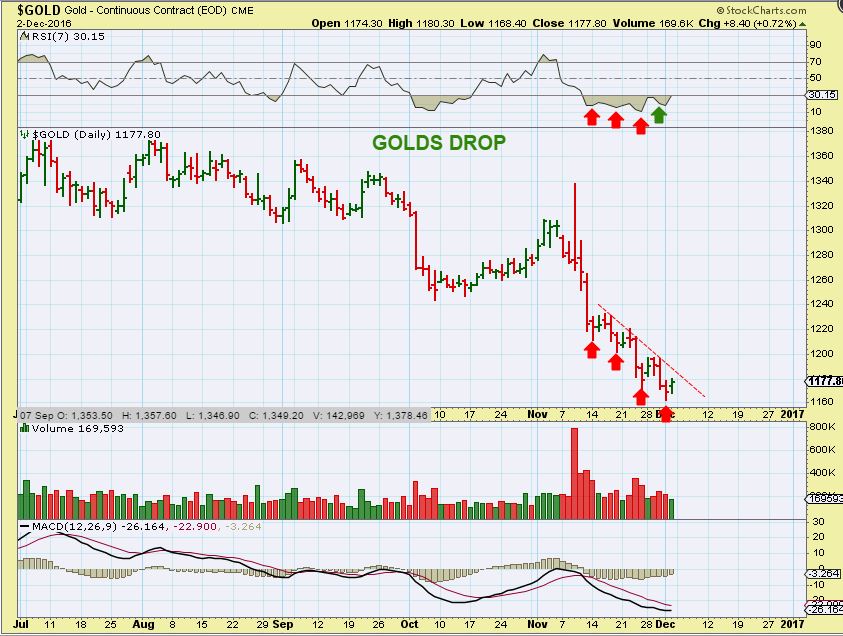
GOLD – Thursday was day 38 with a new low, so Friday would be day 39 and we are very due for an ICL. This should also be a yearly cycle low. If we prove to still be in a Bull Market, gains out of this low could be huge over time.
GOLD FRIDAY – We see a swing low (Unconfirmed), so this could be day 1, or day 39. Monday would be day 40.
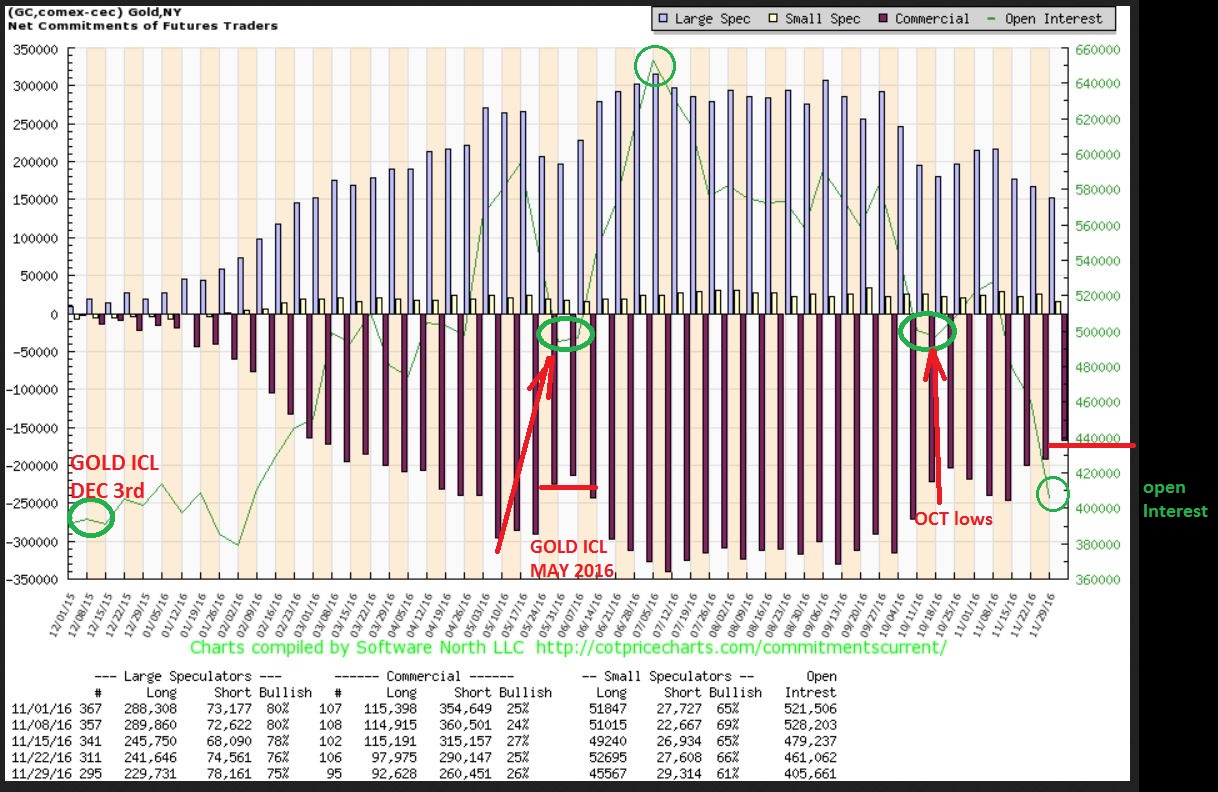
The C.O.T. has a very encouraging Open Interest reading. This is very bullish, but I don’t use C.O.T. readings for “timing’ of lows.
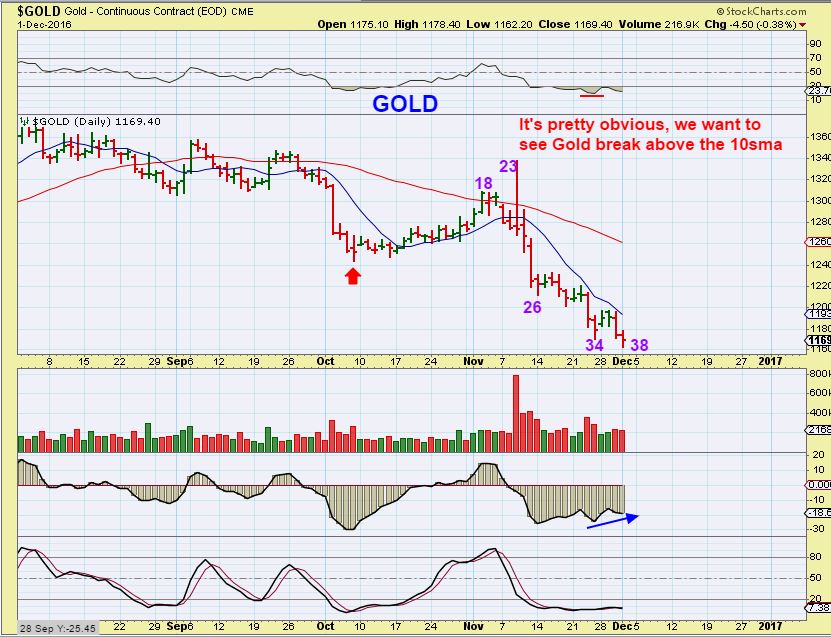
GOLD – We see the RSI 7 here showing divergence at the recent new lows, for the first time. This is Bullish for Gold. We want to see follow though above the 10sma to add confirmation of our new swing low.
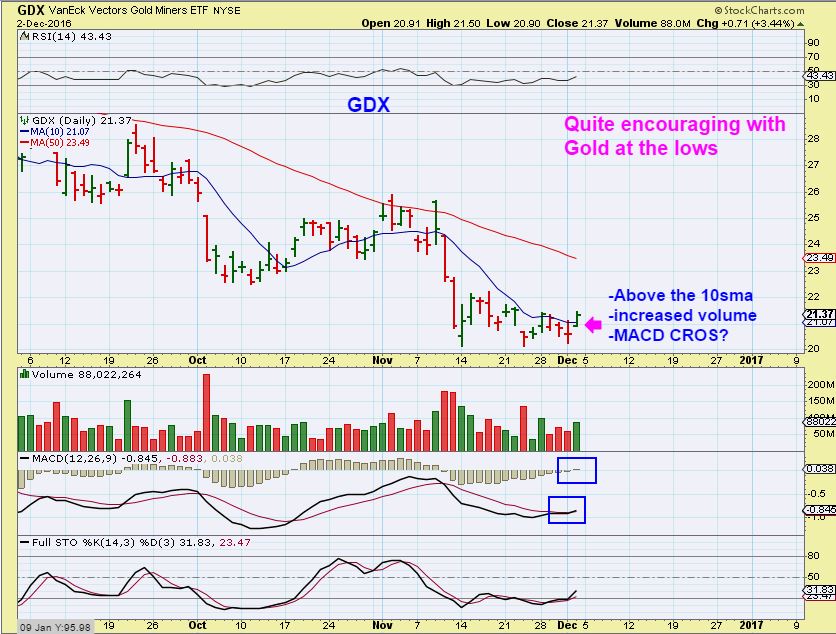
GDX – The GDX did close above the 10sma , this is a positive note for a swing being in place. GDX is still very oversold and the MACD is crossing higher. This is a buy signal for Miners and they have room to run.
.
Time for the good, then bad, and the ugly
.
I found something interesting, and It looks both Good and Bad, so I will simply point it out and leave it as another area that we have to allow time to reveal the true meaning. Expecting an ICL, we have plenty of time to watch this.
I keep going back using various indicators and settings to compare our current situation (in what seems to be a renewed bull Market in Gold) with the former Bull & Bear markets in Gold. So, just using a standard Bollinger band setting on the Gold Weekly I noticed this…
.
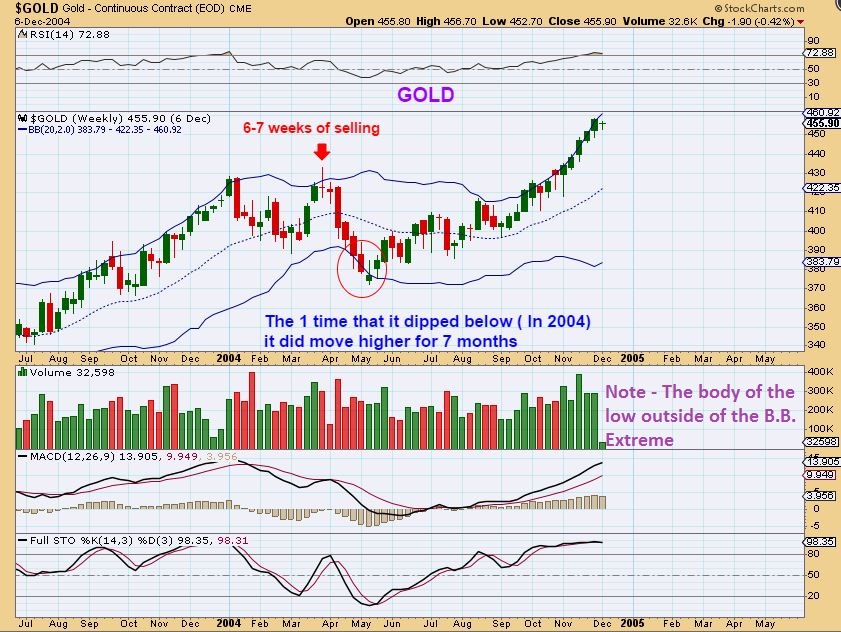
GOLD – On the weekly chart Gold pretty much avoided the lower B.B. throughout the whole run from 2000 to 2008. YES, it dropped below it for a tiny bit in 2004, and I will discuss that later. This is a strong run when it only broke the lower B.B. once. Please see the chart.
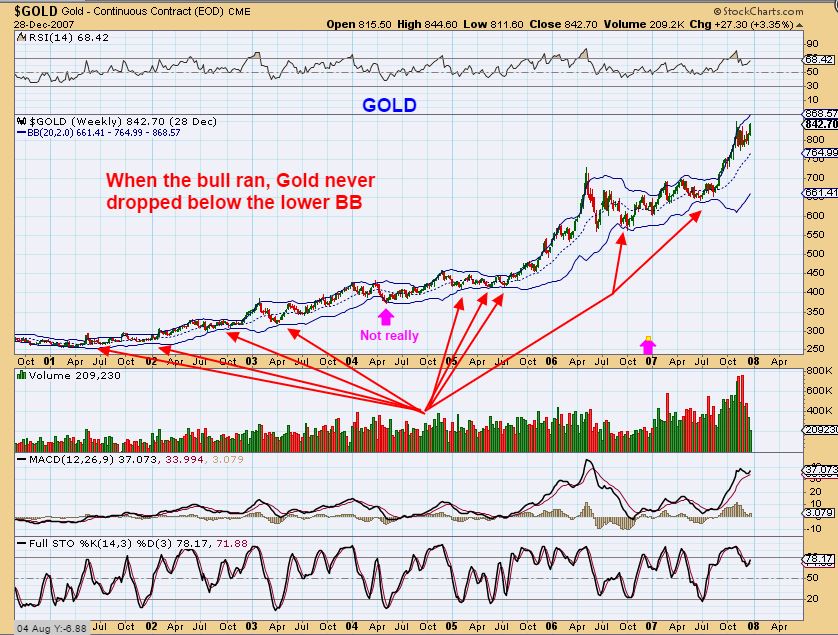
GOLD– We know that 2008 was a big crash, and Gold dipped below the B.B. a few times. Once it recovered, Gold barely touched that lower B.B. 1 time. Please see the chart. In 2012 as the market topped, a B.B. break can be seen.

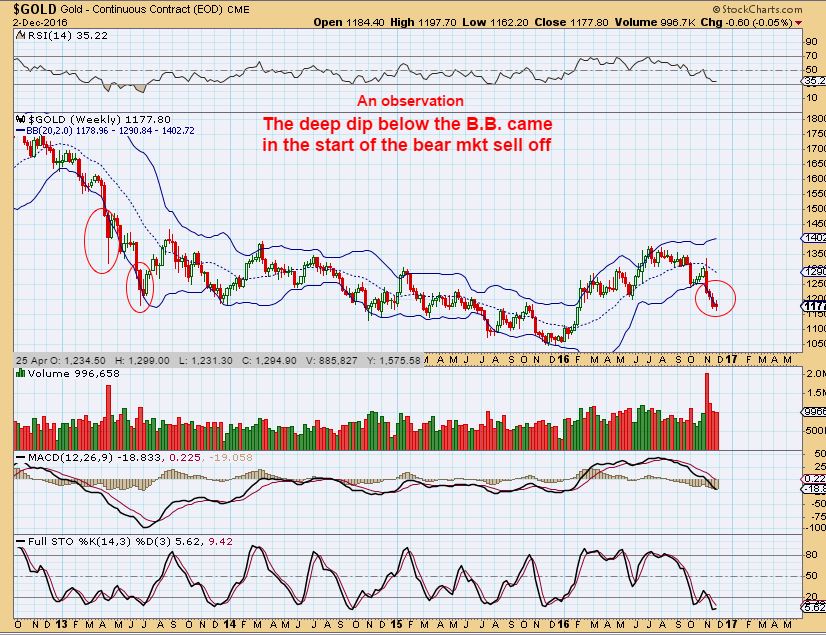
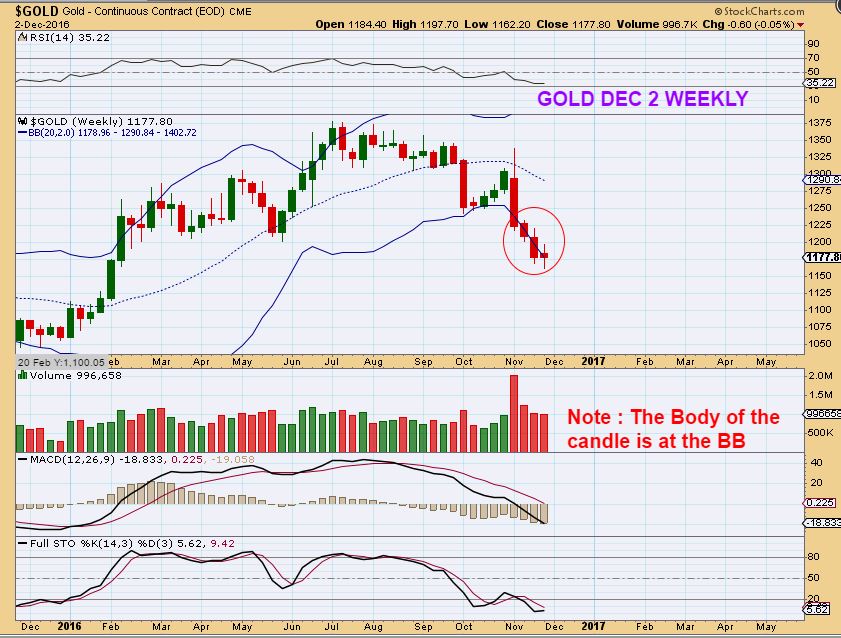
Taking a look at our current Bull run, the B.B. on the weekly chart of Gold has been broken. This is kind of concerning to me, and that is 1 more reason that I want to watch this coming out of the ICL. In our Bull markets, this was hardly touched. During our Bear market sell off , the lower B.B. was broken repeatedly. Is this going to start happening here? Is there any good news to offset this ugly looking chart?
.
I zoomed in on our current weekly chart with the B.B. break for 2 reasons.
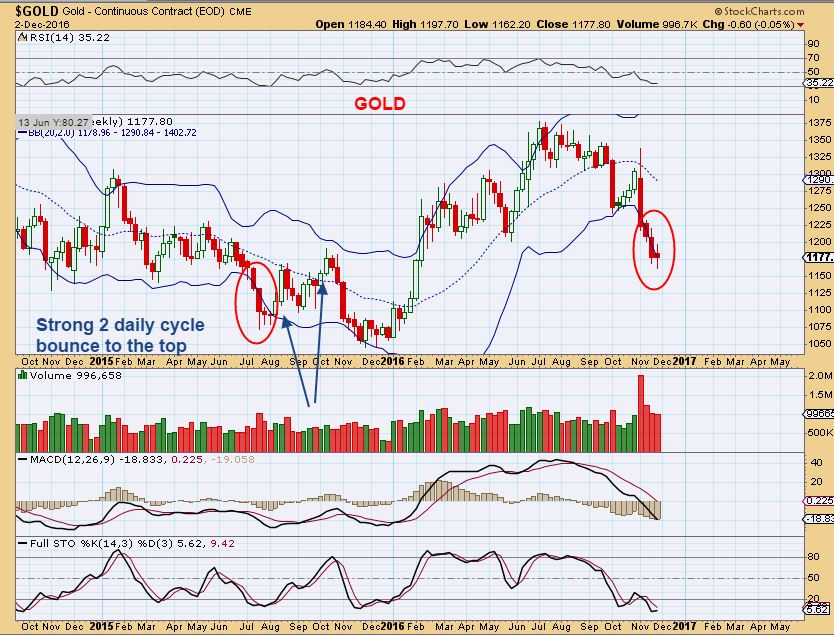
1. I’m showing that even in the bear market, a break of the B.B. in 2015 rallied for weeks and almost tagged the top of the B.B. too. So I am expecting an ICL, a Rally in 2 daily cycles, this gives me time to see how things look at that point. I’m pointing out that this should still be a very trade-able low.
2. Now I want to take a look at that 1 time that the B.B. was broken in a steep sell off within the bull market. Do you remember that I pointed out a break one time in 2004? It rallied for over 1/2 a year after that break. This is at least a point that we can look at and say, “It did happen during the bull market.” And look at this…
This chart looks a little like the above chart at the B.B. – A little doji candle and hopefully higher next week. We are overdue in many ways for a low, and the miners may be saying that we are on our way. The charts are somewhat similar.
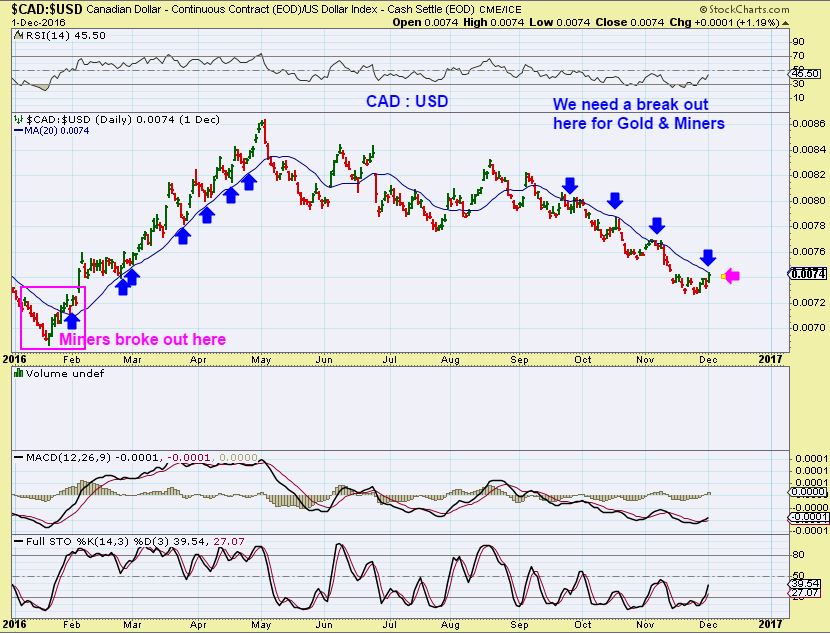
The chart of the $CAD VS $USD was used by me at the 2016 lows. Notice that when this broke out above the 20ma, Miners broke out in Jan 2016 (see the chart), it then climbed up that 20ma as support. Then notice the struggle currently, but we look like we could break out this week. Bullish for Miners.
.
How about 1 more chart of good news before we go?
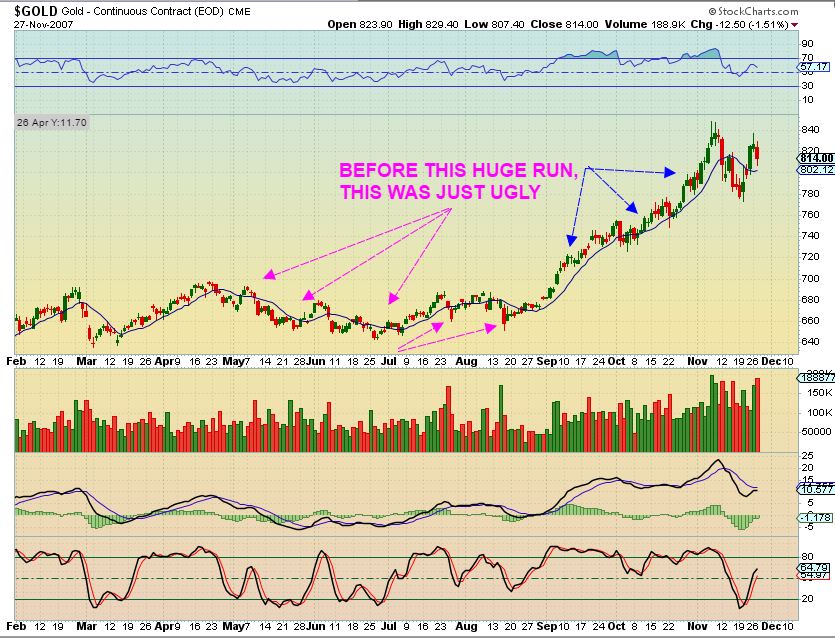
This has been a rough and tough Sell off to try to ride over the past few weeks. Well take a look at this bumpy ride in 2007. We repeatedly saw ( blue arrows) a drop, a bounce, then another drop to new lows, then a bounce, followed by another drop to new lows, etc. Tiring! Ugly! Frustrating! Brutal! Each time new lows were produced, I’m sure that you can picture the screaming, the fear, and the loathing.Who wants to buy with all of this choppy action into July & August?
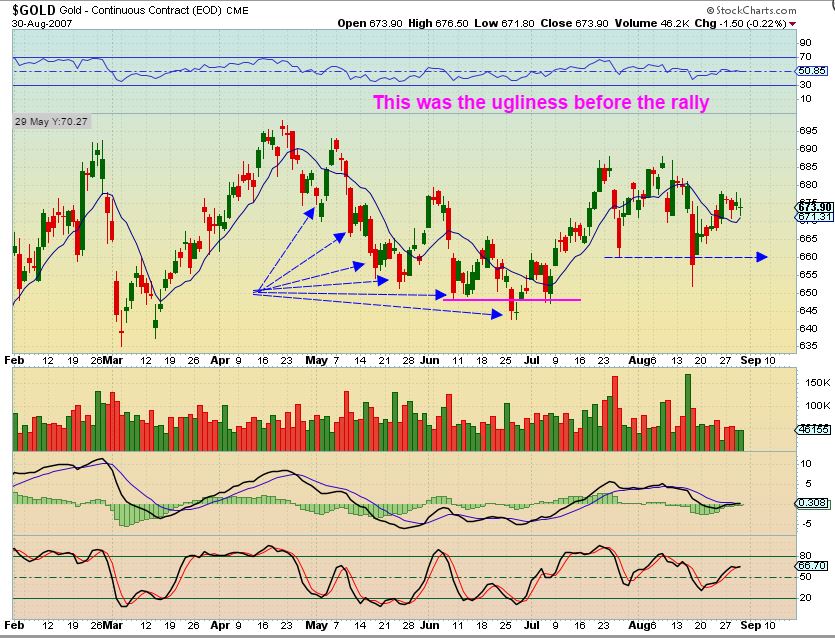
2007 – In hindsight, it never looks so bad, once that rally kicks in. The Bull ‘consolidations’ and ‘sell offs into ICLs’ always buck off riders at the lows. They always change sentiment from bullish to doubtful. People HATE miners at the lows. When everyone is afraid to hold on or get back on, they get left behind. Look at the rally that followed from July to November.
.
So I am expecting an ICL in Gold ( A deep tradeable low that should hold for at least 2 months without being broken) . Looking at Steel and Copper, I am hoping for that type of reaction higher, but we’ll have to let Mr. Gold tell us what will happen. Miners look like they may be leading the way, because not only do we finally see a close above the 10sma, but we see several individual Miners not even breaking their Oct lows, and now moving higher. If Gold sells off Sunday after the vote in Italy, I think that the downside is limited. If Gold takes off higher Sunday night after the vote, we are probably looking at our ICL last Thursday. The Miners are ignoring Gold more and more, I think that the lows and some good %-Gains are right ahead. Enjoy the rest of your weekend!
.
~ALEX
.
I do not have time to proof read and fix typos that may have been left behind, please excuse any that you find 🙂
.
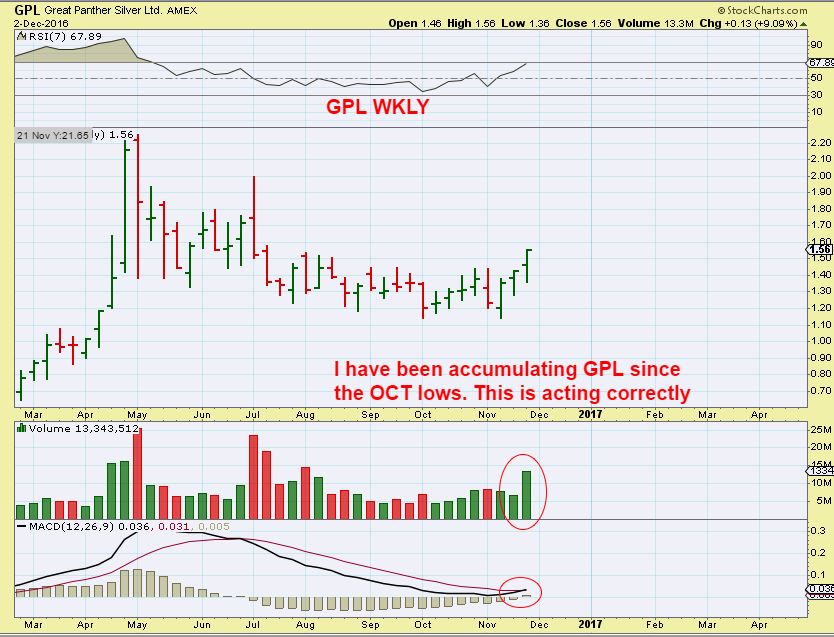
Take Note: GPL, AG, SA, GORO, SAND, KGC, etc etc daily charts look like they are starting to move.
.
GPL WKLY – I have been pushing this one for weeks. Now the weekly chart is really looking bullish. It closed at the highs last week and the week before, with Silver getting sold off.
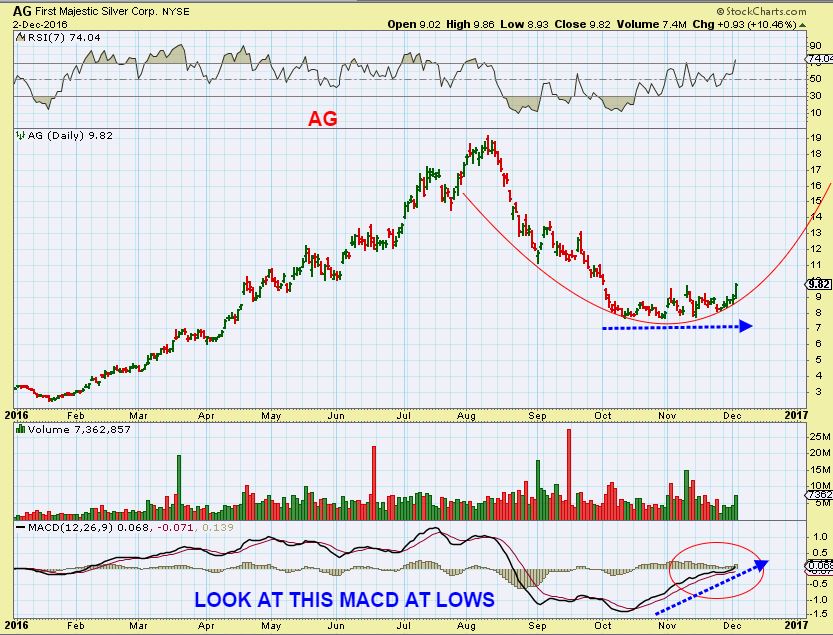
AG WKLY – $2 to $19? Wow. When it was at $19, people really wished they bought it below $10. It has now run up from under $8 to almost $10 – while Silver got slammed.
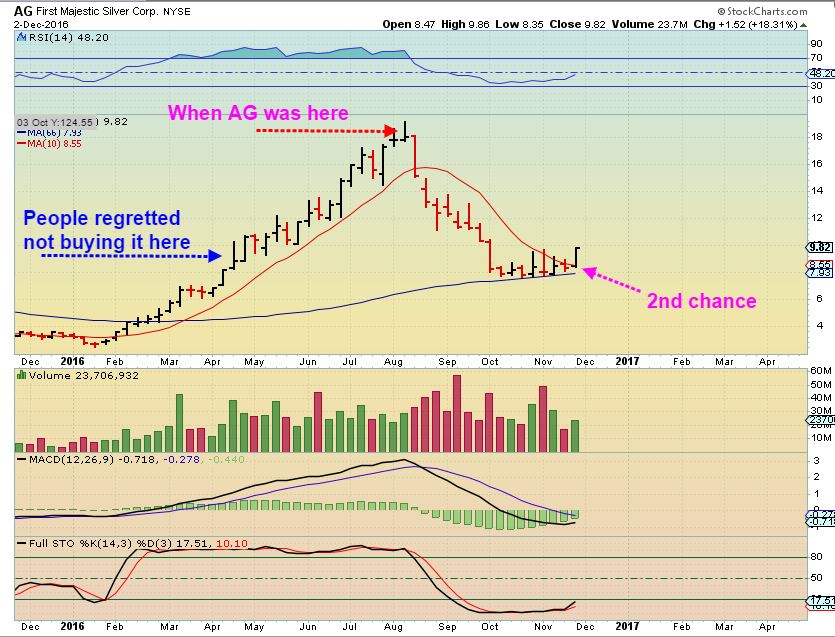
AG DAILY – What a beautiful chart, really. I can picture an inverse H&S forming in the coming weeks, and then a run to back to the highs if this bull remains in tact.


Alex, thanks for the great report! Hoping we’re getting near the end of the roller coaster ride. Enjoy the weekend!
You’re not alone on that one Deshy, I used to love roller coasters 🙂
Have a good weekend too!
Great report!
Thx H50
Aloha! 🙂
Nice to see you here, H50!
Thank You. Nice to see you too.
Thanks again and again for your observations ,illustrations and most of all your well balanced thinking.
My ‘optimism’ leads me to compare relative gdxj strength through the lower cup formation in pog eoy’15 into january.
My sentimental thing. But I’m looking to place a bet at the YCL. 🙂
Thx Beek!
I seriously just want a solid YCL in place a nice moon shot to follow, so we can just watch the markets climb higher
and occasionally check in. Pretty tiring the last few weeks , thats for sure.
At day 40? we are there or VERY close, and the Miners do look to be leaning more on the ‘ready to go ‘ side.
Enjoy your weekend, we’ll see what next week serves us 🙂
CF, thanks for getting the weekend report out early! So much information to mull over:)
I’m thinking of adding to my core in CKG.V (Chesapeake Gold) on Monday. CKG’s chart looks similar to AG’s doesn’t it? I’m already holding AG as a core:)
Also, GFI looks good; beaten back down to almost what it had started the year at. I’m considering that one as well with a stop near the recent lows.
Can you take a look at both charts? Thanks:)
Hi Kathleen,
I do see some similarities of AG and CKG.V, the difference would be that AG went sideways a lot longer and is now breaking higher with a strong MACD slant higher. CKG.V still looks like a decent chart, once Gold gets going it may do well. The volume was a tad light Friday, but that can change.
I also see what you are saying about GFI, I think it needs a bit more of a sign of strength, a break out higher above the 10sma, before I’d consider it. It gave up all of its 2016 gains – that’s a bit disappointing.
Take a look at the GFI 3 yr weekly chart, it has been a pretty steady sell off, so it should bounce, but really looks like a weak chart at this point.
Keeping an eye on the Italian referendum vote today – looks like it might be likely to be “no” – I’m thinking that will push markets down….not sure about gold …maybe up due to uncertainty..? or down if EURO falls and dollar rises…?…but then again…who really knows these days! Banks could be affected….thought about getting FAZ last week to short the banks but I’ve been mostly sitting out waiting to see how things go…….
Watching the same. : )
I kind have think the dollar will rise. No Bueno gold : (
Yeah, that was my thought on Friday so I didn’t get any gold stocks…I sold all couple weeks back or whenever it was and have been on the sidelines since…..have been waiting til the Italian vote is known and maybe even FOMC before jumping back in….unless we get confirmation on cycle…the last FOMC rate rise gold had an initial reaction down but then recovered the next day…..figured maybe I can catch the initial reaction..maybe…assuming it’s the same….assuming there is a rate rise…..ha! Lots of assumptions!
I sold a little on Friday, but now thinking not enough! The euro looks vulnerable here. Let’s hope they sell euro buy gold : ) Either way, if dollar rallies Janet will be forced to hold on rates or sink the ship. Trying to weaken the dollar will help gold, but that’s another week away still.
Hm, that’s true….IF she holds on rates then that’s even better for gold….so I might have to keep that in mind as I sit on the sidelines and decide whether to get back in before FOMC so I’ll be positioned….but USD/JPY is also moving so that could counteract the fall in the EURO and end up with the dollar not moving much in either direction…which could mean there might still be a rate rise…..ha! Need a crystal ball…..
Best case scenario is a bid to the dollar/ euro weakness, but no sell off in gold. Then we know gold has bottomed and when the dollar tops it will be a strong move : )
Ya, let’s hope for that!
I have been and continue thinking that the euro will get bailed by the fed at all costs. Even if the cost is a “failed $usd” Even if EU disbands in ‘principle’ The euro must go on… $25+ trillion generational bond debt in 2 years, for sures..
Just ask yourself what you’d make every effort to do from the top looking down?
Hey Beek! Yes, that is something to consider…..hm….how would the Fed go about bailing out the euro? Like, what steps could they take?
The Italian referendum will definitely have consequences for the USD, but what will it be? A no vote could be perceived euro positive because it potentially means Italy, a weak link may eventually exit. Or is it negative Euro because they are still on board and essentially more damaged than ever dragging it further lower? All depends on how far out money is looking and what the final outcomes is, although it looks like a ‘no’ on exit polls.
I did buy just a few shares of SRTY on Friday to short the market in case of an initial down reaction in market Monday morning….I usually don’t short but figured since market is looking bearish anyway and then this vote…why not…..:) 🙂
I am short the market, but the Russell might get a boost on the stronger dollar and Trumps new tariff plan. : (
So maybe I should have sqqq or spxu or sdow……
I have TZA, SOXS and SQQQ and JNUG. I like to hold mostly cash so I leverage in smaller positions but I am thinking right now,(but most likely erroneously) that TZA is most likely my worst position. But I was short going into the election and I though I would make a killing on the Trump win and that vanished almost entirely by the time the market opened!
Well, if it’s any comfort that’s what most of us thought I think…that the market would fall and gold go up….but we didn’t expect it to happen during the night and then disappear before market open!
Looks like the no vote is going to win. Initial pop on gold and silver. Let’s see how it does the rest of the night.
Yeah….I’ll wish I’d bought JNUG by in the morning…maybe……:)
So much for that pop. Waiting for late night to see if there is any reaction.
GARY (glmus) tried to post tonight, but was unable to. He emailed and asked if I would post in his behalf,
so this is a post from GARY.
.
” Thanks for the motivation you provided me with your CAD:USD relative
strength graph. I have used relative strength in the past and like it.
Using TC2000 I just plotted relative strengths with 2 period emas to try
to catch turns sooner. Only this time, I plotted 4 relative strength
charts of selected stocks vs. GDX, GLD, DUST, and UUP(US dollar). In
this way, I can see any gold stock relative to each of these four. Next,
I was able to add these to my watchlist for both daily and weekly using
checks, thus giving me 8 columns where I can see at a glance if a given
stock is relatively stronger than the four symbols above. This is a
great way for me to tell if I want to buy a certain stock as well as how
golds are doing in general. Happily, they look good with all of the
ones you recommended above having 8 checks in the columns. It also
points out the current weakness in two stocks I have held too long, TGD
and TRX. In silvers, all look great, but SLW is currently weaker than
GDX both daily and weekly. Maybe folks that use TC2000 will find this
especially helpful. Gary Musser (glmus) “
That is too cool! Thanks Gary
I feel the pain with TGD….
Hi Mike ..I agree. I had TGD stops that triggered in Oct. I do however have hope for TGD. As soon as Alex gives a green light on $Gold-I will look to reposition.
This is the one chart that makes me nervous about gold miners. https://uploads.disquscdn.com/images/d13080466d4c8f303e7ce972eaede2269ab2847ab0115fe4e1624140349afc20.png
Alex, really really hoping your dec 2nd report holds water (or should I say GC). Losing patience with all the things going on in the world and it still manages to find ways to test the bottom…again! ugh! Not trading around this but afraid stops will get hit and not willing to keep moving them in hopes I avoid getting snatched. If I do, so be it! GL all!
To me, this is typical bottoming action. You get V-Bottoms occasionally, but Whenever we are bottoming into an ICL and it just keeps bouncing toward the lows, I see frustration & loathing often. People get impatient, they watch each daily move ( I do that too – you really want that $30+ day higher in Gold, but it never seems to come) , and it frustrates everyone into thinking that this is not a bottom.
look back at last Dec into January ( refresh for a chart) – the pay off was SO GOOD from January through April, but that Bottom in Dec caused most to get so frustrated that they wouldn’t enter until March. Miners actually broke to a new low one week and really caused people to throw in the towel and walk away. I was getting emails in March saying , ” I didnt trust that bottom and when it took off without me, I couldn’t pull the trigger. Will we get a pull back soon? How do I get in?”
By then many Miners had doubled.
We are due for a bottom ( Overdue) . I’ll wait another 5 days if I have to , if there is a chance that my miners will double by next spring. This should be the ICL, this should be the YCL. That should produce at least a multi week rally or bounce after the lows are in. Then I have to watch things from there and see how it plays out ( Is our Bull still in tact or bear mkt action). 🙂
https://uploads.disquscdn.com/images/ab6b38ed6532c8e852b565dba6927d2fb9c42162e5fe4fa1218ea45ab7e121a6.jpg
Good morning, Alex –
Would Cycle Theory allow for the intermediate (& yearly) cycle in both gold & miners to finally bottom somewhere around the Dec. 14 FOMC meeting ? I think that would be day 47 for gold and day 20 for GDX?
We’ve seen day 45 in the past
Thanks, Alex, and also for your reply to Deshy below. I’m trying to be aware of all the possibilities. The Dec. ’15 – Jan. ’16 bottom stretched out as you point out. And the run from then into August lasted longer than almost everyone thought possible. So I’m trying to be patent through what seems to be a bottoming process. As an aside, I had no leverage back then and it was a breeze – now that I have some leverage, it’s an eternity /;^)
Agree – the good thing so far is that Miners are showing more strength
The bad thing is that last Jan , Miners are the one that dipped to new lows briefly, and then took off like a rocket. I just dont want to see that shake out move again. It really does shake people out and the ‘logical’ thinker is on the sidelines trying to figure out all of the reasons why, what news event caused it, what has changed….they often cannot find 1 reason to get back in….until months later.
I know you’re well aware of the the Yen’s role in the PMs. Now we have a strong move higher in the Euro which correlates with a weaker USD giving a boost to almost all assets. The exception are the PMs because (I think) they are taking their cue from then Yen which is not moving higher but still moving lower. Unless and until the either that correlation breaks or the yen moves higher can we really move up in earnest?
This morning when I woke up, the Yen was shooting higher. It then rolled over, but it looks like gold, not breaking last weeks lows. Maybe bottoming.
I appreciate your insight and resolve.
Take a look at the Euro chart. ( Attached, refresh) Click on it to to enlarge it
No hope in the world, and after the vote it kind of crashed.
It has now dropped, put in a strong looking reversal and the Dollar is dropping.
Yen may turn next
https://uploads.disquscdn.com/images/1c5134380736b95b9a814269207bc058363c3e40bc95cfe2631388428175d65a.jpg
I need to see the YEN & GOLD do this next
I assume you expect the yen bottom to coincide with the gold bottom we hope within the next 5 days or so? Gold has made a new low as you pointed out but the shares have resisted for what the 6th time since November 14th? Actually, I’m hoping for a blow out the stops on GDX and GDXJ similar to what happened in January although I don’t know what that does with the cycle counts.
If you use the OHCL charts ( not candlestick) it looks like GDX just closed a gap open from 2 days ago, and then reversed . The Miners do look better than the metals.
Yen & Gold bottoming relatively at the same time. I’ve researched both at prior ICLs and they do not bottom on the day necessarily.
Yes, I noticed that gap on Friday and thought now we will have to fill that gap which we did.
Given this relentless move lower in the yen one has to wonder whether we are in for a “V” bottom since we already built out a long base in gold for over two years and all of a year for the yen before the break out in January.
Silver looks better than gold and platinum looks better than silver…
Thats encouraging- platinum used to lead, and has been a real under performer in 2016
patience is a virtue
Let’s hope it is a wealth tip. I think my patience will be inversely related to the $US. If that goes up (now currently down 1.00) my patience will wear a little thin because gold will further plummet.
Gold new lows ( Again)
The dang Yen. Relentless selling — likely by the Bank of Japan. Really need that to bottom for gold to find its footing. Lots and lots of bullish commentary and research this morning on stocks. Still “feels” like its time for a reversal in gold/bonds higher as stocks take a breather. So oversold on almost all timeframes. I agree with your post and comment below. This is the YCL shaping up in gold.
Deutsche Bank Pays 60 Million to settle Gold Manipulation lawsuit …. Sigh…. I guarantee they Made much more that that otherwise it would Not be worth the risk.
We are playing in “THERE” (6 other BB’s) Playground where they control when and how much…..
The BOJ needs to cozy up to the FED, like the ECB and have them prop up the Yen like they have the Euro this morning. On a positive note BCEI is off to the races this morning , while SM and SN are at resistance.
edward, do you follow BCEI closely? it is one i have been in for awhile, i know they just made a progress payment on the borrowing base deficiency on 11-30-16 and received NYSE non compliance notice on 11-28-16. other than the oil price rebound i am wondering if there is something else positive happening for them, perhaps on the asset sale front? trying to close above the 1.42 high from 9-8-16 today.
No I don’t follow them much but in reading their business synopsis I saw that they were heavy in Natural gas. My thinking is that ng is only going to go up because of the shut down over the past 1 1/2 years of all the small oil producers which had ng as actually a waste product. Yesterday with it up 30% I sold all of it at the close and rebought it at 10:00 AM. This is a rare instance where I looked smart!!
I was waterfowl hunting in Saskatchewan in late October and thelittle town I stayed in had 7 oil trains a day pass through last year and they were now down to 2 a week. I still noticed some “flaring ” their natural gas excesses from the wells though.
Seeing a reversal in bonds (via TLT) today. Low of 118.45, now 119.77. Considering they have traded in lock step too – Perhaps a good sign…..
Sorry – TLT and GLD have been trading in lock step…
Also hourly hammer on GLD. Hourly buy on TLT and SLV, not GLD nor YCL (see below for comment).
My account loss today has been cut in half and I have many hourly prebuys and some hourly buys. Good vibes.
I also see a hammer on the Yen. I see that it bottomed shortly after 10 a.m. eastern, and has rallied higher since then ( 5 minute chart).
I see a nice hammer on GLD.
We are due ( over due ) for lows
Chart of CDE looks pretty good.
Agree Mark,
With the USD down and Gold is down also today…..not correlating well imo.
I am tracking Bonds as to leading Metals…….Bonds correlating much better and again maybe leading !!
Bonds are the problem. The issue I am having conceptually with gold (besides losing money) is it lagging and subservient. At no point since US Election has it traded on its own merit. Only in the shadow of bonds primarily and currencies 2nd (mostly dollar and Yen). That troubles me some.
TGB – These 2 Charts ( refresh) were posted as ready to break out – Laggers behind FCX, HBM, Metals stocks .
Up about 28% since posting. Up 12% today. Looking very good.
https://uploads.disquscdn.com/images/80e846c00e41cddaa23571ce53cf39d562ced71598610fae82f44c2096fdd306.jpg https://uploads.disquscdn.com/images/40aa376ed419ec243e75646781f1cc390ae9183f127f71c7c7260a43072c0b15.jpg
Alex, Any price target on TGB (?0.90)? Thx!!
AUMN is like a Zen master thru all this PM volatility.
I’m hoping that when Gold takes off upside, it does too. It has given me plenty of time to accumulate it ( And GPL)
its certainly looks to be coiling for a big move..
what chances of a fakedown shakeout, before a rocket higher?
you just know its still got summat up its sleeve 🙂
Nice moves in AKS, ZEUS, X etc – working nicely with the 10sma and,..
Here comes GDX – Good volume in 5 minute charts
X opened at new 52-week highs. Still have 1/2 position. Sold half CLF Friday to lock in profits since this has been so frothy. Holding other 1/2 as long as above 13SMA.
aft
*about time… lol
man…. what a lesson in building character this has been …
thx for your 24/7 commentating …. calms my nerves …. helps me breath thru these lovely extensions…..
It gets better from here 🙂
https://uploads.disquscdn.com/images/70ef30743868a2a42f0aa813b6ecafce0435f9831f9cde746e8a63a8645939b7.png
This mornings GDX 5 minute chart –
https://uploads.disquscdn.com/images/8bbeec1623f1feb039f9c539f02e2f7e46184856660db42a2e145faec9e8275b.jpg refresh
Now maybe a pause? I see a strong move up, bull flag then completion of a measured move. But point of solid reversal compared to gold comes through in your chart.
I can no longer understand the cycle differences btw gold and miners and am unable to reconcile those differences and line them up in my head. Maybe more on that later, but back to work for now, PM-checking break is over.
https://uploads.disquscdn.com/images/91dffdcb126163e3c02a26ab42a3d306ad7d0162c60ded1d5752f4a42ea4e7be.png TLT (Bonds) 5 minute chart
My HL, MUS have been on weekly buys. Look like they have completed an hourly pullback and are green for the day.
For the sake of others who may have the same troubles, How did you solve your problem about not being able to post? Was it a log in problem with disqus?
Yes, thanks.
GDX , back above the 10sma.
Nice!! GDX
You seem to have even a greater resolve about miners today than even in the last several days where you seemed maybe a bit more cautious…or is it just me? Are you seeing something that has you even more convinced? I say respectfully.
he seems like a hunter, having patience and wait for his prey to bite …. and he knows it’s coming as we speak : )
Hard to explain, but it’s what I am seeing. For example:
In the past few weeks, I have been pointing out GPL, AUMN, and a few others as leaders, acting correctly. Some others looked good, not breaking October lows with Gold selling off to new lows, and yet others still looked vulnerable to selling off. GG looked weak until last week.
Now the list that I commented on above in a different post is a more bullish looking set up of Miners. The list has grown. I see quite a few Miners setting up bullishly, while Gold made new lows.
Take a look at those charts in the list that I posted above, this is on a day when Gold made new lows.
The only problem is that ‘bottoming’ can be a process. A process usually takes time : (
Yes, I see! But, it’s your conviction which is so telling and appreciated.
IAG, SAND, EXK, HL, CDE, TGD, VGZ, MUX, EGO, GSV, NGD, NG, GORO, NEM, SSRI, SA and more ahve turned green
Many people are streaming into the streets shouting for joy, ” Gold is Donw, Miners recovering again, I believe we are due for a reversal!!!” Some are even adding to their positions : )
I’m somewhat confused. Is this a cautionary statement not to add, Alex? Sorry reading the text below this does not seem as cautious!
No, it was me being funny. I should have said Many chartfreaks are…
I added
Today ?
I now see the smiley face I just didn’t see the tongue in your cheek.
yeah… he’s a wily one …
Look at GORO, EGO, SAND, SA, and others using only a 10sma. Pretty! Why?
Because these are bases with rice holding the 10sma still near the lows, that makes it a low risk buy, stop below the lows 🙂
Thanks for the trading tip.
Going to lunch. If you are interested, this is the GDX on a 5 minute chart ( refresh) the way I view it
It started selling off again, is that worrisome?
Not at this point. Please see the chart. If it really breaks down, something else is going on, but this is how I see it at this point.
.
‘
https://uploads.disquscdn.com/images/cbc5c2c07d936d0e4e23fd4a35a8538106b7fb77b905e4ff4d098aa25501cf6a.jpg
Wow, 2.5 MM shares of GDXJ traded in the first minute after close of open session
Was this a buy or a sell Cal ???
Thank-you.
Guert, since this is an ETF, It’s usually just re-balancing. Very normal, GDX had 2.5M come in right at close as well. You can tell it’s re-balancing when the bid/ask doesn’t go nuts but sits right about closing price.
THANKS Cason, let see what is does tomorrow.
Have a good evening.
Go up!! I sure hope!
Sorry, Geurt. – I was already turned off when your comment posted!
I’m glad Cason had an answer
Have a good Tuesday, looks like it’s starting on a positive note for miners
Cal, nice call with the extended gold cycle, man!
Thanks, Cason!
Just bought AUMN right before the flush. Glad it came back. I guess a wide stop is called for on some of these.
I figure we are playing in a rigged system….big $ will beat gold down and play games on the trading field till they have their positions set….then,… we will finally rise.
I broke down and bought GPL on sale today!!
I know, I said it was dead to me. But Alex’s chart in the report just looked so good! Then it stayed on sale with silver going green. So why not give her one more chance? I gave LGCY 3, and GPL isn’t facing imminent bankruptcy either (always a plus!).
I added to mine today…of course, it dropped .04 cents right after I bought it….but that won’t matter soon!
at what point does best of breed GOLD get interesting ?https://uploads.disquscdn.com/images/80c805576a6806417e89f77a76a928fe6dcf73f71a79df218513eea818146019.png
It lost my interest with all that retracement from its June highs and the volume of the selling recently on the daily chart.
what about back down to long term support around 60?
Yes, but that was before the bull market, unless……. It has stair step down three times trying to consolidate will this time be any different? Maybe let’s see.
Tom, I was just looking at NUGT (3X) on a daily for 2016 and the similarity of it with GOLD is striking.
I am trying to post my new report and the website is not recognizing me. We are working on it. sorry for the delay.
The New Report is posted