
June 11th Weekend Report
After we review the general markets, Oil, the CRB, etc, this weekend report will focus mainly on Gold, Silver, and Miners. To the charts…
.
SPX – This is a Fed Week, so I am watching the markets very closely at this critical area. This is rather early in the daily cycle, and if this is “the Peak’, it will likely be left translated. We saw a slight break to new highs and then it gave them up. On day 15, I’ll we watching this closely going into the Fed mtg.
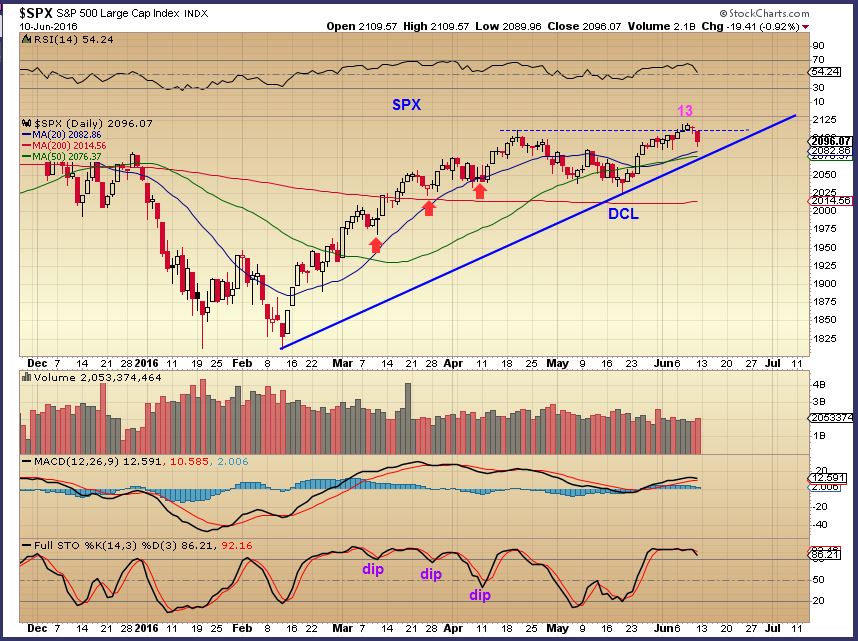
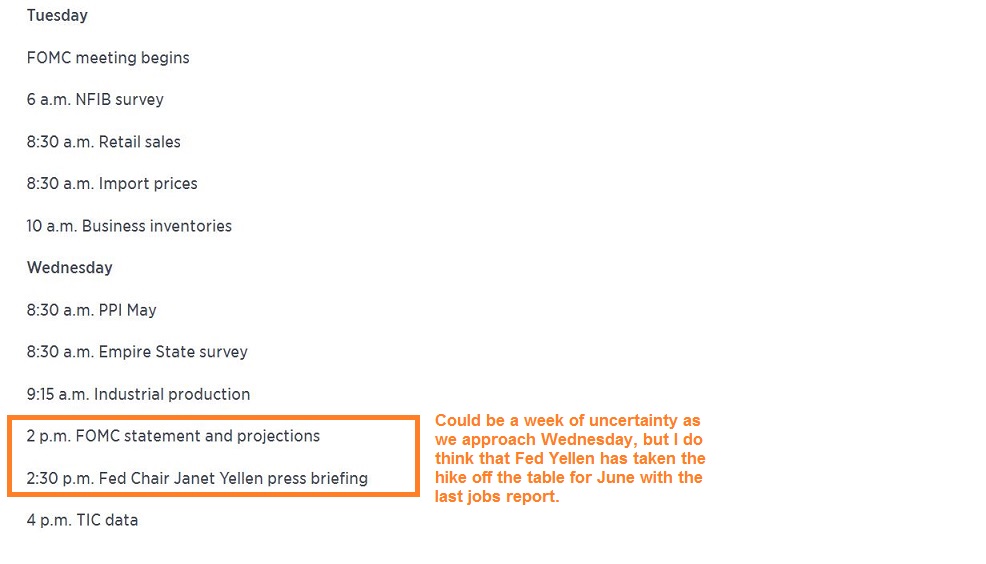
We may not see a lot of strong directional action leading into the Fed Meeting, but I tend to think that Janet Yellen already made strong statements after the weak jobs report was released. The difference could be if she make statements about future events.
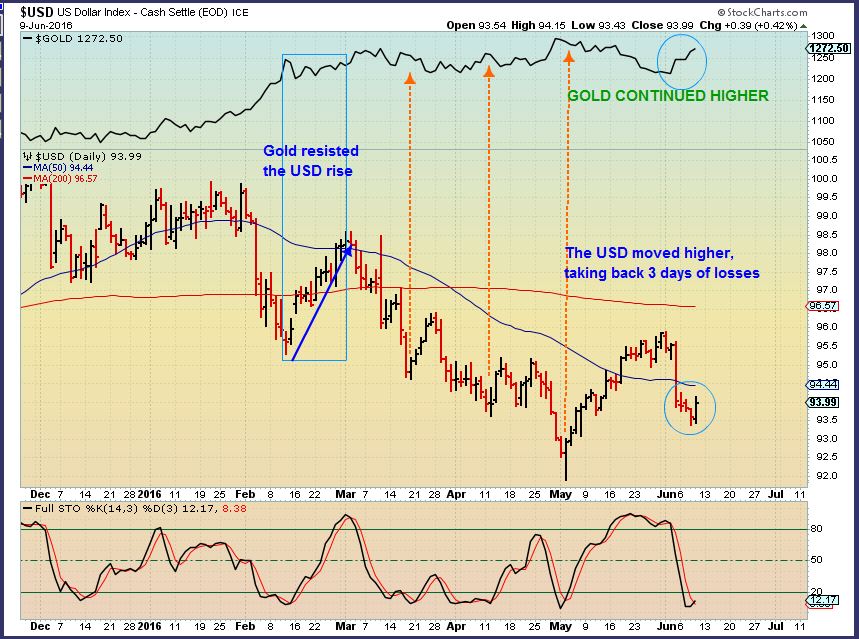
THE USD – Please note the Dollar ut in its expected Daily Cycle Low. 2 strong days higher, YET GOLD WENT HIGHER TOO. Why is that Noteworthy?
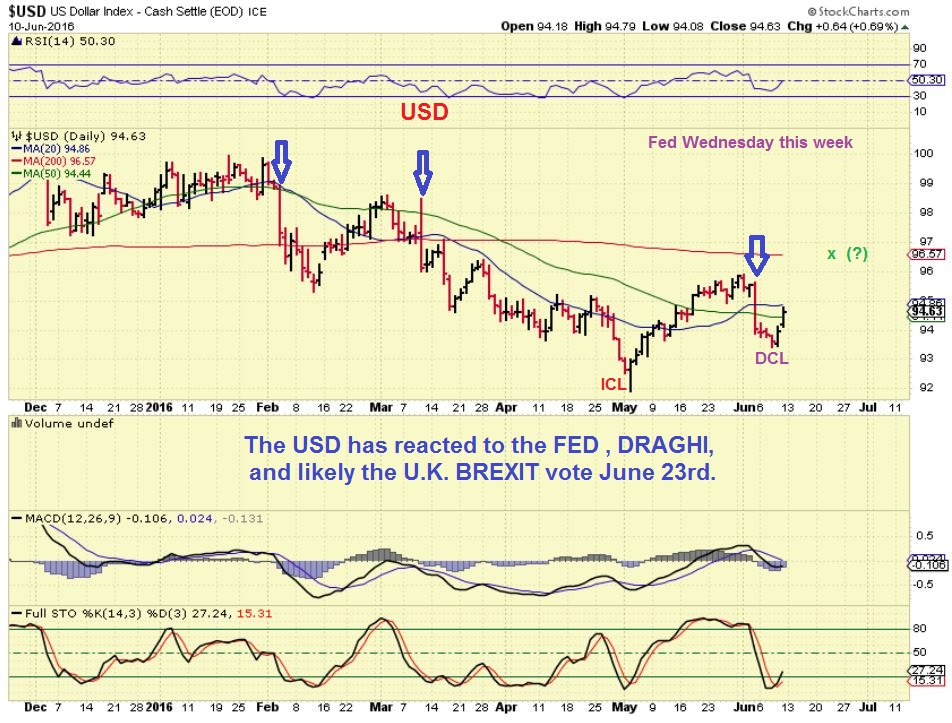
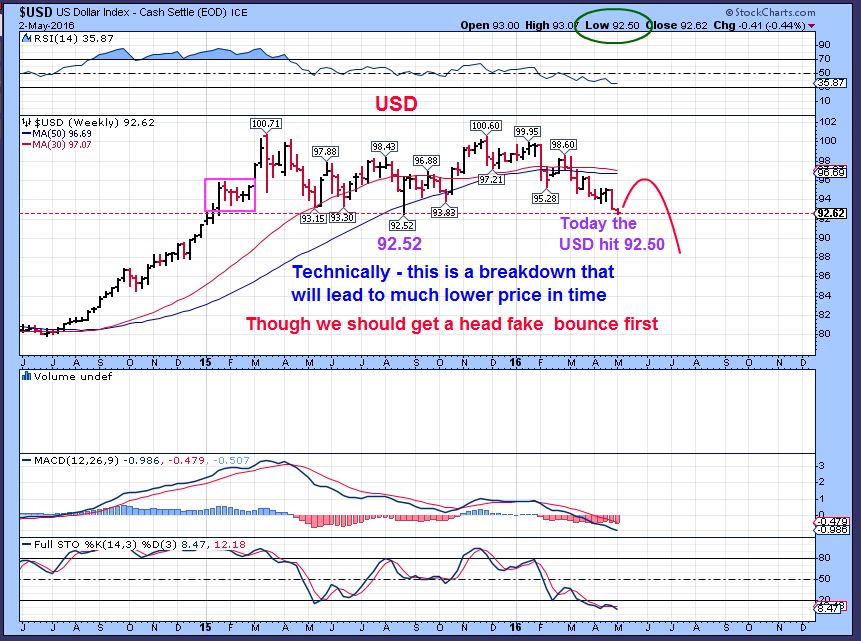
My MAY 3 chart – I am expecting that this is just a bounce in the dollar, and I drew it to 96 or 97 below. It seems that GOLD is rising with the USD for that reason. Usually the dollar rises and Gold drops quickly.
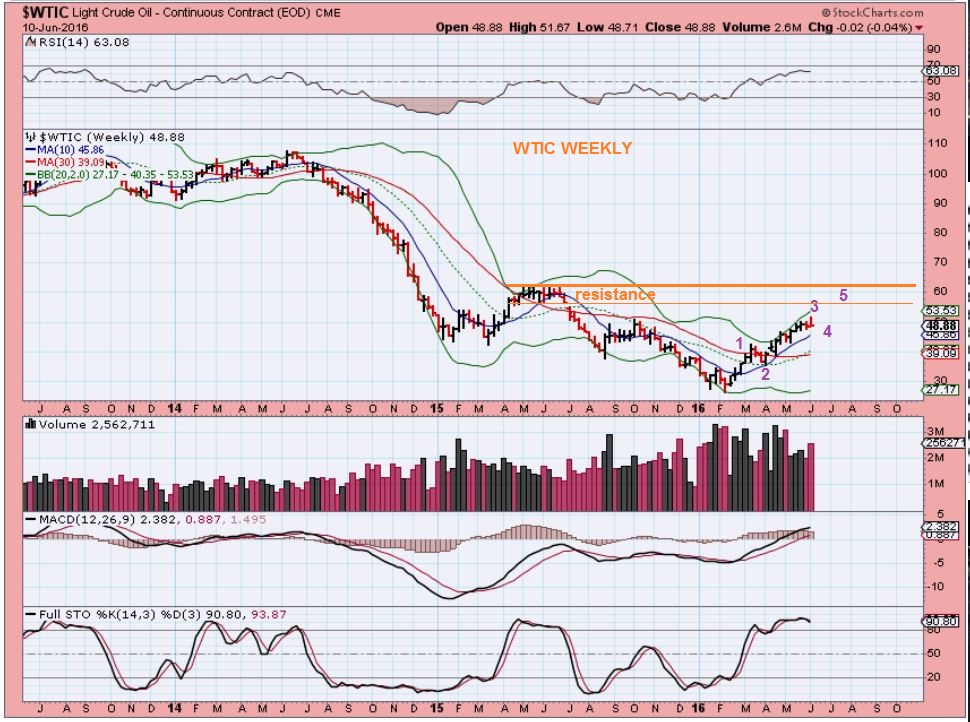
OIL WEEKLY – I have been expecting a dip into a DCL, then a rise to near $60. Oil has not dipped as much as it has gone sideways.
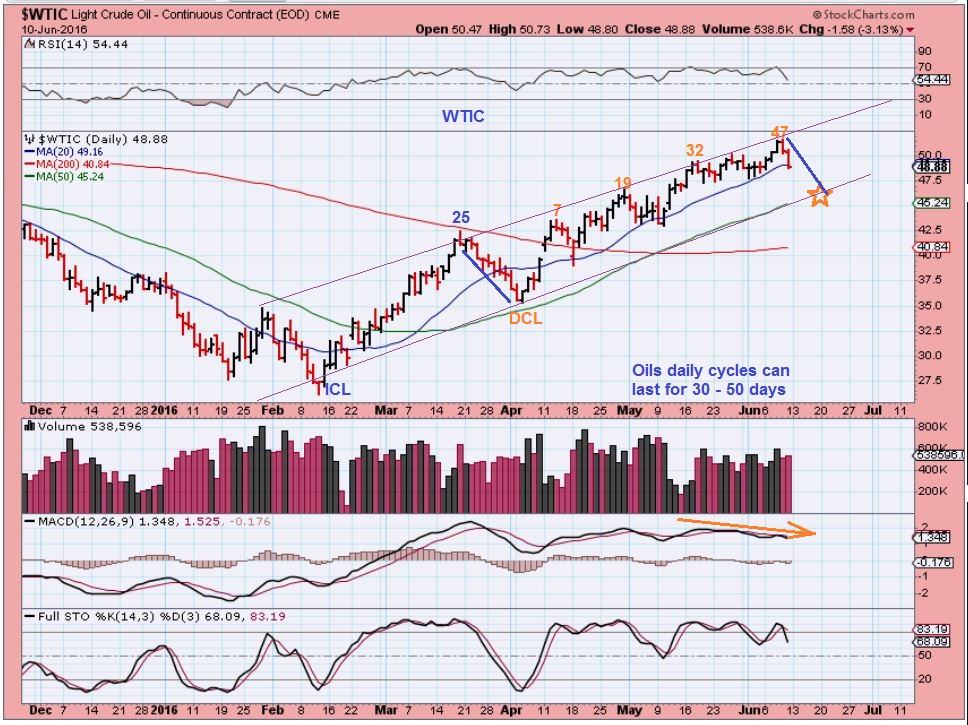
WTIC DAILY – Day 47, Oil has been very strong. This is 1 possible path.
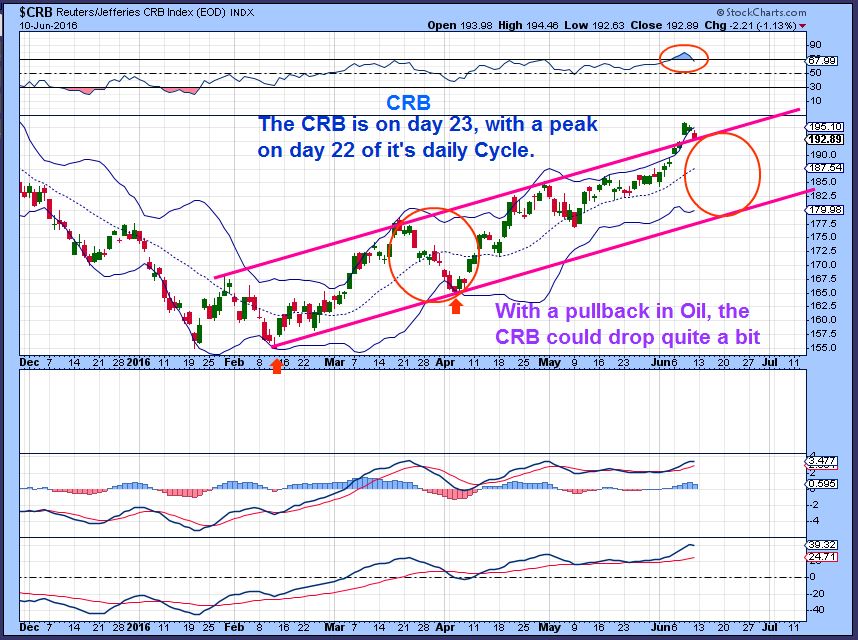
CRB DAILY – Day 22 has the CRB ready to drop into a daily cycle low. Day 22 should prove to be very right translated, but the drop could be similar to what we saw in March.
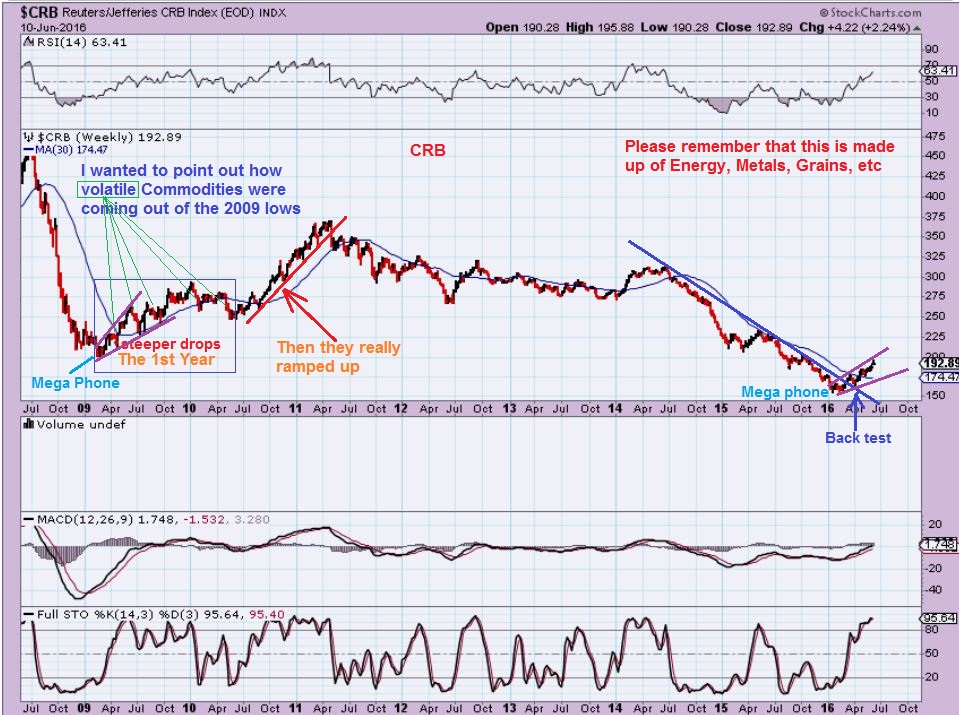
CRB WEEKLY – looks similar to the 2008 lows. It had a lot of volatility in the first year, and then really ramped up after a sideways consolidation.
.
GOLD SILVER & MINERS
GOLD REVIEW – I had mentioned weeks ago that I thought we saw the ICL. It was getting late timing wide for that meaningful / trade-able low. I said that a break of the trend line overhead offered more confirmation, and we got that.
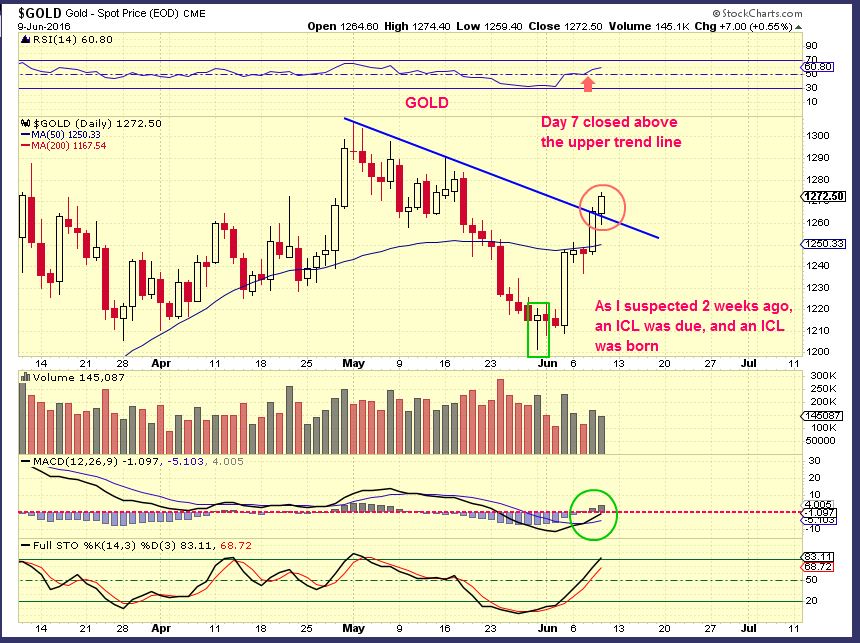
This chart was posted on Thursday. On Friday we also saw the USD move higher (See chart in the beginning of this report) and yet GOLD, SILVER, remained green again, Miners broke to new 2016 highs and closed slightly red.
In February we saw the USD rise and Gold went sideways.
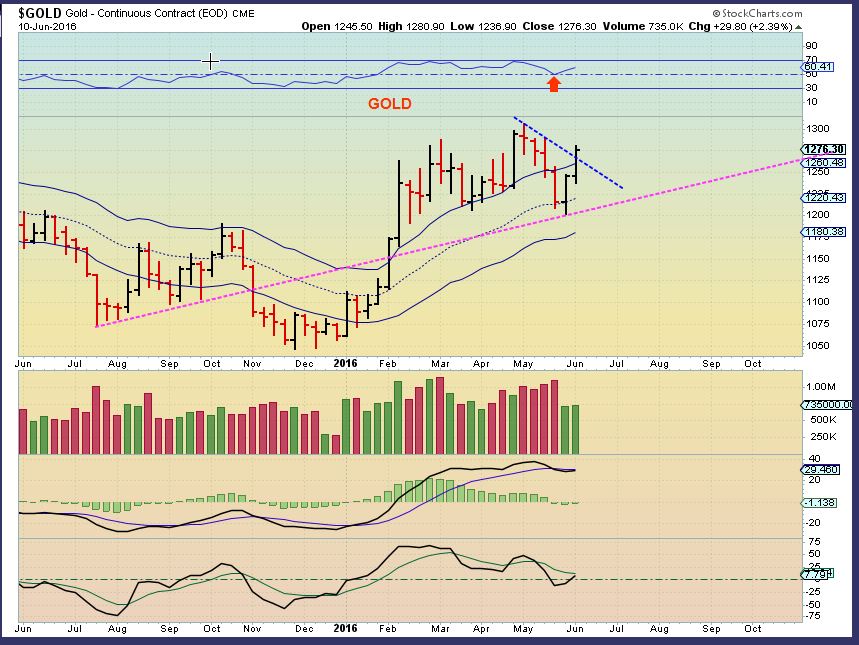
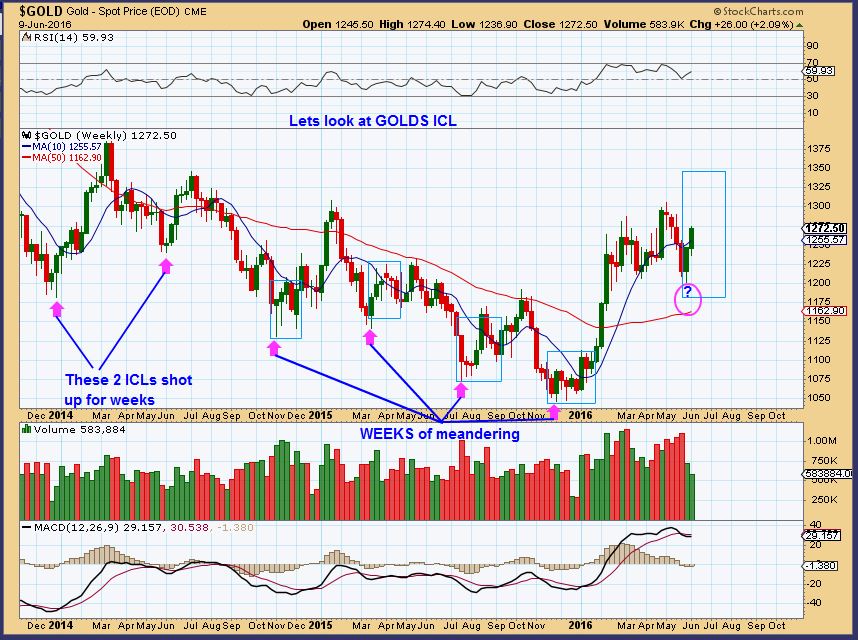
GOLD WKLY – This weekly is telling me that we saw an ICL too. What kind of follow through will we get? That can vary, and I will discuss that further in a minute.
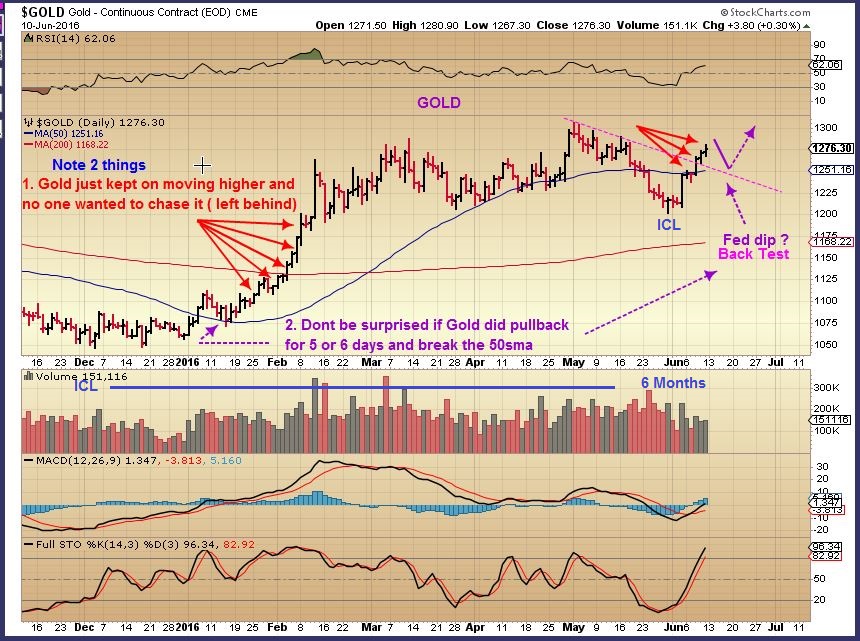
GOLD June 10 – What kind of follow through? Gold is on Day 8 , and we are getting follow through. I wanted to point out 2 things on this chart. Why? It seems that as soon as we get a Red day in Gold, people think “The move higher is now over. We are left translated.” Then they quickly sell. It may be helpful to look at past post- ICL action. Read #1 & #2 on the chart, we could see either.
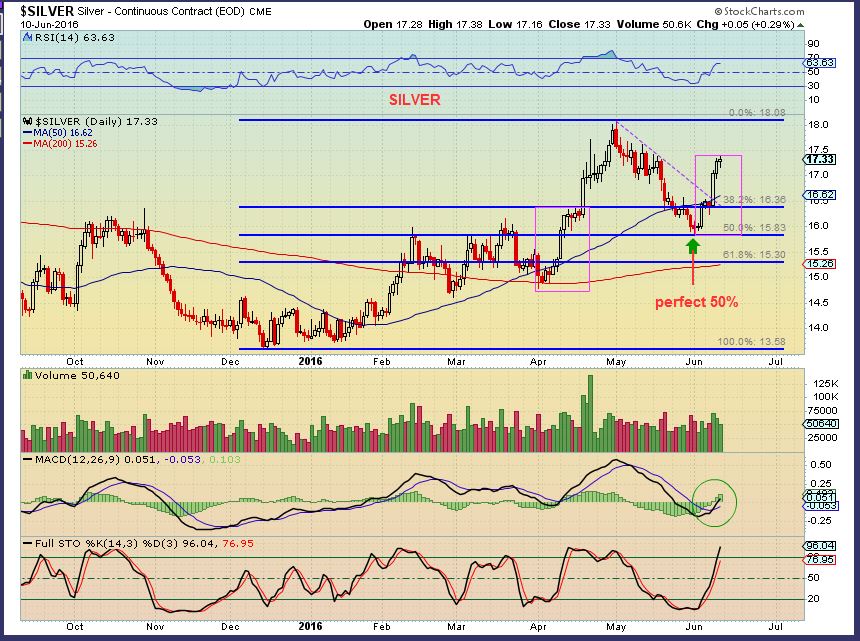
SILVER – A perfect 50% pullback and a nice run higher out of the lows.
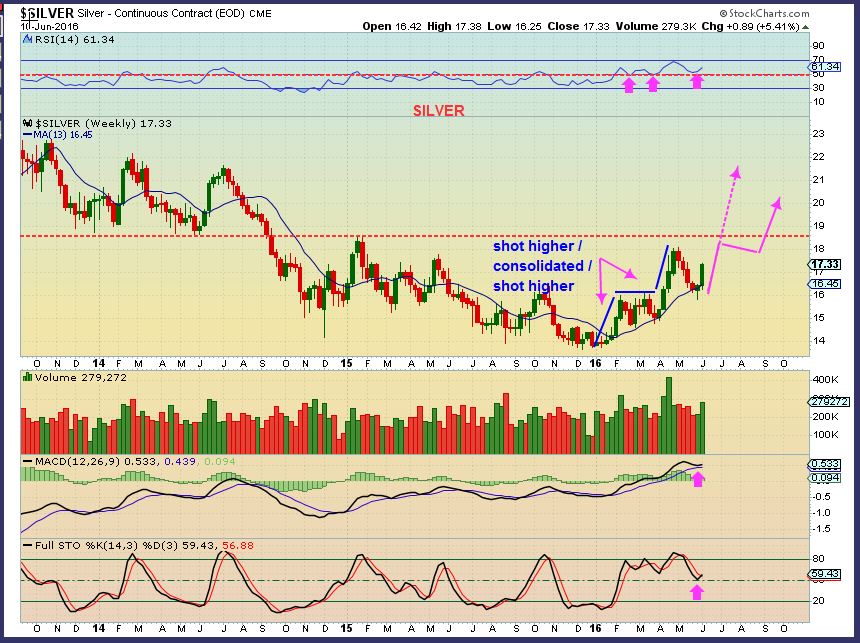
SILVER WEEKLY – It also may or may not be a straight shot higher. See the chart.
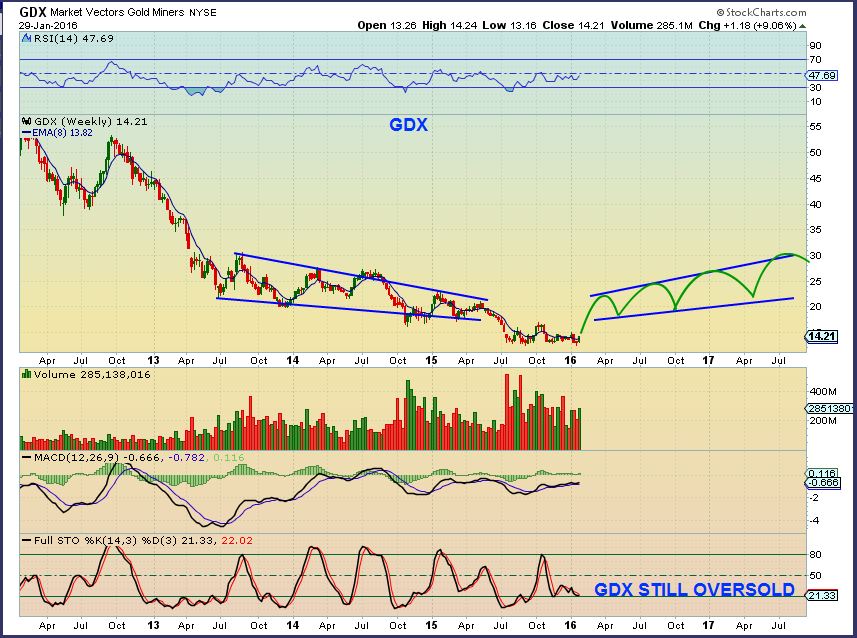
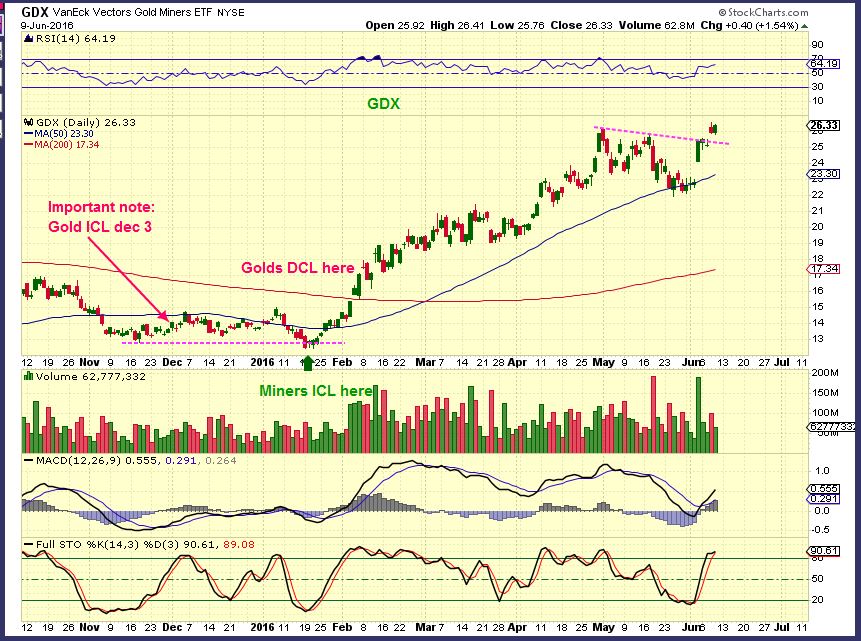
GDX WEEKLY – I actually drew this chart in January. I expected a blast off of the lows, and then we hit a bit of resistance and I thought our ‘cycles’ might bounce and look like this .
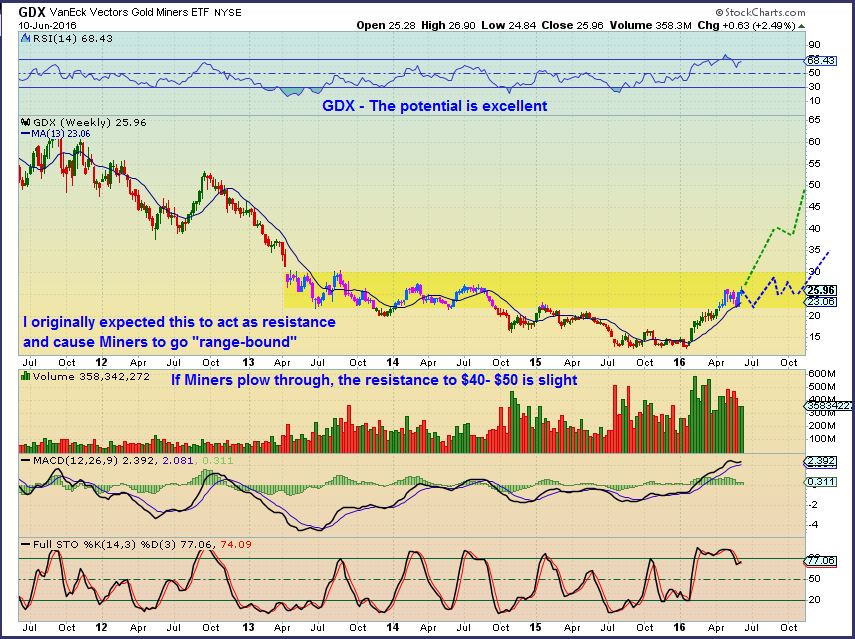
This is GDX now – So I am drawing 2 possible paths. I have reason to believe that either could happen. Time will tell.
1. a sideways consolidation due to resistance on the left side
2. A rally continues because those who missed the first move will not want to miss this one, so more buyers could pile in.
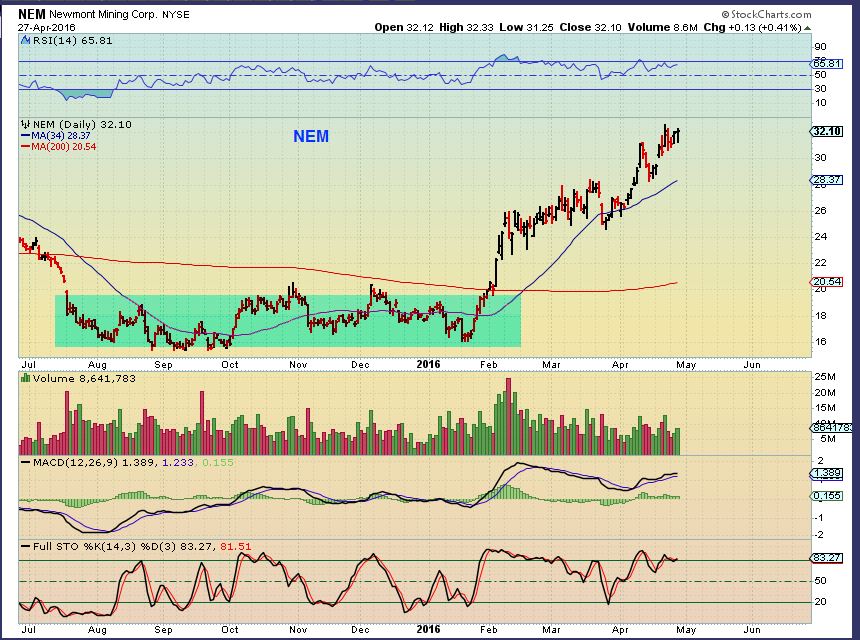
When we break from a base, I have repeatedly shown that the results can be explosive. This was NEM, and GDX could be in a larger base and act this way too.
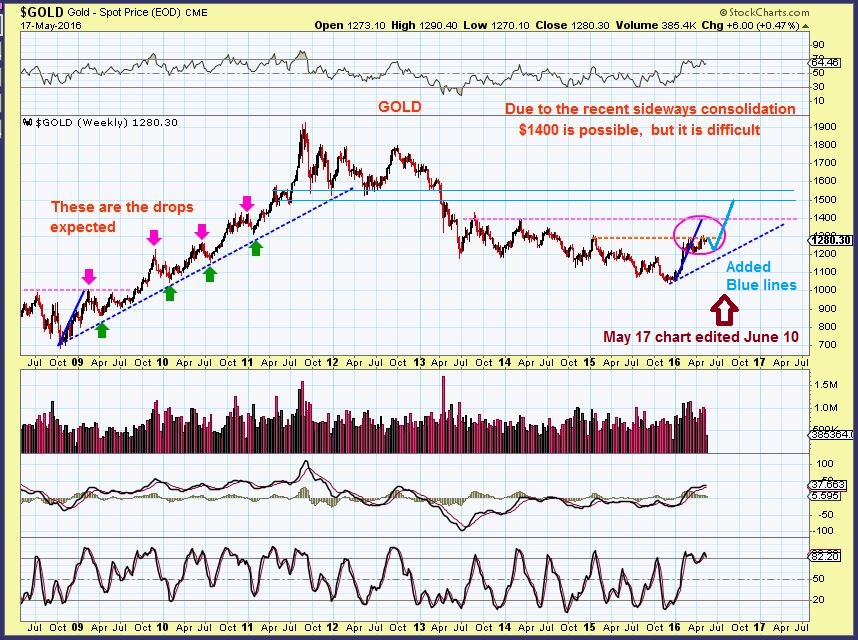
I posted this chart on May 17th in my report to you, pointing out that a run to $1400 is possible. Since I posted this, GOLD dipped to $1200 and may have built up necessary steam to proceed. I updated with BLUE LINES. Now $1400-$1500 is even possible.
ICL ACTION
Here I am using my own personal indicators and comparing it with the move out of the lows in 2008. Before I began ‘Chartfreak’ I developed several ways to prove to myself if what I was seeing was either genuinely improving bullish conditions or just bear market rally action. What I see happening remains quite bullish, resembling early bull market action. It also looked to me that an ICL just occurred.
.
More about Golds follow through at an ICL
.
I know that when Gold starts to drop, I often hear that it is ‘weak’. When Gold has a red day around day 7,8,or 9, I hear ” This is going to make Gold left translated and thus will roll over and fail.” This is how emotions are conditioned after a lengthy bear market where many have sustained great losses due to Precious Metals failing at critical points. YES- WE SHOULD REMAIN CAUTIOUS, but we need to have a plan to avoid endlessly jumping in and out. To combat that feeling, I want to post charts that will help the reader to understand that a dip in Gold from here is not necessarily bearish or Gold ‘failing’ early ( after all, we may see Red with the Fed MTG Wednesday, right?).
.
I posted this in the Comments Friday. When I called this an ICL in Dec, I got flooded with emails on each dip. I heard
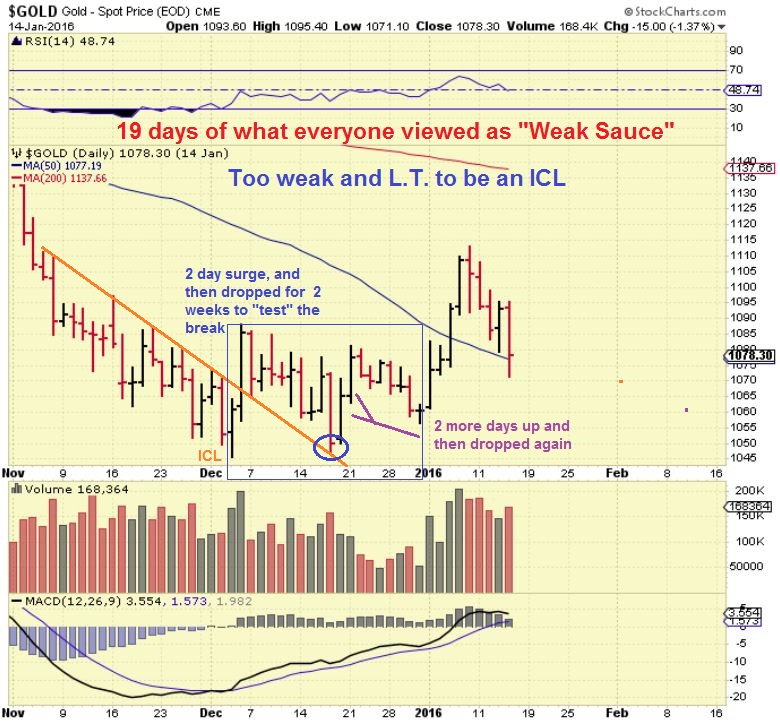
” This is ‘Weak sauce’ -an ICL cannot act like this, it is doomed to fail.” You may remember that I posted lengthy weekend reports in December on the YEN & GOLD , on The FED raising interest rates not hurting Gold, I showed my personal indicators that pointed to an ICL, etc. I tried to help readers to see that this could be how an ICL acts.
.
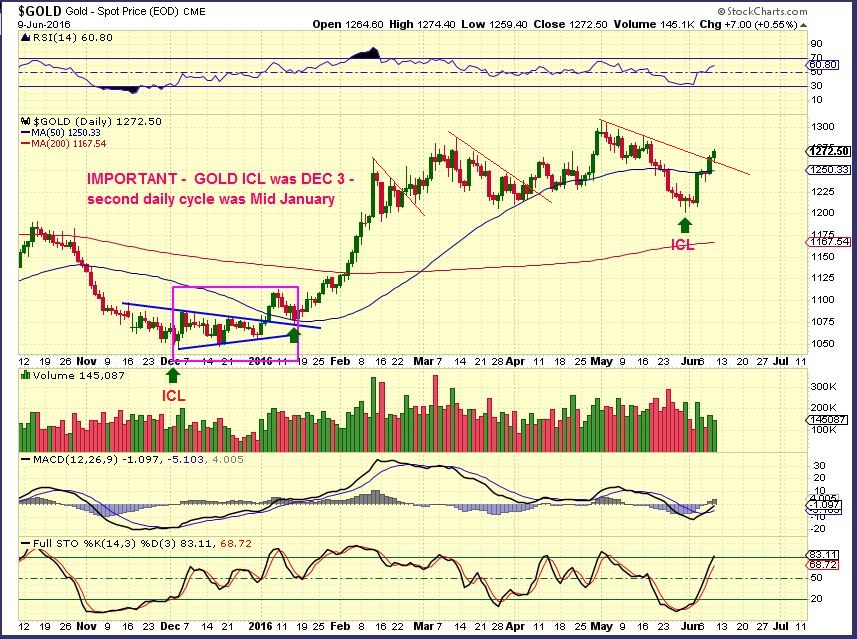
Look at this Intermediate Cycle Low (ICL) on Dec 3rd. Those lows were never broken, but there were scary sell offs. I think one of them was the Fed raised rates and we had a steep slam that back tested the tredline, and then recovery. So the ICL that I see right now in Gold actually looks WAY more bullish than this one did. If it is the ICL, the lows cannot be taken out, so a ‘stop’ is placed there.
.
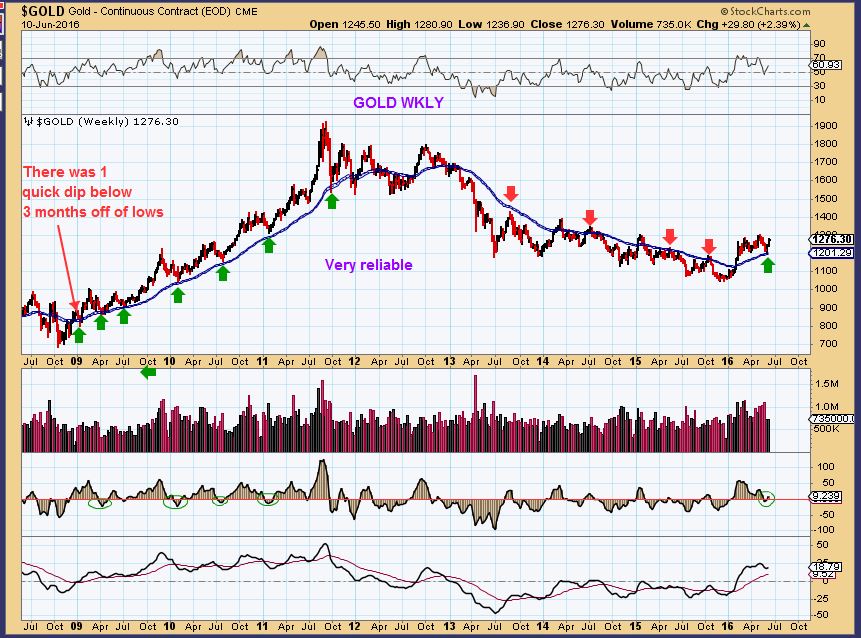
Past ICLs – Lets also take note of past ICLs. Even in bear markets, they are very trade worthy rallies. Notice that some (The last 4) took a while to really get going. This is a weekly chart, and some ICLs took weeks to move out of the lows. Look at the current one. It is the ONLY one starting with an RSI of 50 too. This looks like a bull market ICL.
GOLD June 9th – Again pointing out that we broke the overhead trend line, and last Dec 3rd Gold didnt just rocket higher. This may take some patience.
Cautionary note : I have to caution that last Dec when Gold put in the Lows, Miners went sideways and formed a shake out in Jan. So lows for GDX came 1 month later. I still see GDX as having put in its ICL, because it just broke to new 1016 highs. This chart was Thursday, GDX closed slightly red Friday, and may be closing the gap.
So that is the weekend report. You can see that I am trying to point out the bullish things that I have been seeing to build conviction that Golds new meaningful lows (ICL) from the recent consolidation look to be in place. Remember that ICLs can run for 6 months from low to Low. This is just starting. Knowing that would help one to view things this way –
1. If Miners drop heading into the Fed Mtg, it may be a buying opportunity -or-
2. If Precious Metals continue to rise going into the Fed, and then drop after the Wed Fed meeting, it could be a dip into a 1/2 daily cycle low, and then we will move higher again next week. THAT could be a buying opportunity too.
We will have to see how this plays out. I will be looking for MINERS low risk set ups next week.
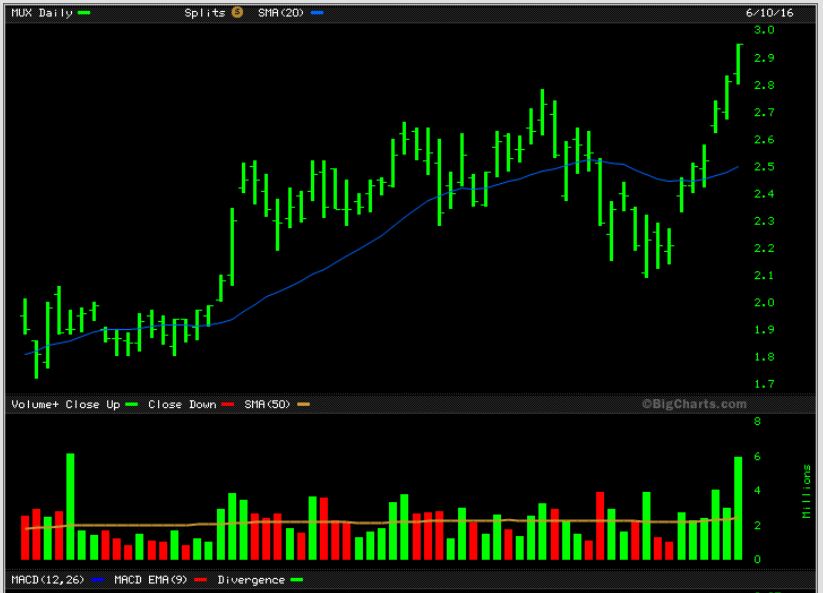
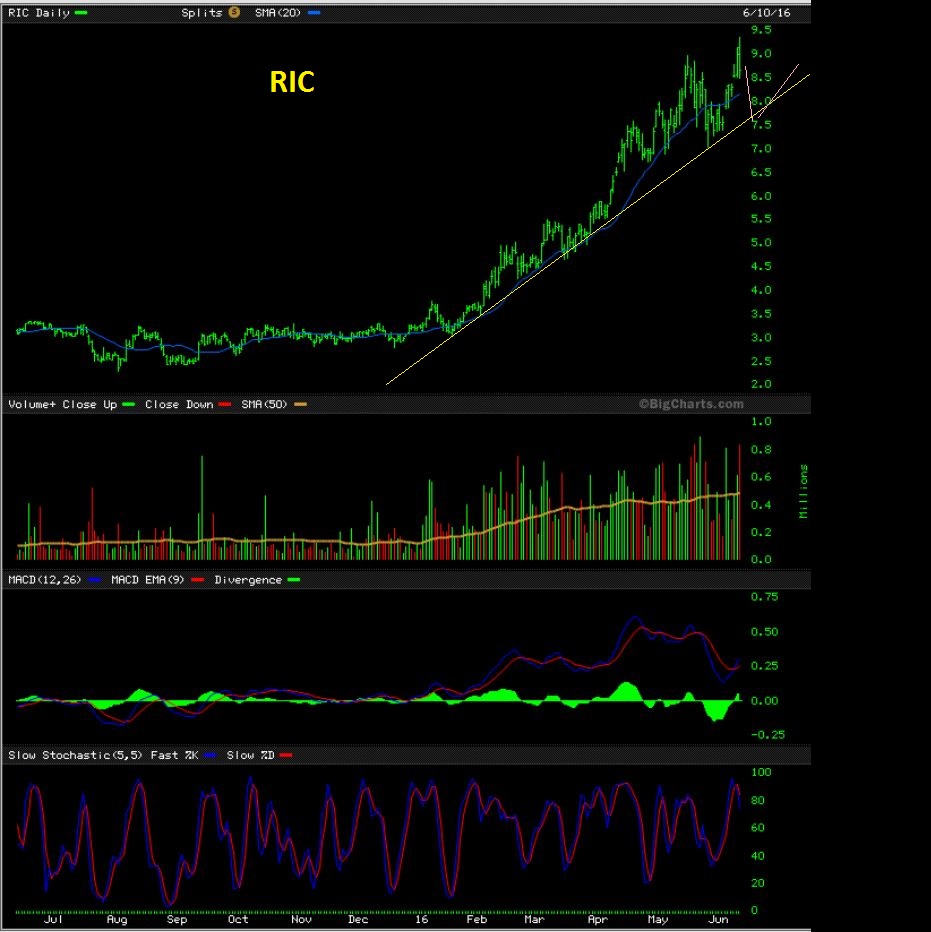
Note: It does get tricky at times after the run starts. For the past week or two, I have mentioned that some Miners are leading, and that is also Bullish to me. Now GDX, RIC, SSRI, AG, CDE, MUX, etc all just broke to new 2016 highs and guess what? Not many really wanted to buy, not many believe it again because of the “Gaps” below. ( Not here, I mean in some other public blogs) .
MUX – Bullish, I have mentioned MUX a few times last week in the comments, saying that it looked ready to break out. Now too extended to buy. Add on a pullback.
Fast forward to Friday: Now that many Miners broke to new highs, people did want to jump in and guess what? Leadrs like RIC, CDE, AG, etc. reversed at the highs. Short term false break outs.
RIC – Puts in a huge reversal candle after breaking out.
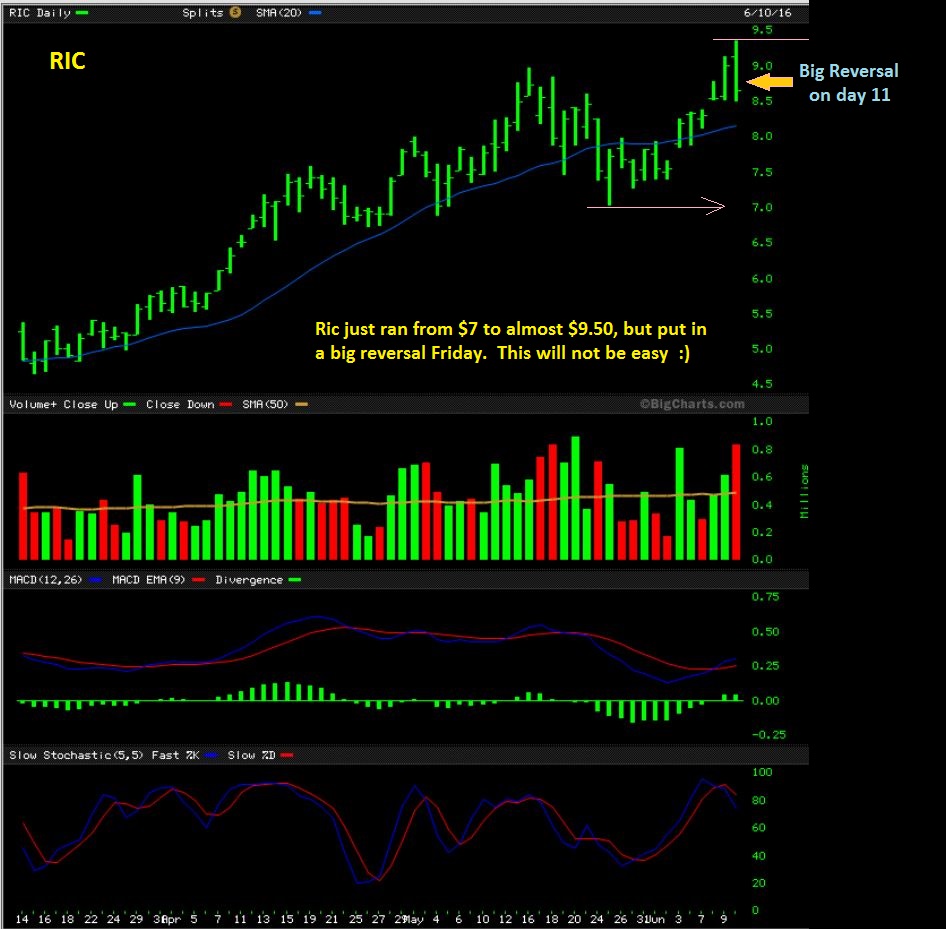
RIC – If you believe that the Bull has returned, it may just be a matter of trying to keep the big picture in mind. Try and pick an entry that looks reasonable in a bull market. Will those 2 gaps now fill with the Fed Mtg? This may not be easy.
I will be analyzing Miners going forward and will post them if they continue to act correctly. Look at Miners From Jan 15th. That is when the move from its ICL started . Buying in February was still very profitable, so stay tuned and well be looking for Miners to take positions in. Have a nice Sunday and we’ll be watching thing on Monday for clues heading into the Fed Wed Mtg.
.
~ALEX
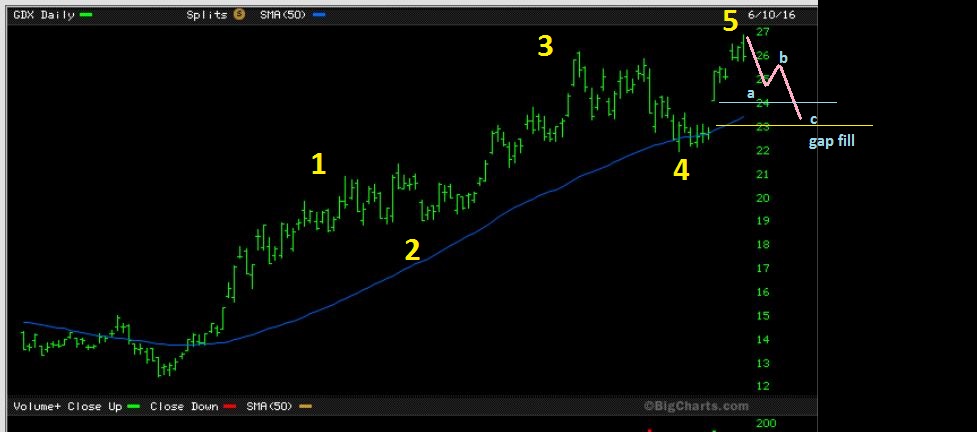
P.S. I dont want to confuse anyone, so I wasnt going to mention this, but I should. MINERS bottomed 1 month after Gold and I need to look into that going forward. Dec 3 2015 was the ICL for Gold, Mid Jan for Miners. Could that happen again or are they in sync? I was looking at E.W. for miners and looked like GDX just completed 1-2-3-4-5 to me, and now would have a small a-b-c correction, but it would still be BUY THE DIP . A Larger a-b-c than shown here below 4 would put the ICL for miners there. I am not going with that conclusion right now.


Great work Alex! Thank you.
Hi Alex,
I grabbed some IPI and DNN last week just when you got back….could you comment on them now please?
Lots of great trades recently. But man IPI was NOT one of them. That was definitely the goat of the week.
IPI is moving up again, finally.Lower BB and 50-day are in the 1.19-1.20 range. Above that, probably ok to keep holding. I’d stop below there.
Thanks for the comment…the goat award comment actually made me LOL! I have to work today so I think I will put a stop in place.
IPI continuing to move up right now. You can put stop below 50 and feel good for today. Can always re-analyze and move that up tonight.
I took the day off just so I could pepper CF-land with my great comments.
Thanks Alex.!
Just want to clarify HBM in the context of this chart you posted on the CRB… Does this mean you are no longer bullish on HBM (I’m holding at breakeven based on chart posted June 8) 🙂
Just for fun, let me take a guess. Alex shows several charts above for WTIC in which he expects a pullback, but then higher prices to $60 eventually. He also shows an expected pullback in CRB. If you compare HBM to WTIC you’ll see some similar moves. So, I would expect HBM to pullback in the short term but then move higher with OIL longer term. GOLD and MINERS moving higher out of the ICL seems out of sync with the above statement? But that what is expected. Although some of CF charts above show a possibility of a pullback or sideways move in Miners and Gold.
PMs continue to surprise to the upside. All of our charting for pullbacks seems to produce no fruit, trying to stay patient but good thing I ‘panic’ bought last week to at least have some skin in the game.
Fun? U hav fun? …hehhe heee heee snicker
ChartFreak musta needed a vacation after his vacation. ..poor widdoguy…
*im at a conference this week… lucky u guys… lilited gifs case…on my cell ….
Thanks Alex! I would like to share something with everyone here, since I think most, if not all, are interested in precious metals and mining shares. I follow someone on stockcharts that I think would be of benefit. It is a TOTALLY FREE service. There is no pay or subscription of any kind for this info. The one thing I don’t know though, is if you have to be a stockcharts member to view it. It is a public chartlist of someone I have been following for a few months, and I believe has top notch analysis on gold, silver, miners, and the markets in general. But I’ll leave it at that until you give me the ok to post it. I think you might like it as well….
Hmmm….it does look like the public chartlists might be a feature only for stockcharts members. But if anyone is a stockcharts member and want the info, drop me an email and I’ll send the name that way. I think it is absolutely worth it. Consto12@gmail.com
The recent ICL Alex called is the only time that GDX/J fell all of the way down to the 50-day since the Bear Market Lows in January. The rest of the time, the 20-day has stopped any downside. So….if we fill the top gap and land on the 20-day, I’m going long, probably real long. If it then goes below the 50-day, I’d be wrong and need to stop out.
So, the same analysis for GDX shows 6.818% lower to 20-day; with NUGT currently at $106.88 that would be a move down to $85.02. Good luck all! Silver taking it in the face Sunday night in Asian trading.
…. Mystic rhythms …. chartfreak1 🙂
Super report Alex! Thanks again.
While everyone in the stands is distracted by oil’s slide, and the umpires are deciding on the call (safe or out?), here comes little Natty up to the bat and smack! He plays well in this heat!
Was that LGCY with the 50-day shakeout this morning. Why I do believe it was!!
CLF new motto – I don’t quit! Dips there can be bought, imo. Check out the accum/distro line, it’s nearly vertical!
Hi all, this weekend I ran a stock
screen that is based on the rules that Jesse Stein sets forth in his book – “Insider Buys Super Stocks”. It’s a pretty selective screen and I often come up with nothing. (Stock less than $15, PE less than 10, strong base breakout after long base, above 30 week moving average, high angle of attack, clean chart (slow and steady decline), momentum in the past, low float under 10 million shares, recent earnings surprise.
The only stock that came up is PACD
I checked out the fundamentals and they look good http://news.cmlviz.com/2016/06/08/pacific-drilling-s-a–nyse-pacd-financial-condition-compared-to-s-p-500.html
PACD looks good. I have owned it in the past. Positive net income is rare in the energy sector. also increasing revenue. It is coming out of a long base, but seems capped at the 200sma. It may be a very good buy, once OIL stops dropping.
Oil looks like its stabilizing and even moving up a bit.. The next 52 hours it may just drift sideways like a line in the sand, until the fed report.
Not much of a correction for OIL then?
Yeah, somebody forgot to tell OAS that oil was supposed to pullback!
Hi Crystal. What does ‘high angle of attack’ mean?
I believe it means that when the stock moves out of its base, it moves at a steep angle upward
Thanks Crystal
Buying LABU here near that 100 sma. Hourly macd is getting pretty o/sold, and acc/dist not confirming the move lower last few days. Would stop out below the 100. Possible that it bounces and falls back before it rallies, *if* it rallies.
Yeah, I was a little early with my but Fri. But I don’t love the chart here. In giving it another day but unlikely to add and more likely to stop out. Are you talking 100-day on LABU, XBI, or IBB?
LABU
LABU worked great for me last run, Id be looking to get in under $30.. 100 holding for now, but if it goes lower I’ll get interested. 61.8% is 29.02
Agree Bill. MACD in the shorter tframes VERY o/sold, so it should see some kind of bounce. Not crazy about the daily, but at least macd is still above zero.
Ok, will look for next add is 29.x range, thanks.
2nd GDX/J reversal day in a row. Otherwise? BO-RING! Not even a .gif in the comments. I’m going to go find something to caulk.
LOL…better than watching paint dry?
LOL… Exfoliating is also a good option when time presents itself 🙂
That darn GEVO is on the go again 🙂
Man, look at the dislocation btw S&P and the VIX. I haven’t seen it that far off in a very long time. That’s a really ominous sign to me.
Gosh I hope Alex is okay…. Even on vacation he posted …
As long as none of us were short volatility, should have all be at least ok. I’m really glad I dumped my TQQQ when I did last week instead of waiting to stop out this week on a loss. Intuition kicked in, market just didn’t feel right to me.
Thanks to IPI for saving what otherwise was a pretty crappy and boring day. Tomorrow likely to be worse for boredom ahead of Fed though funds rate pricing in 1% chance of rate hike as of this AM!
Thanks Crystal, appreciate your concern. All is O.K. now. 🙂
Collecting charts for the morning report .