
Make Hay While The Sun Shines
A farmer has to take advantage of the opportunity to make hay when the sun shines. If he has other things to do, they’ll have to wait for a rainy day. He cannot make hay on a rainy day. A trader or investor has to invest when the ‘set ups’ are ready. If the low risk set ups have presented themselves, and he or she decided to pursue something else for a while, by the time they return, the opportunity may be gone.
.
With that in mind, lets make some Hay today.
.
WTIC – Think about this. Last week I pointed out that OIL would move higher, but it is in a resistance area. It could struggle a bit. There is good news with this…
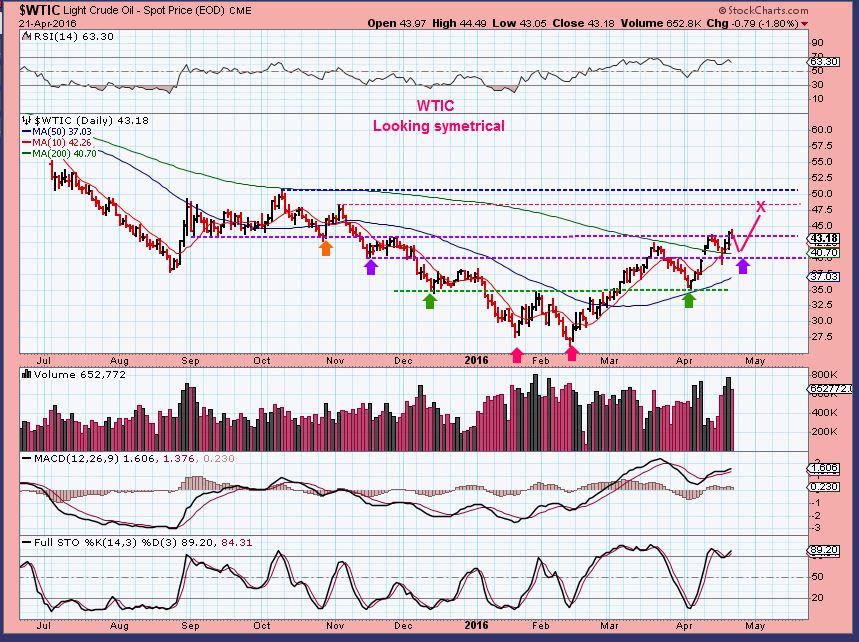
WTIC – It is working its way higher, with resistance on the left side. If it shot quickly straight to say $50 , our energy stocks may not have time to move along . As it slowly makes its way higher, Our Oil / Energy stocks are really taking off. Some were up 20-30% yesterday alone. Some were 20% for a couple of days in a row.
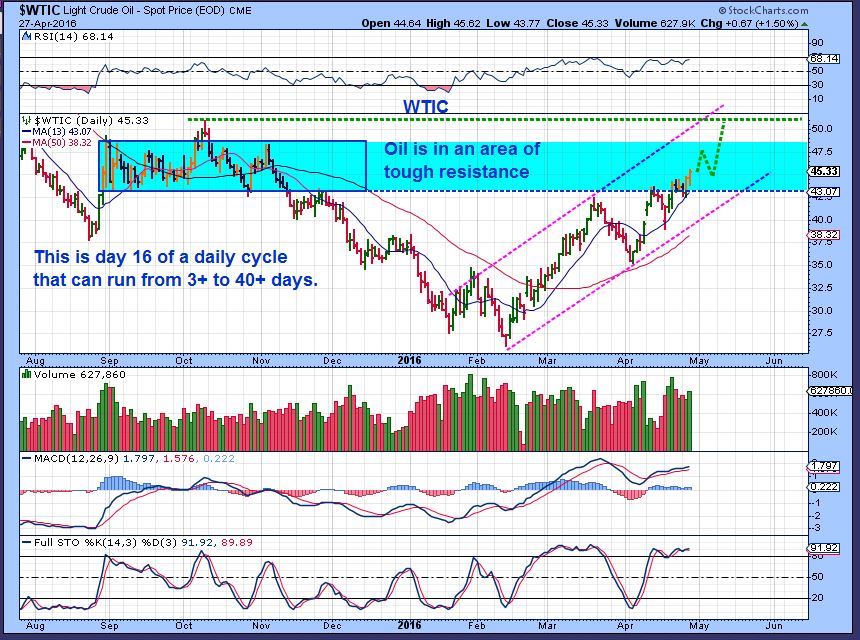
So if Oil slowly continue higher, that is great. More of our Energy stocks may continue higher. Also when OIL dips, some stocks may pull back for a better entry.
.
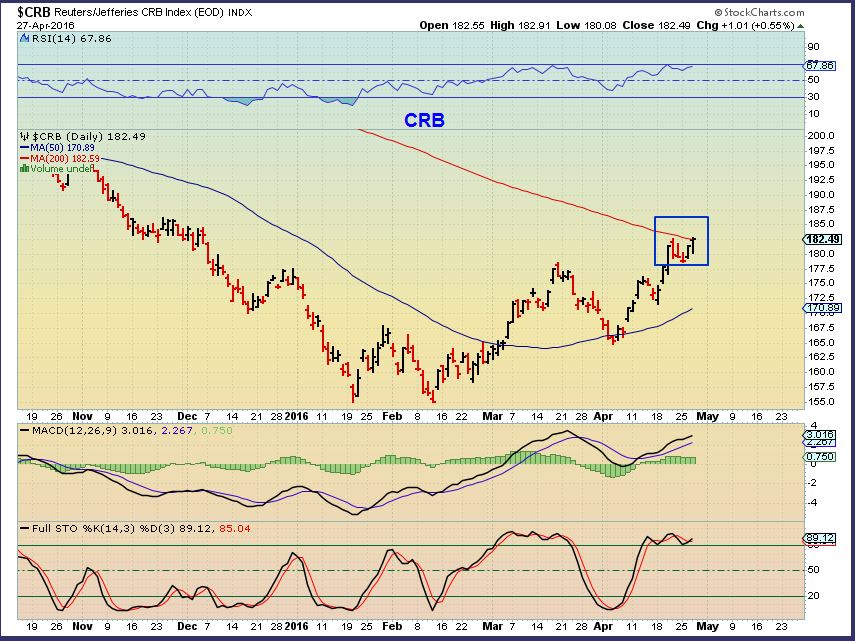
THE CRB made progress too. Still pushing against the 200sma, it didn’t back down with the FED DECISION. Therefore we saw Commodity stocks taking off too. If the CRB pulls back a little today, we may get another entry on some Commodity stocks too.
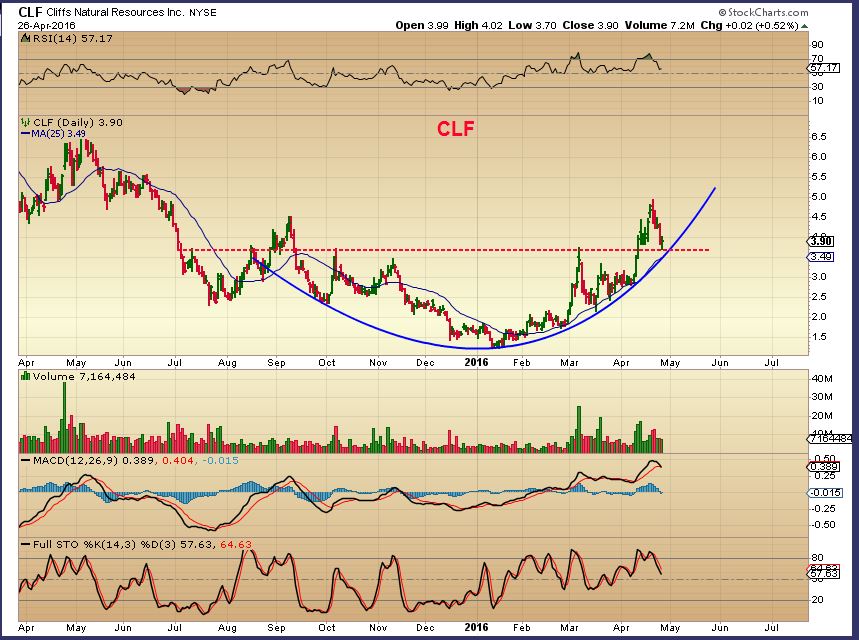
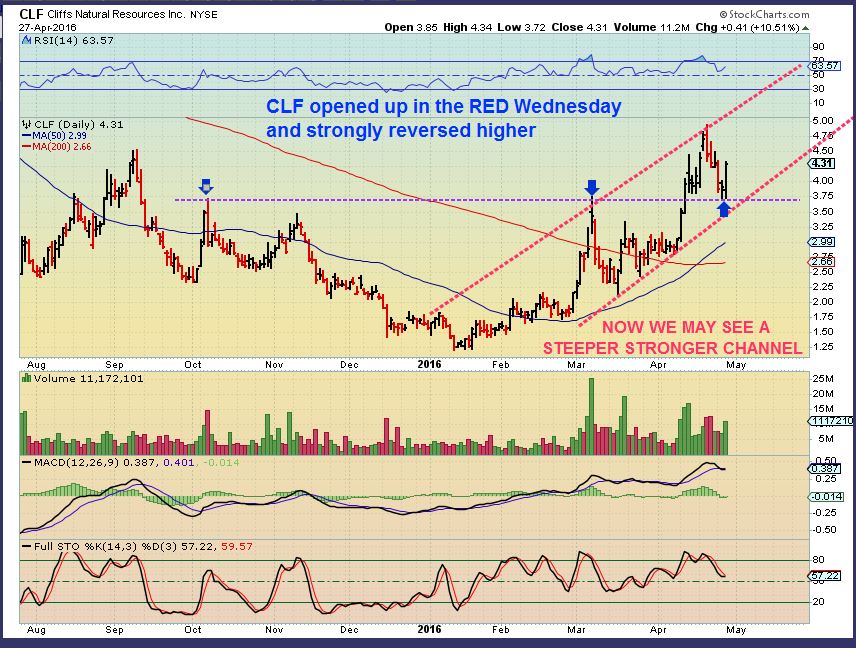
CLF – Using this chart yesterday, I pointed out the possibility that support would hold and it may not drop further, so a ‘starter position’ may be taken. I said that I took one simply because ALL of the commodities reversed strongly Tuesday.
I showed the reversals in FCX, AA, etc.
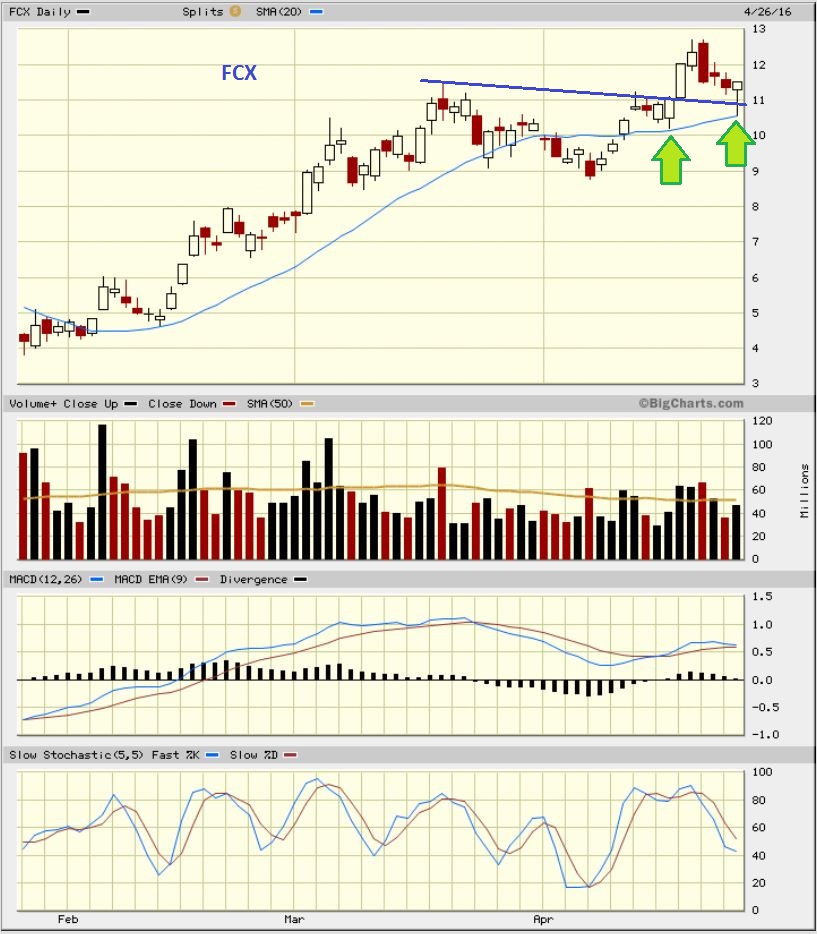
CLF Today – There is a possibility that CLF will now move at a steeper incline. Since Commodities look strong and almost all have reversed higher, it may be best to just take a position anywhere here. If you cannot stand draw down, start small and buy or add if it dips. * Please also notice: When CLF dropped in March, it also reversed and spiked higher for 3 days and then went sideways to the trend line. I cannot tell you what CLF will do from here, but if it dips or goes sideways , it may be a better BUY opportunity .
.
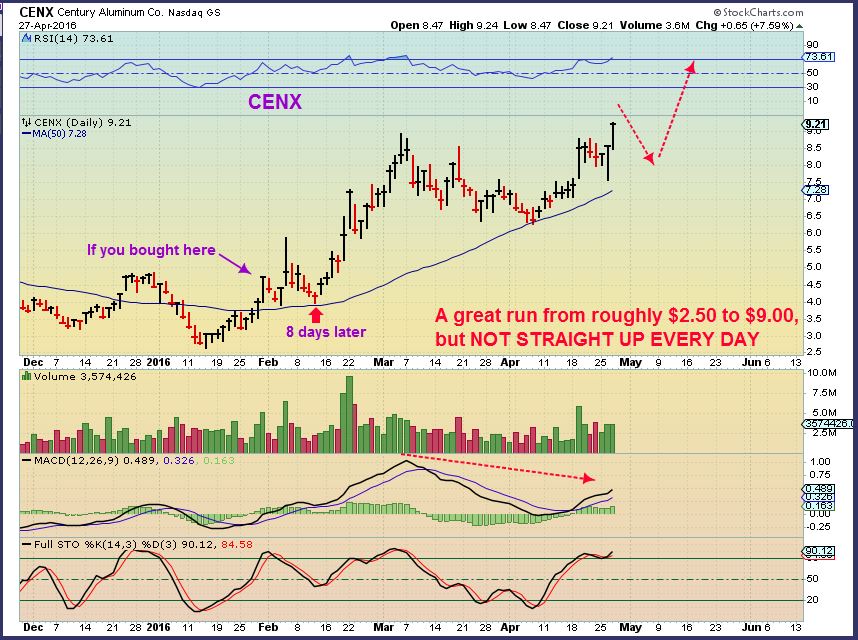
I want to show you the CENX chart as a ‘lesson’ too.
.
If you have been with me for a while, you already know this lesson, but it’s a nice reminder. The lesson is that these do not always run straight up . You may buy a stock with Down days. It doesn’t mean “something is wrong with that dog”. Look at-
.
CENX – I recommended it here as a low risk entry on April 12. $6.50- $ 7.00 Would it just fly to the moon?
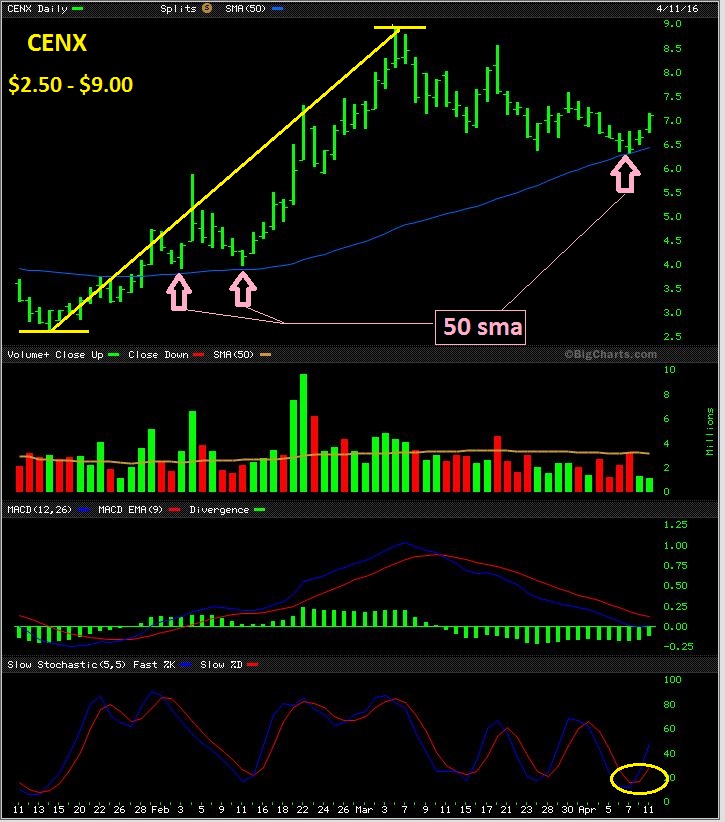
CENX had moved higher, sideways , dipped mid day and is still only $1 above the buy a week later. IT is how they consolidate. The set up is still right, so patience is needed.
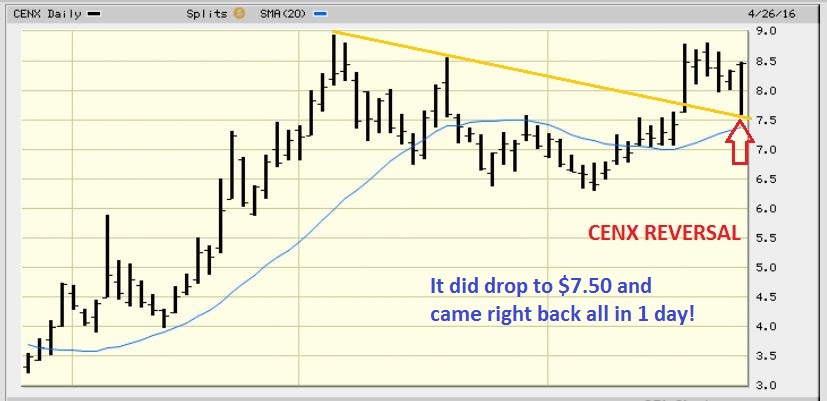
CENX Today – This chart actually looks really bullish. As I pointed out on the chart, even that first run higher, $2.50 to $9.00, was very Bumpy.
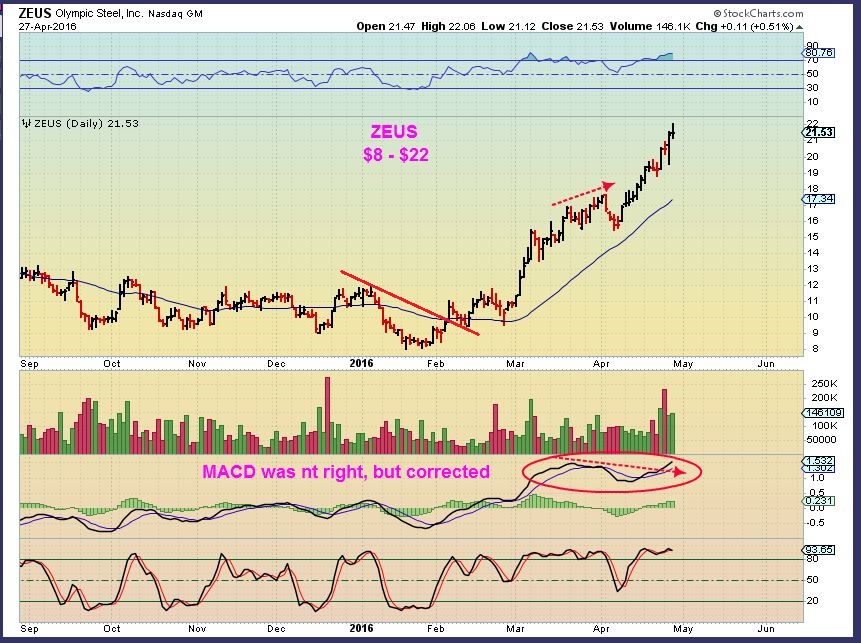
ZEUS – If these Commodities are recovering though, you will see moves like this. Steel stocks like X, ZEUS, etc have done extremely well. This is almost a triple in 3 months.
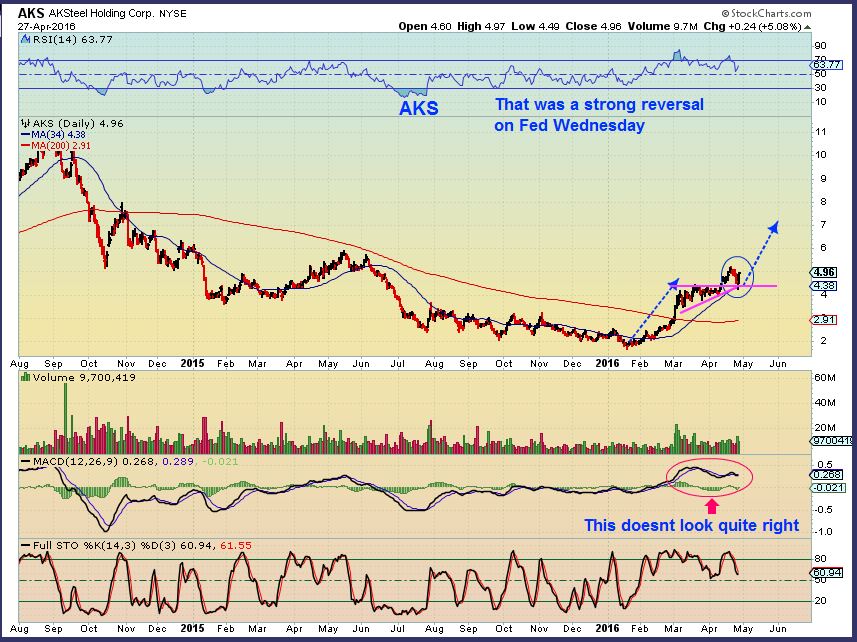
AKS – This is a steel stock that tripled too. It had a strong reversal Tuesday and again on Fed Wednesday. The MACD needs work due to the consolidation. This was a buy Tuesday and Wednesday, but also could still be bought right here with a stop below support. Maybe it will continue sideways for a bit longer to improve that MACD. Then a dip could be bought also.
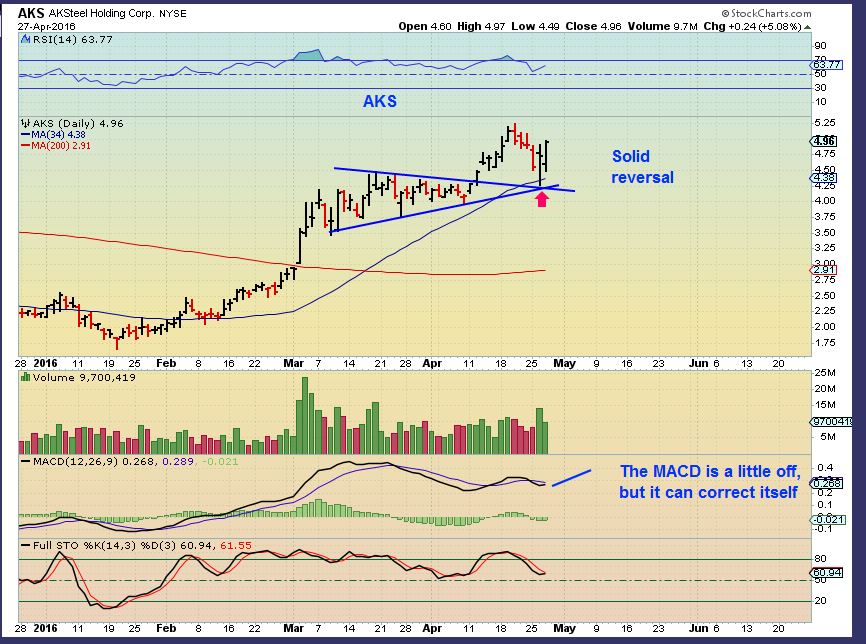
The potential for AKS as commodities recover is big. Once it gets going, you could just trail it with a stop. Again, the lesson here is that they didn’t fall straight down, and they may not run straight up, expect a little volatility .
TRADE SET UPS
.
OIL and the CRB are moving higher. Stocks in those sectors are making great gains. We need to Make Hay While The Sun Shines.  I dont want to overwhelm you, but readers here want choices. They dont want 2 stock picks, they want 10 set ups to choose from. you SHOULD NOT buy all of these. They are all good set ups, choose according to your style. Some like higher priced above $10, Others like lower priced with good potential, etc .
.
Below are trade set ups that look like they may join the race. Some have felt as though they have missed the move when they didn’t buy LGCY, BCEI, BTE, SN, SWN, SM,OAS, MRO, etc when recommended here. Some have said that they dont want to chase now that some prices look a bit extended, so I wanted to look for some set ups that may be just preparing for a break out.
.
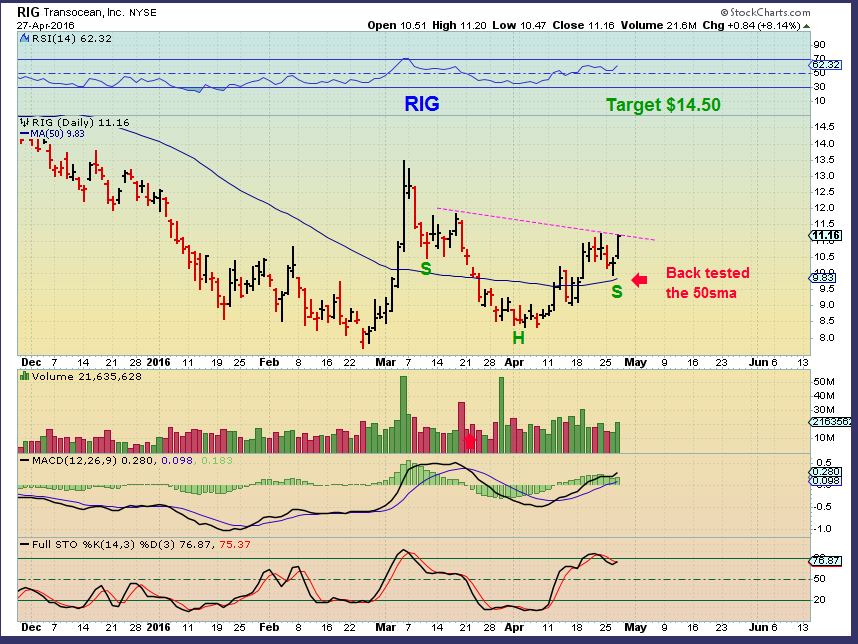
RIG – I recommended this a week ago, breaking above the 50 sma. It looked ready to go! Guess what?…
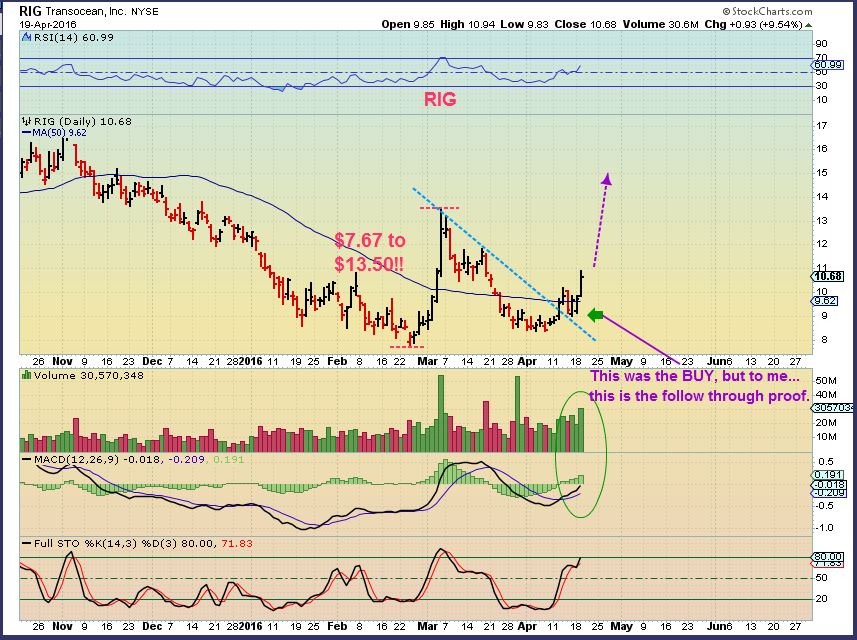
It is running higher, but it stopped and back tested the 50sma and formed a shoulder ( for a more bullish pattern) . This looks good here.
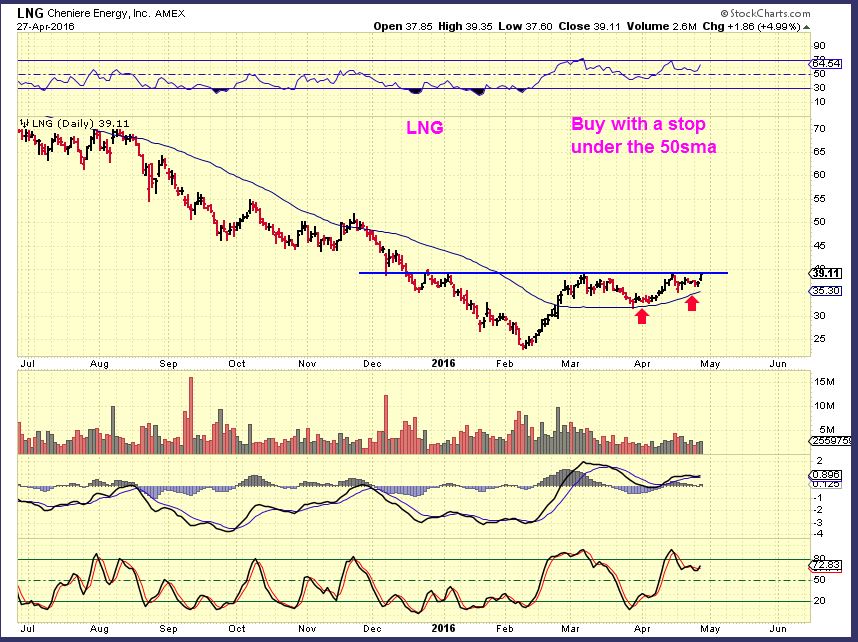
LNG – This looks like it wants to break out, and since the Energy Sector is breaking out, I expect that it finally will. It held above the 50sma, so buy a dip there, or buy the break out if it has strong volume.
.
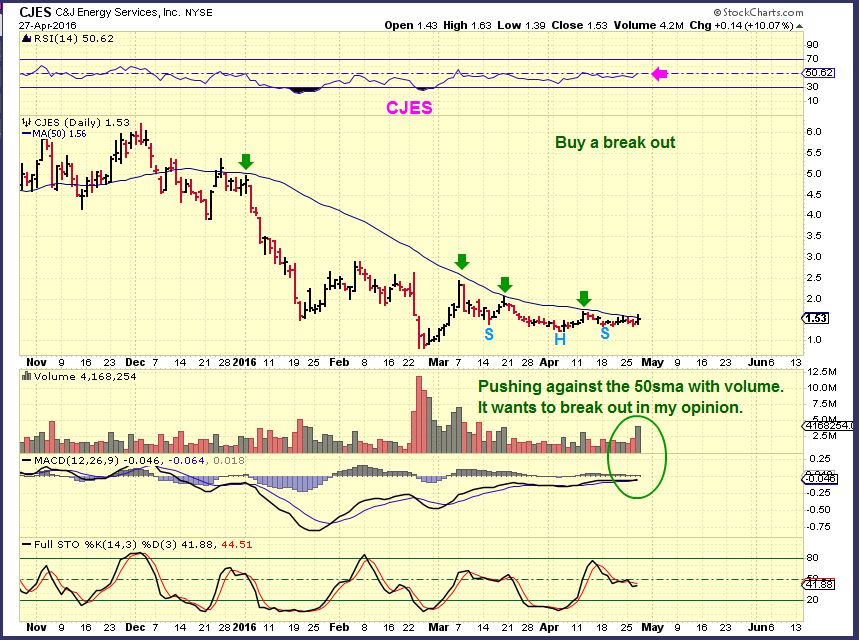
CJES – This is a cheaper company that ran from $1 to $2.50 in March. I love the way it is pushing on the 50sma and being rejected, but now it has been tightening and hugging the line. Volume came in today and it broke the 50sma. I think it could break out as soon as Thursday. It would Not take much to run from $1.50 to $3.
.
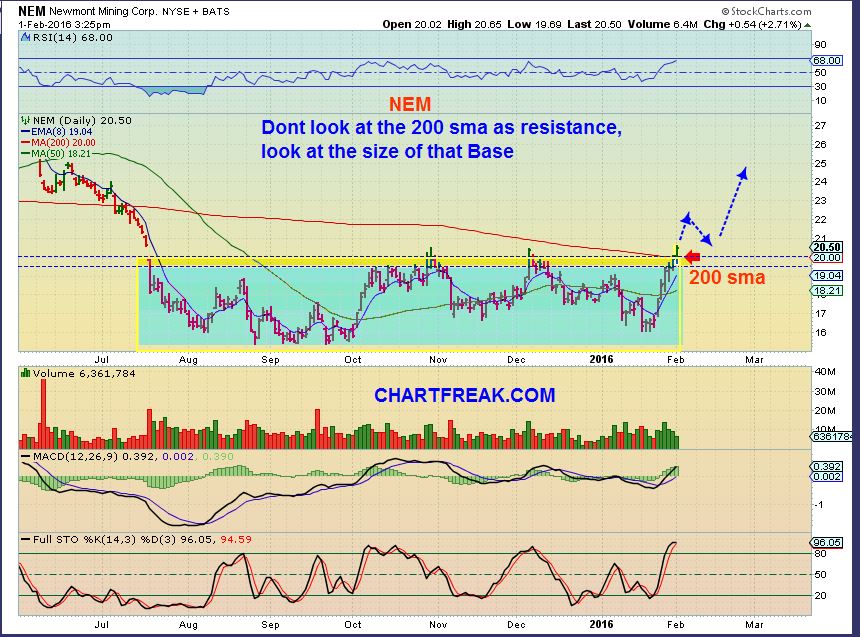
If you have been here for a while, then you know that certain bases can be explosive. I repeatedly pointed out this base in ABX & NEM.
NEM – I KNEW this could get explosive, so I said to ignore resistance, this would fly.
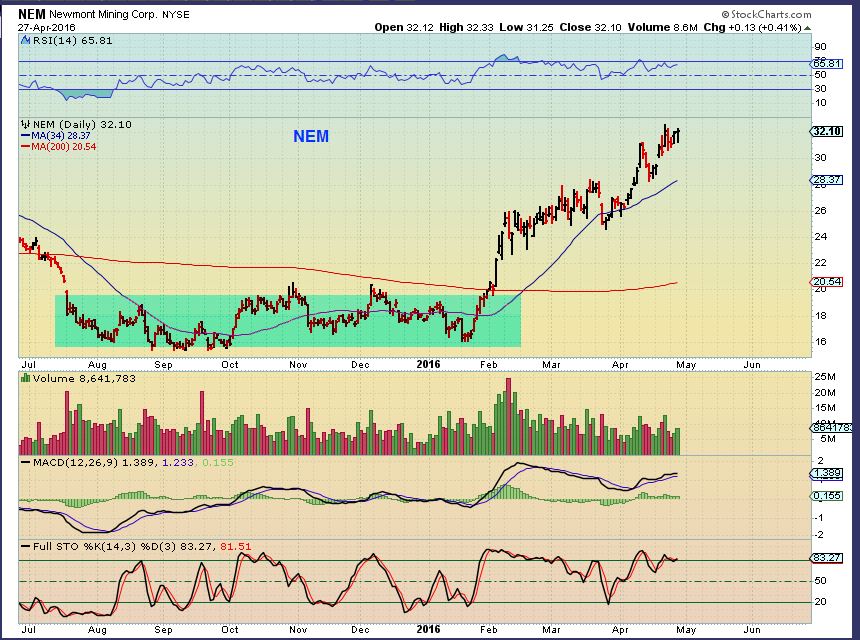
NEM now – Beautiful run.
.
SO NOTICE THIS …
.
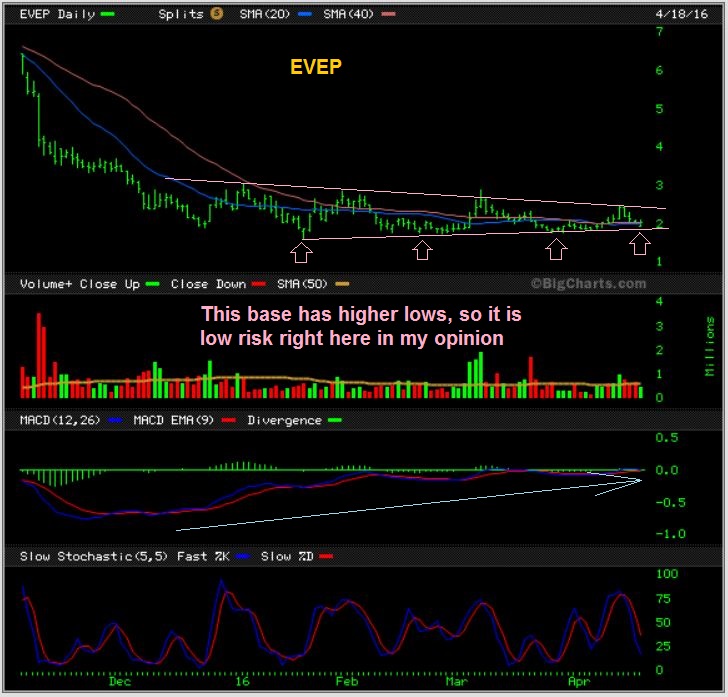
I recommended EVEP at $2.00 as a low risk buy and a nice base with higher lows.
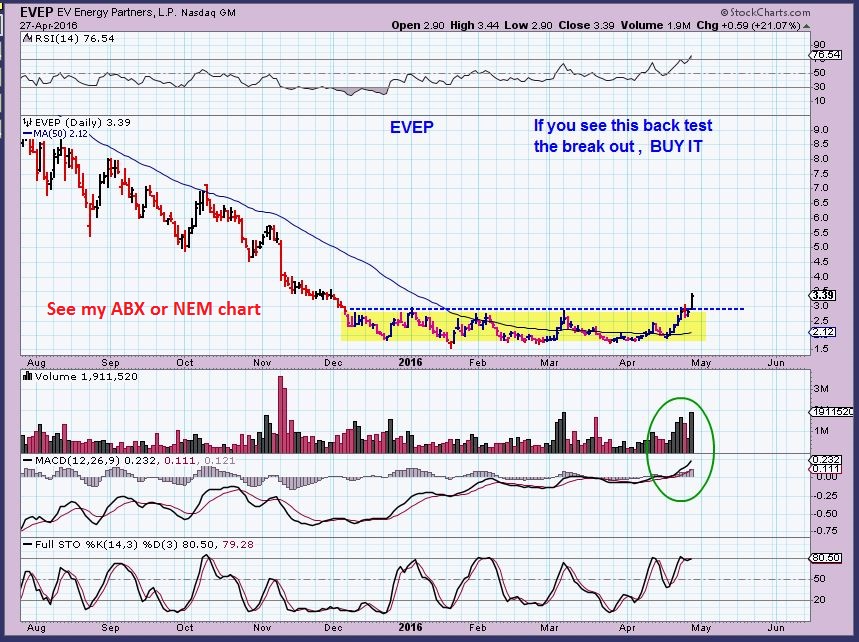
EVEP – Yes, It is $1 higher than last week, but I dont think that this is chasing it at all. i think that this could run very well from here. I say Buy this break out, or especially if it pulls back Thursday.
.
With that in Mind…
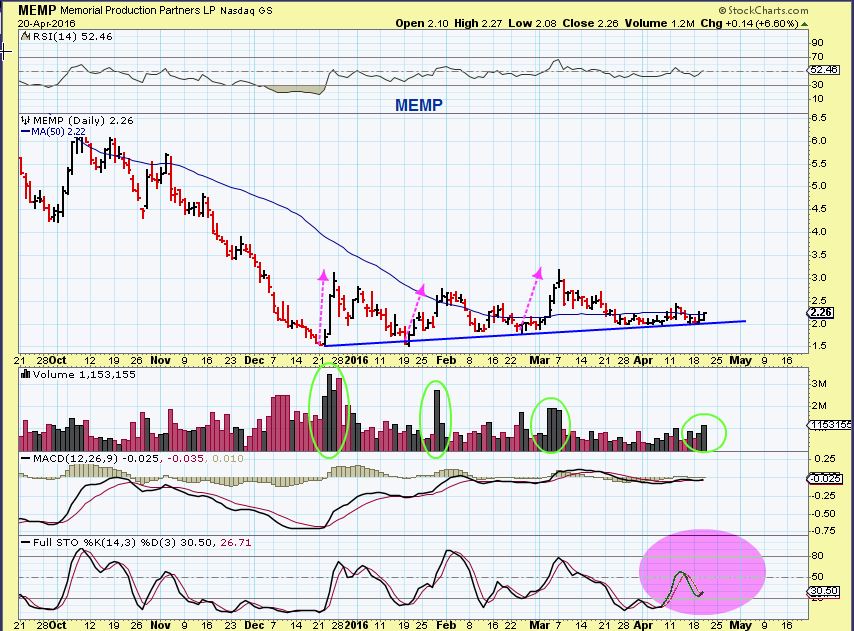
MEMP April 21 – I recommended this one at $2.26 as low risk too. It also has a nice base making higher lows.
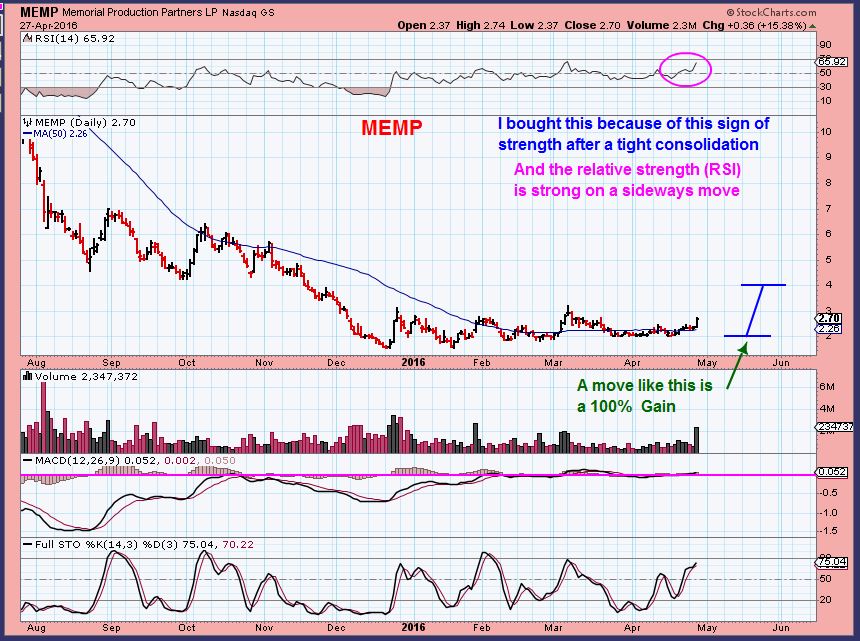
MEMP NOW – It Popped 16% Wednesday with above average volume, but it is NOT chasing this if one bought it now. I see it as confirmation that the set up was valid. Might it still be trapped inside a base? yes, but if you wait for a base break out, you’ll buy it at $3.50. I like it here above the 50sma with a modest position. I may add on the break out if it looks like a LGCY run is coming 🙂
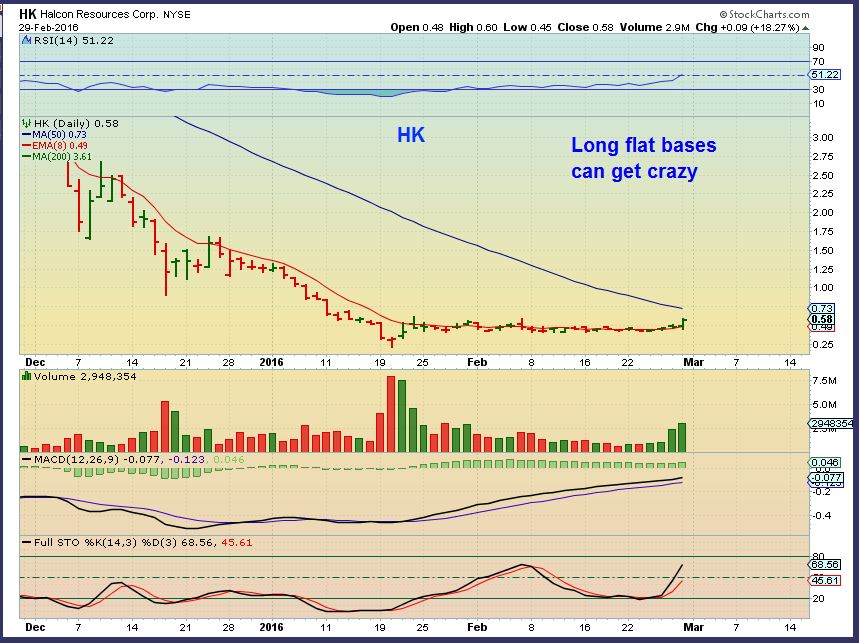
HK – I recommended this break out in HK at the $1.10 – $1.13 area. Did it just take off and fly?
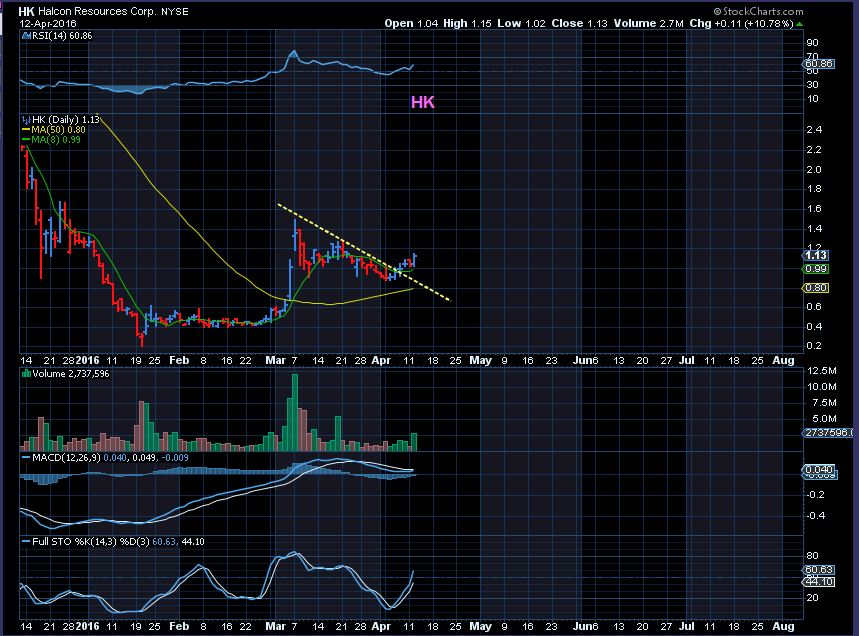
HK – It consolidated and waited for Oil to break out? Now we see a base on base set up.
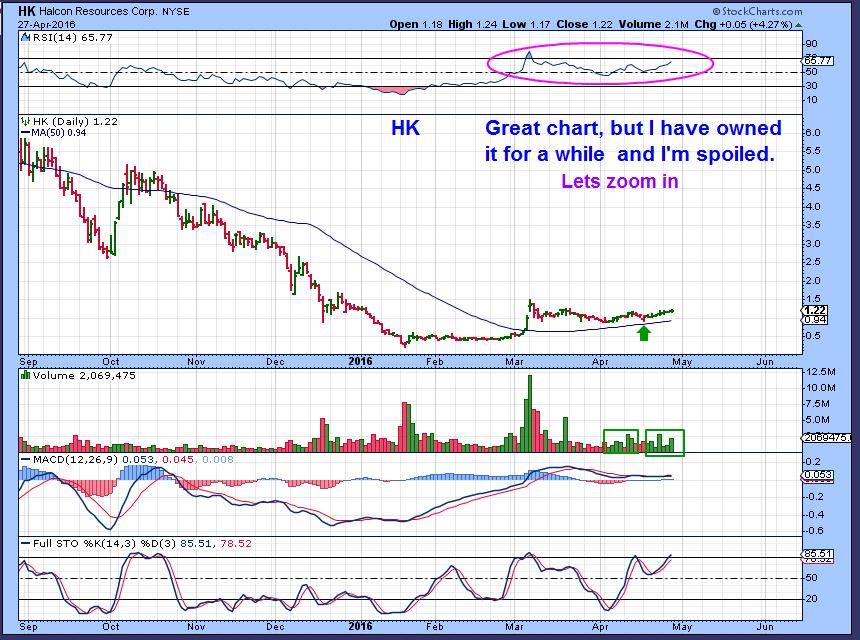
HK- If you look at it like this, that first break out was really big, so I expected this one to be too. I own this, but I’m tired of the consolidation. This sideways move is actually really good for building energy, but I’m tired of waiting for it. I will still hold it and wait for the expected run higher. 🙂
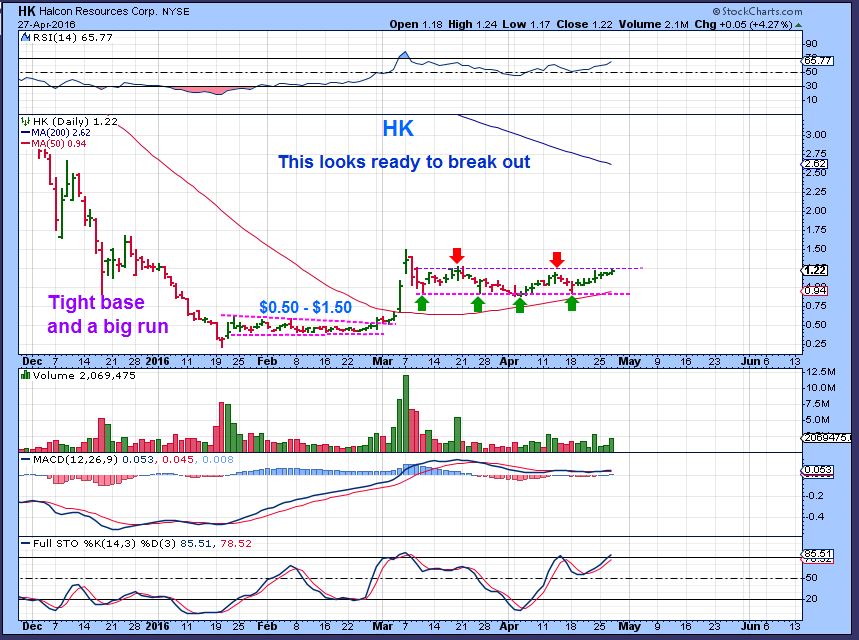
In Feb, HK ran to $1.50 out of this base and I caught that one. I want to stick around and catch this one too.
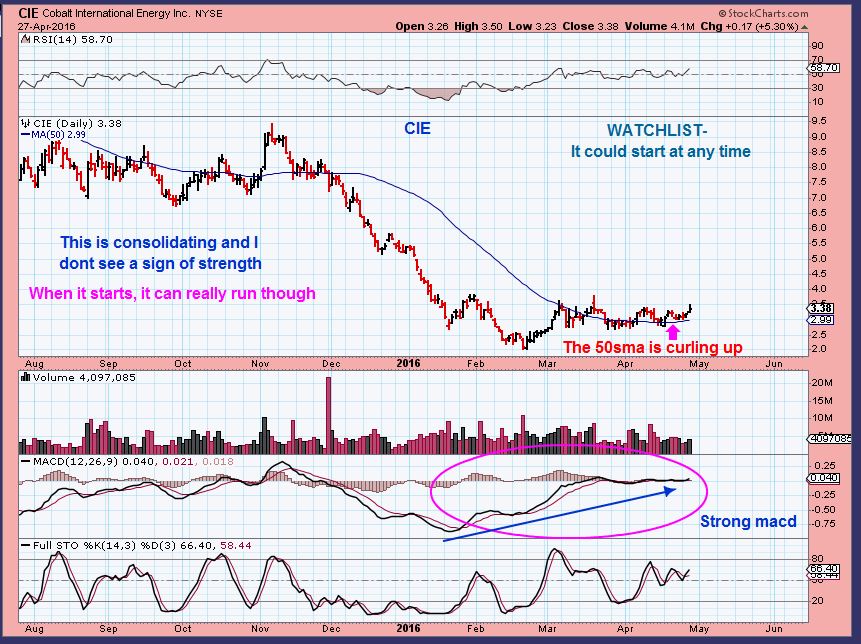
CIE – I recommended this before and it is still the same price. It has gone sideways . Please Read the chart.Wait for stronger volume and price moving higher.
.
I had a few more set ups, but these are good enough for now. Trading has been great lately, and I think that it will continue. If the Sun is shining in the Energy or Commodity sector, now’s the time to make hay. That DOESN’T mean that every day will be an up day in Oil or our stock picks. We could get a small pull back today that may even allow a better entry on some of the stocks shown. Stocks Run higher, consolidate, they breath, they ebb and flow. Enjoy the stress of trading, and when the Sun is shining, Make Hay! 🙂


been patient and missed some stocks that popped but something tells me a little pullback will be a great opportunity to load the boat to make some chedda! Thanks Alex!
Hey Moe,
I really want a pullback in LGCY , but I dont know if it’ll pull back for a day or a week after that move. 🙂
I dont know why, but I thought you were in WG . It shot up 22% yesterday.
I got out of WG last week but made some good gains. They could have been better but all is good. I almost bought into LGCY but I am sure it would have tanked soon as I bought 🙂 There will always be a good deal and I am learning patience. I did have to wait for funds to clear and just watched on the sidelines. Yes, I am watching LGCY very closely and would hate to miss out just to get in on the dip. I am sure they will shoot to the moon before announcing numbers and then sky rocket after they announce. On a different note, at least EXTR (Extreme Networks where I work) had good numbers after close yesterday and went up 10%. That was our weakest quarter but we did really good and this current quarter is typically our best and so far mgmt has eluded to things going very well. Let’s see.
Yes, The chart on EXTR actually looks pretty good after that sideways consolidation. It broke the downtrend line from Dec highs.
Let’s make some money today!
G-Morning Eddy,
It’s been so good trading lately that a down day feels ‘wrong’ : )
as does a stock that ONLY gains 12% … sheesh we are spoiled ;o)
ps. make hay … ahhh .. good memories. :o) I could have offered u this pic…
Perfect , I love the black and white classics. Even Lassie made the cut 🙂
which one is you M?
Am I seeing that wrong or did the NIKKIE just fall off a cliff ?
I’m showing that it dropped 1,160 points !
How will that effect SPX?
Markets in Japan look to be down 5%
BOJ held pay instead of more easing. We want easy money! But it tanked the $$ with rapidly rising Yen.
Doesnt look like a pull back in CLF or VALE (so far) today.
I see CLF up another 46 cents or 10 % in premarket , and Vale up 6%
MEMP up 10% ,
VALE and CLF both massively surprised to the upside in their earnings reports. I’m going to guess that institutional money is going to start flowing in very heavily now. CLF was projected at a -0.29 and turned a 0.62 profit… unreal how people who make their living tracking a company can be so wrong.
When I look at the longer term charts, these have so much upside potential, that it looks like core positions could be valuable too. One could just occasionally raise stops under the 50sma as it rises.
Vales report was nice.
Wow, didn’t realize it was that big, thanks for sharing Dave.
I hope EVEP’s suspension of its dividend doesn’t hurt its breakout too badly… That’s been the kiss of death for most other oil & gas limited partnerships.
It could become the perfect back test 🙂 Once the news settles in, buyers can say , They are cutting costs, that’ll show up in earnings next time.
Got too cute with EVEP and missed limit by 0.02…lesson learned. Oh well..nice call on your part Alex!
These are all acting correctly now. MEMP, HK, EVEP, CJES, ( Just about every stock in todays report ) have good volume this morning and starting to take off after a slow start. I love that. .
I still own BCEI and BTE which will not stop going up.
CLF & VALE and even HBM look good with string volume. etc.
Alex, on CIE could you explain your comment “I don’t see a sign of strength”–RSI just turned up, stock also and macd sloping up. Is it the lack of vol. or something else that you would like to see? Thx!
Yes, lack of volume to me shows a lack of interest . It doesn’t mean that the stock cant go higher or meander along in a stairway higher, but after a good sell off, I like to see good buying or short covering too.
Dear Alex, another winning strike 100% in AREX (bought $1.48 yesterday closing price $2.99). I din’t buy huge positions in any of the recent trades. All i just started a starter position. Also, PACD shoot up another 45%.
Your call for re-entry on CLF and VALE also amazing. I got small position in CLF around $3.83.
Really i am seeing … Alex dedication … hardwork on top of that passion for trading.
G-Morning Siva,
Nice trades. It has been a good field to make hay in. Catching the recovery in Oil right at the $26 Oil mark has really paid off. I’ve missed some of the last leg higher in some of the Gold & Silver miners, but the Energy / Commodity trades have more than made up for it.
Glad you are doing well!
Nice work, man. I got CLF but more of a 3/4 position than full, went lighter than I meant to. Check it out in pre-market..!
hi A.. whats the CF take on TRCH?
just been reading a Bob Moriarty recommendation at 321.
looks like a decent set-up to my eyes, when applying the lessons learned here
Looks good as a base, I see no compelling reason to buy at this point, but I consider those good ones for the watch list.
If you have a stock that runs strongly and gets overheated, and then that one starts moving, you can rotate your crop to fresher soil. Sell the extended one and buy the one just starting to climb. ( I have that farming theme in my mind).
Dennis? Dennis? Anyone heard from Mr. Gartman?
Earnings today CLF, VALE and HBM after market. CLF was supposed to be 10 am but it is flying already.
Hi Nancy
Check this link out
http://www.marketwatch.com/story/cliffs-natural-resources-inc-reports-first-quarter-2016-results-2016-04-28?siteid=bigcharts&dist=bigcharts
Good read, thanks Alex…seems they have good leadership.
VALE also reported last night (beat on earnings and rev)..HBM is tonight
Cason, you see SRPT today? What is with that stock?
there is some article suggesting that the approval is possible. So it surged 20%
CLF is …..GONE !
4 million shares in the first 5 minutes??? Funds must be LOADING UP
Mixed bag this morning. The commodities you recommended all looking good. CLF, AA, X, FCX
And the energy stocks. They have good volume for the first 1/2 hr. see my above list / post
AREX and LGCY way above the 200sma, may start flagging here. Many others are green, maybe time for them to catch up.
What do you think a good spot is to enter LGCY? Good bout of profit taking today
Not here for me. It may flag, may drop a bit. I see the 200sma causing pullback. Same thing with AREX. HBM still holding up, its well over the 200sma as well.
These are all acting correctly now. MEMP, HK, EVEP, CJES, ( Just
about every stock in todays report ) have good volume this morning and
starting to take off after a slow start. I love that. .
I still own BCEI and BTE which will not stop going up.
CLF & VALE and even HBM look good with string volume. etc.
This is another very good day .
jeez.. must be a good day.
even BAS is back in the 2.90s
And HK… I feel like I was sitting in that forever, but really that 3 month chart now looks pretty good.
( We A-R-E getting spoiled S.O.G.)
wooo.. go HK! 🙂
Yes, so glad I held my HK! 🙂
always seemed to be rising nicely.
just that day, on the 18th, …got stopped out, but got back in again sharpish
CJES – In the report, has now broken above that 50sma that I was pointing out. It has 1/2 million volume in the first 1/2 hr.
Some of that volume was me. 🙂
Which one : ) Some of the volume was me too on the dips.
CJES
Still watching CLNE also to see if it wakes up.
Bte Alex, looks like CLNE is recovering that 50 day today. Back in I go!!
Dear Alex, today i was so funny… without reading the article..
started with comments section. Later i saw your suggestions (EVEP & CJES).
Just miss the lower prices, I just get in CJES ($1.53), EVEP (@3.38) also LABU @32.05
Couple of stocks not at all performing CRK (no loss), WRES (underwater 10%)..
That is funny, you went right for the live talk in the comments 🙂
Alex, what do you think of SDLP? I found it last night when researching and wanted to buy this morning..but waited…..now it’s up 6% – do you think it’s still a good buy?
Looks like it wants to run to $10 actually
I wonder if $100 NUGT is the magic number that sends the miners into a correction?
wow more than 500% gain from the lows ($17)
NUGT hit $101 Today, we’ll see.
It appears as though no one told GOLD about cycles (this time).
: ) Crazy strong runs.
I look at some of those Silver stocks and other than a little side trading, I missed the 2nd 1/2 of some of those moves due to cycles, expecting a dip too soon.
Look at a chart of AG or GPL. Using T/A those were perfect Mid point triangles , and they played out perfectly.
TGD – I caught that one and a few others in trades , because I figured why stop trading them when they are still working?
If I didnt have the Energy Markets or Commodities running, I’d be a little bit sadder about that.
I figured what I, potential, lost in gains while in miners, I definitely saved in gut lining, while waiting for a correction or riding the waves. In any event I have really enjoyed spinning your Hay (aka energy/commodities) into another type of “gold.” Thanks Alex
a backtest of the d/t in UNG?
also seems to be supported by the 34sma
hope these hold.. am still in this from the 6.60s.
[refreshez vous]
CJES is up 12%. those who follow Alex’s suggestion will have nice ride (low risk)
And breaking the 50sma with a surge of volume. I bought it yesterday , and added this morning.
Alex, at what point do you start taking gains on CLF? I’m ecstatic I got on for the ride but this won’t go up forever.
By the way, thank you for your comment on my CLF observation the other day. I mentioned that a turn looked close as CLF bounced off the 20 SMA area and was in a favorable position in the 5 Day RSI channel. Your positive input helped give me the confidence to take a starter position, to which I added yesterday.
Thank you. This CLF lesson will be one I won’t forget as it shows I’m actually starting to get some competence in trading. That’s something I’ve had huge struggles with in the past. : )
CLF is up 30% on MONSTER VOLUME. after earnings release…
That has me thinking that FUNDS want in and they want in badly. When funds buy, they cant jump in all at once, so we may have seen some fund buying on the first run, then the pause, now another surge. They may step in a few more times as time goes on. If Commodities are recovering, or entering a bull market, it could become just a buy & hold, since it might even recover former highs in time.
SO pull yourself up a 3 year weekly chart (Refresh) and decide where you’d like to get out 🙂
.
Volume on CLF is off the chart today!!!!!!
Thanks so much Alex!
CLF… you know how happy I am :))))))))
GDXJ is putting in a MAJOR weekly breakout here
Looks like it’s headed to next resistance at 240-250
What do you mean by 240-250 Carl???
Sorry was referring to HUI
lol- I was going to mortgage the house, Carl …and go all in . I want to ride GDXJ to 250!!! ; )
Ahh got it! You had lost me there.. I’ll post you a chart of what I’m seeing in GDXJ.
$SBLK breaking out now for next leg up
Drys broke today as well
Yes you are right. Several shippers have been acting perky. Shippers are risky but prices were insanely depressed. My thesis is that traders may rotate into shippers after taking profits in miners and energy.
Don’t forget Uranium
Dear friends, it’s very painful to see DUST go down, down and down.
Most time when I sell now DUST (or what else will go up, in this case??)
Don’t know what to do.
Take a pain killer?
Thanks all for your response.
i dunno Geurt.. i dont trade the 3x.
how much pain are you in?
perhaps get out now and jump into some energy/commodities, and then NUGT when corrective reversal in PMs is confirmed.
A lot of rookies trade them. I did when I was new to this. B/c you are low equity so you can’t get the juice you need without the leverage. But you suck. So you lose all of your money and cry about it in the dark. Criminal.
Been there…done that. Big time OUCH!
Yeah, looks like the exit was yesterday, but no one knew that until BOJ threw a curveball over night. We broke to new highs in GDX/J today. Sometimes they ‘throwover’ before correcting. UNLESS Alex thinks this is a top AND we gap miners down tomorrow below today’s new high, we would be left with no choice but to exit the position. Sorry mate.
If we ever get a low in miners, we’ll make it up long without NUGT.
Hey, I posted on LABU/IBB last night for you – did you get a chance to see. This AM ended up being the buy.
Nope… now I see it.
Thanks Cason for your inspiration.
Sleep well.
EVEP suspended cash distributions today, in order to continue repurchasing their own shares. If I’m reading this correctly. Two weeks ahead of their next earnings release. For comparison, LGCY suspended their cash distributions on Jan 21, 2016.
My instinct reads this as all very bullish, but who knows.
I think they are repurchasing debt at a steep discount, not shares. Seems to be the event du jour for a lot of these companies now. The bought back 72.9 million of outstanding Senior Notes for 30.1 million, nice story but they are still wallowing in debt.
Watching the USD index closely. If it turns back up here, the party could be over for a few days or so. Right now it is lower than it has been for a year except for the April 11 low. (I watch UUP and DXY as a proxy for the USD index as you can see the intra-day action.
UUP just hit a low it has not seen since January 2015. That will start to make a difference for us Canadians that are forced to pay for our holidays in USD anyhow!
Alex, some of these energy stocks are giving back. Is it time to cycle?
BBG completely came down and closed the gap and seems to be consolidating
For those following shippers I am looking at chart for $FRO. I see symmetry between current chart and late 2014. Am I delusional or does chart look potentially explosive again?
Very interesting – Alan how would it look if and when, (and its a monster if) US Equities were to turn down at some point?
Well if US Equities turn down that could defeat the pattern. Right now I am watching to see if it holds the 50dma for a couple of days (It’s right on it now). If so, I’m in.
HK!!!!
Yes, Finally. I have had it for weeks. Waiting for the break from the Bull Flag.
possiblity of a cup&handle at the double top before break out?..
WTF happened HK?!
EVEP cr@pping on my green day
I think the sun just set.
I have that sinking feeling here as well.
my day went from green to very red.
Check out WPX daily. At least before 2 PM.
Sorry man, I still eeked out a win today. 🙂
am still up for the week (so far!).. but gave back about 2/3… trying to let my ‘winners run’
good day to add to your NGD position. My fav miners.
BAA what’s up baby!
SP500 rolling over at the upper trend line. Doesn’t look good.
Watch 2075. Big guys are. 🙂
Damn…. I’ve been in labu for a week here, have had no good luck. Wish I kept my clf at 3$. I had also had it at 1.40 in jan, coulda woulda shoulda… I was brand new to market in Jan 7.
Jeff, quick word of wisdom. Stay away from x3 ETF.. (above all if you’re new). these vehicles will wipe out your acct.
Time decay is big issue, working against you.
***
Leveraged ETFs require the use of financial engineering techniques, including the use of equity swaps, derivatives and rebalancing, and re-indexing
to achieve the desired return. The most common way to construct leveraged ETFs is by trading futures contracts.
The rebalancing and re-indexing of leveraged ETFs may have considerable costs when markets are volatile. The rebalancing problem is that
the fund manager incurs trading losses because he needs to buy when the index goes up and sell when the index goes down in order to maintain a
fixed leverage ratio. A 2.5% daily change in the index will for example reduce value of a -2x bear fund by about 0.18% per day, which means that
about a third of the fund may be wasted in trading losses within a year (1-(1-0.18%)252=36.5%).
The re-indexing problem of leveraged ETFs stems from the arithmetic effect of volatility of the underlying index. Take, for example, an index that begins
at 100 and a 2X fund based on that index that also starts at 100. In a first trading period (for example, a day), the index rises 10% to 110. The 2X fund
will then rise 20% to 120. The index then drops back to 100 (a drop of 9.09%), so that it is now even. The drop in the 2X fund will be 18.18% (2*9.09).
But 18.18% of 120 is 21.82. This puts the value of the 2X fund at 98.18. Even though the index is unchanged after two trading periods, an investor in
the 2X fund would have lost 1.82%. This decline in value can be even greater for inverse funds (leveraged funds with negative multipliers such
as -1, -2, or -3). It always occurs when the change in value of the underlying index changes direction. And the decay in value increases with volatility
of the underlying index.
I’m glad somebody gets it. The math scares away many newbies on ST. But I’m cool with math.
yeah but let’s face it, basic math matters in trading :)-
3xetf are for day trades only, short swings maybe, with a strong trend.
Too many ways to get wiped out.
Oh, I get it for sure. I suffered some intense drawdown before I really got my rules straight. Now all I have to do is follow them more often. 😛
I got killed some years ago in 3x ETFs! Never again. Your explanation is amazing…and makes me sure I won’t play with them again!
Look for long base (Alex points them out every week) in stage 1 (accumulation) and buy the stock close close to 10 Mov Ave. The 20MA is fine. Respect the trend. (up if you’re long). Be patience with your trade. Brand new to the stock market is exciting but the learning curve is long and painful. Don’t be fooled by early successes. You will cry, rage and be disgusted at times. But you will also experience fun, joy, and green $$$.
keep learning. Ready ‘Superstocks” from Jesse Stine. Smart book, smart investor.
Great to hear someone mention stage analysis! One of the best books you will ever read is Stan Weinstein’s “Secrets to Profiting in Bull and Bear markets”. Highly recommend it for anyone interested in learning how to stay on the “right side” of the trend. Another great one is Vic Sperandeo. Those would be my 2 top books to recommend for people starting out. They will keep you from losing A LOT of money! Wished I had read both before I blew up my first account.
Nice Peter! Here’s the best tool I’ve found in years http://screener.nextbigtrade.com/#/markets
I follow Justin on twitter! I think that stagescreener tool is phenomenal!!! I actually picked up the book by Weinstein because he recommended it! Good to hear you follow his work also.
Ditto!!
Energy. I try to never count my chickens before they hatch. Ugly @$$ candles everywhere. BUT… one candle does not mean much by itself. Let’s see what tomorrow brings.
Anybody have any info on REN–13M shares and all down–can’t be good news? Had tight tight stops so managed to get out with only a nick…but still sad none the less. This one makes up for those tight stops that get you pooched when the pocket gets robbed and takes off without you. Win some…lose some…
holy moly.. thats one mother of a red candle.
I know. I think my ‘hay” days are done. :((
apparently included a single dump of 10 m shares
http://finance.yahoo.com/mb/REN/
Just saw that..any idea what that means?? Seems like a fat finger issue??
from what i can gather from that chat, its a fund owner (SPO Advisory) unloading its shares in one fell swoop
Ouch! Thus why I’m not playing those under $1 anymore. Not in energy at least.
volume is horrible also
Alex, or anyone else, Any thoughts on DNR? Sitting on a small profit now and thinking it has potential to run although earnings coming up and fundamentals are terrible, Had a short term target of $6.50-$7
Many of these look good longer term, and DNR has had a nice run.
It kind of looks to me like it may have completed a second move of the same length as the first.
They then consolidate or pull back and build energy to move higher again if things remain bullish. With earnings coming up, it may pull back a bit
.
refresh for a chart ( 2nd runs the same as first- pardon the error on the chart, I’m hurrying)
.
No problem, thanks for the response. I understand the “measured move” practice, I held a position through the recent breakout the other day, hoping it would run a bit but now thinking after reversal today on big volume, it may be quite drawdown .to earnings and it’ll be a loss if it drops much more so may sell and try and enter on a pullback. Depends on how it acts in the AM I guess.
I like it. Haven’t charted recently. I stopped out back in Feb at $2.2 so you can imagine how crappy it feels when it hit $4.5, been running well.
For anyone interested in stage analysis, this is it http://screener.nextbigtrade.com/#/markets
The thing with stage analysis is that it is not a *trading* system. That is one of the reasons I struggle personally with doing things Alex’s way, because it is trading around cycles and other things, where as Weinstein is very cut and dry: break above the 30 week, you buy and hold, or buy on a retest if/when it happens. Below the 30 week, you’re out. I still think it is about the best way to play, because you slow down the action enough that it gives you a better chance to profit. You just have to let your positions run. I was comfortable with stage analysis. I am trying Alex’s methods because in all honesty, he is great at spotting turns. His system works equally well. But it all comes down to how much can you be hands on trading in&out of positions. For newer investors, I would definately use weekly charts for major trend identification. STAYING WITH THE TREND has been a VERY expensive lesson for me to learn. I take Weinstein a step further though. A break of the 50 week sma, with no other ma support below, signifies a bear market. No need to play the up side in a bear mkt. And the opposite is true on the upside. A break of the 50 week up, signifies a bull mkt. No need to short a bull, rather hold, and add on pullbacks. This is where miners are right now. And as a sector, I believe the miners are about the only ones in this position. Wonder why they’re so strong??? XLE is breaking above its 50 week this week (so far), after basing as well. Let’s see if energy CAN break and stay above that ma. This was long, but maybe worth a read for newer investors.
Just a brief thought-
I studied His work years ago. I found it kind of obvious, but interesting and good. I use the 10 & 30 as gauges for the weekly ( And the 50 as you mentioned, but basically that is just saying that the 200sma on a daily is there. ) . These , to me, were obvious lines in the sand.
I use it in my work on weeklies, it validates strength, but you have to admit… there can be a lot of false starts and sideways move after that break. that is because you missed the meat of the moves off of the lows and it is extended, resting, consolidating. Getting above the 200sma can run and then back test, so your 50 wkly MA often is revisited a month later or so. So taking all of this into consideration. You get and give back gains a lot in a 3 month period of time.
REFRESH – No one here would have been happy with this buy signal if I told them to buy and sit in the up & Down for 7 weeks. .
By the way CLF, AA, CENX, VALE , HBM etc are all above 30ma wklyv They look pretty sweet.
With what I do, I use more than cycles, sentiment, A moving average , etc. I use a combo of everything that I have found useful and some that is only useful in situations.
BY the way – I’m not knocking Weinstein in any way. So I do find value in his ways, I do use the basics, but it has to be mixed with other technique or it can be less fruitful in the short term..
ABSOLUTELY!
Aha!!! And that, my friend, is why I cheat Weinstein a bit. Thats why I like the 10 week sma to start a position, maybe even the 20. And track it as it progresses. I have found that you can tweek that by paying attention to reversal candles, etc, and ride the weekly trendline until it breaks, and you take profits. Reposition on a break upward of a new downtrend line, follow me? And after a basing period like miners went through, it becomes almost impossible to follow any trendline because the trend is just sideways, frustrating bulls and bears. If thats the case horizontal support/resistance is what I would turn to. But it does help you see more clearly the dominant trend. Helps me at least.
Yes, I use the 10 for a longer term hold.
Wow – I went away from about 2 p.m. onward and everything was running green. Oil is still climbing, but so many of these stocks turned down.
Its odd that it happened right across the board.
Seems about 2:00 the bottom fell out of the market, still a great call on CLF and others though Alex, had some runners for awhile,
Hi Miller
When I left at 2 p.m. Everything was highly green.
HK was at $1.45 and HBM was at $5, etc etc
I just got in and I have a basket of several stocks that were way up, now rather mixed. Some down a bit, others up a bit, but it looks like none really held on to the highs. It was just a little weird that the whole sector would take off higher, Oil went up, and Oil stayed higher as these sold off.
Trying to look around and see if I can make sense of these reversals somehow.
Alex, I think it may have just been market conditions – tech and financials struggled and took S&P down with it. GDP came in way low, BOJ underwhelmed. I’m not surprised folks took a few bucks off the table. The whole market dropped and took energy with it.
Looking at 30 minute chart, it was at 3 pm when the selling pressure started.
So that is my question for the field – some pretty ugly top tails on energy but was that b/c the run is up or just b/c the bottom fell out of the whole market. I wouldn’t be surprised if NAZ, SPY and friends dropped into a short term low here shortly. Crude oil stayed strong. But maybe more defensive is the play???
Nasty reversal candles, BUT, we have seen this in miners a few times already and it climbs the next day, negating the shooting star. Nothing to do but wait to see how the week (and month) close out.
Yes, repeatedly . and because Oil didnt drop, thats what I was thinking too. It’s kind of a wait & see thing
I’ll tell you something though. Running through my charts right now, I’m noticing something that does not look good AT ALL! It has to do with the smaller energy names like HK, CJES, CLNE, etc. Accumulation/Distribution line is pointing SOUTH, straight down. A lot of those names ran strong today, and got rejected to end below the 50 sma. This looks to have been a good sell job by the big $$ to small hands like us. :-/ A/D line doesn’t look bad in other names like AA, RIG.., but seems to be confined to the smaller names. Getting mentally ready for an @$$ kicking tomorrow. We’ll see, but that would make me want to lighten up if the premarket is not too bad. Thankfully i already owned a couple of these, and only bought into CJES in the premarket for 1.55. But whoever bought on the way up, ouch… we’ll see what happens tomorrow. Other names like AA, CNX, they ran strong enough that they needed some rest, so today was not out of the ordinary. Again, seems to be confined to the smaller names.
HBM is another one with diverging A/D…
You mean like this ? Refresh : I see lots of these….It has doubled 🙂
REFRESH : )
And THAT is why you are ChartFreak, and I’m not!! Maybe it doesn’t mean anything, no indicator is 100% fool proof. But I am still preparing mentally for an @$$ whooping tomorrow. You are wiser than me, so I’ll bow and let it play out! 😉
I’m preparing for one too, JUST IN CASE : ) You have to have a plan , right ?
But I will include a chart like that CDE chart will be in my report. What it might do is help us to see that maybe a quick sell/ reversal in a bullish sector, can just lead to a pause. We’ll see.
It might keep us from panicking out to see an example in the past, but stops in place is important ( mental stops too) .
Gotta collect charts- nice chatting !!
…
No rest, I’m doing homework and releasing a report in 15 minutes : )
My readers from cross the waters and West Coast can read it 🙂
,,
….
I LOVED UNDERDOG as a kid : )
Please take this to the new report , released in 5…4…3…2…1
Get some rest big man. Thanks for everything! Tomorrow is another day!
If the oil cycle is still in play, there is still time for these to react positively anyway.
yes, Like Miners did with Gold. Similar thought ( hope) lol
But i dont think thats a true divergence though. In CDE, a/d followed price. In the names i told you, price made new highs and got rejected, while a/d made a lower low.
Look at EXK below . Straight down after EXK made a new high and reversed. It went higher the very next day
Actually I disagree. On that first drop for CDE, it was a new high , reversal, and the AD dropped straight down. The next day was higher
RE is an interesting company. 2 large principle owners w/ ~ 30%
Just as an F.Y.I.-
I left at 2 P.M. and everything was strongly green, I came home and many had reversals.
I decided to take a couple that I have owned for a while ( Weeks) and sell some of all.
For example I have owned BTE in staged . a starter position and added $1 higher.
I sold the starter position in after hr trading. IT MAY STILL GO HIGHER TOMORROW, but I am up enough that the reversal has me lightening up.
To trade in after hrs, I often just put the bid price down and it sells immediately.
SO I’ve had a chance to run through some of my check list of energy –
Look at VOC, KEG, AXAS, GST, GLRI, BWEN, WPX, CWEI, etc etc etc still looking ojk and didnt sell off at the end of the day
MEMP, HK still ok, but did sell off
I bought the EVEP sell off at close, also CJES.
So I have been watching the commodities and copper stocks. (HBM earnings tomorrow a.m.) .
Check out NCQ ( Nova Golds Copper company) 173% increase in resources at one of their projects
profit’s taken, stops triggered,
I’m assuming we’ll be lucky enough to see yet another Friday report. 🙂
LOL – How could I not after the action today Chad 🙂
When will I be able to sleep in past 5 a.m. on Friday : (
*o brother
It’s after 8, Go to bed
no daddy… but but .. but .. im thirsty…
*that’s brief btw
https://uploads.disquscdn.com/images/6526616b03faa735e17f322ff3339b4ba94f2cbbfd6b8218172213a4e3ad576c.gif
Hey Maria, you used to be in W40 didn’t you?
well.. that depends.. do u mean WD40 orrrrrr that *otherGuy ;o)
Wow, after today’s action, I completely forgot tomorrow was friday!!!!!!
You’re too young to be sleeping!!!
HBM – Earnings released and at a quick glance, that sounded really good as far as improving. We’ll have to see what tomorrow brings. 2 quotes from the release
.
First qrtr of 2016 = Over 150% growth in copper production compared to the first quarter of
2015
.
In the first quarter of 2016, operating cash flow before change in
non-cash working capital increased to $71.9 million from $16.9
million in the first quarter of 2015.
.
Doubled revenue? Revenue $ 253,625 3 months of 2016, vs first 3 months of 2015 = $128,713
On the other side of that they missed expectations on top and bottom line so we’ll find out whether this is good/bad news.
Alex, where would you put a stop now? Below the neck line (risk of getting whipsawed) or just watch it??
I’m going to watch it. I’m torn because the weekly chart allows it to drop to $3.50 and not be damaged, but I’m not giving all those gains back.
so if it gaps down and sells off strongly, I’ll have to cut some and watch it. I guess I could always Just jump back in if it whipsaws and reverses higher into the close.
Such a nice 1 yr weekly chart of a recovery if it closes here or higher Friday. Strong volume
Thanks! Have a great night.
Boy….this was a roller coaster thread read! Good news/bad news!
This is from Briefing.com
5:41 pm Hudbay Minerals misses by C$0.04, misses on revs (HBM) :
Reports Q1 (Mar) loss of C$0.07 per share, C$0.04 worse than the Capital IQ Consensus of (C$0.03); revenues rose 97.0% year/year to C$253.6 mln vs the C$286.52 mln Capital IQ Consensus.
The cost reduction initiatives announced on February 24, 2016 are on track to meet Hudbay’s targets for 2016. Based on these efforts and operating results to date, the company expects to meet all of its production, operating and capital cost guidance.
One last thing, I still cant tell what the initial reaction will be, but they do have a live conference call at 10 a.m. Eastern, and you know they will talk up all the strong points , double revenue, Cash on hand, future growth, etc
So IF the initial move is selling off at the open, we may see things reverse as the conference call goes on.
Deshy, Dont let the sun go down on my hay making day all together – lol
I thought they met their goals, what was the expectation? I think the greatly increasing cash flow / cash on hand, revenues being doubled and 150% growth help with the forward looking markets. It sounded like a solid company with growth potential….for a $4 stock .
We’ll see tomorrow, because I can NEVER get a.h. trading or pre mkt trading numbers on HBM for some reason
$0.04 miss on earnings and $33M on rev…hey I got my fingers crossed too..and toes! 🙂
Silver monthly. enjoy (refresh for chart)
That is a thing of beauty
oh hello tall little candle.. 🙂
Bazinga!
PRGN – Paragon Shipping was up over 600+ % today
WOW, I need a few of those, make up for all the dumb mistakes I make, ,hahaha
If I had only put $1 on that.