
READY?
Ready for what? For one thing, we are at another Fed Wednesday. Yes, that’s right, the latest Fed Decision on interest rates is released today, and usually we have to get ready for any possible volatility. This time I dont expect much in the way of a surprise there, but we may want to start getting ready for the trades that the charts are setting up for.
.
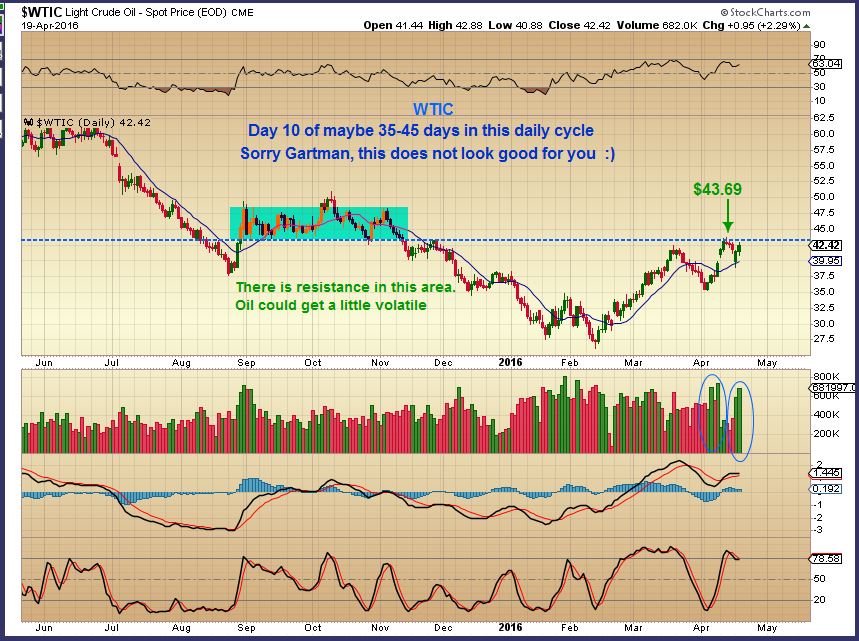
On April 20th I posted this chart of Oil. I’ve been bullish on Oil since the Feb Lows, and it still wanted to go higher. There is a resistance area in blue, but Oil looks like it wants to move to at least the top of that area for now. I listed many Energy / Oil companies that were set up bullishly.
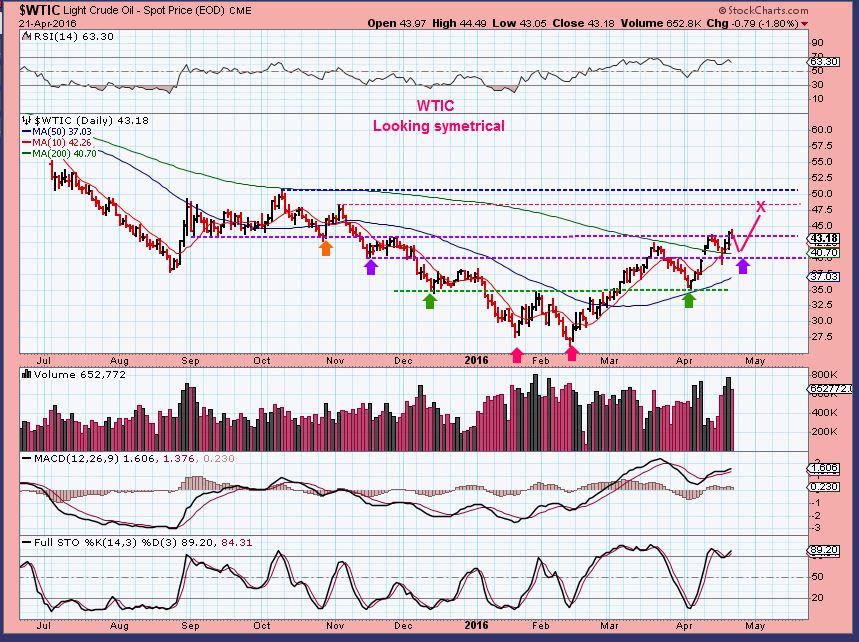
Last Thursday I showed how Oil would have to work its way through resistance, but was still going higher. You can see last Fridays report for a list of Oil/ Energy stocks that were setting up bullishly.
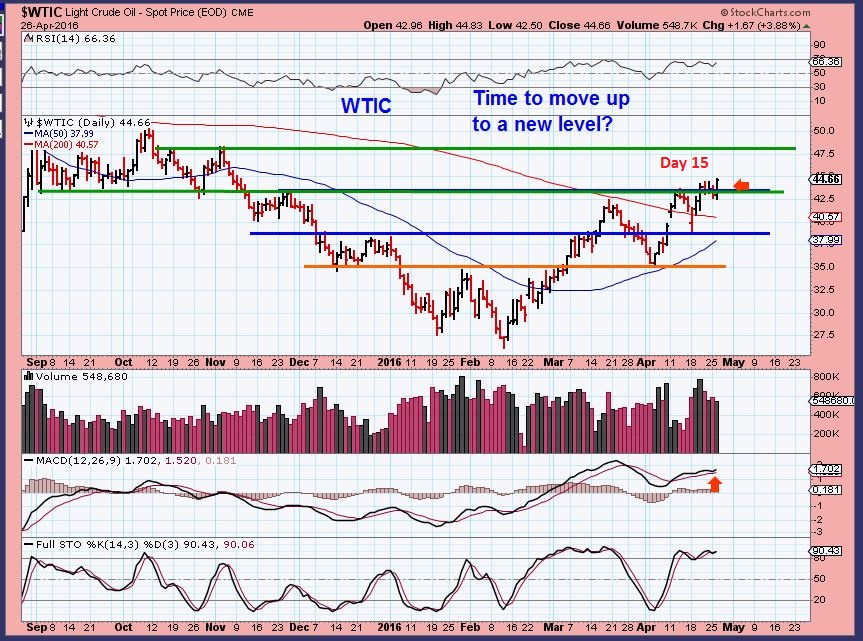
OIL is breaking higher and I think it’ll just run to that next resistance level. We are on day 15 of a daily cycle that can run 40+ days, so I am still bullish on Oil & Energy stocks for a while more.
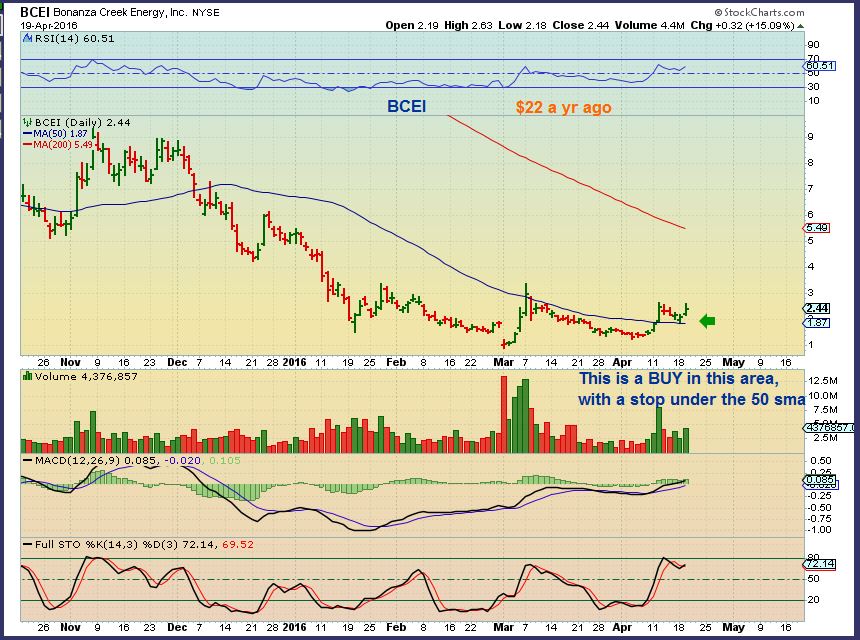
These links are to last Thursdays report and the Friday before that. They had quite a few Energy stocks / Charts at the end of them. You may want to check skim it for a couple of Energy charts and see if they may still be valid by set ups. Some have POPPED and Pulled back ready to buy again. Other trades are still valid. The list included OAS, MRO, SWN, SN, SM, etc. The LGCY trade obviously exploded and is a bit more risky at this point, but I still like BCEI and BTE longer term , for example.
.
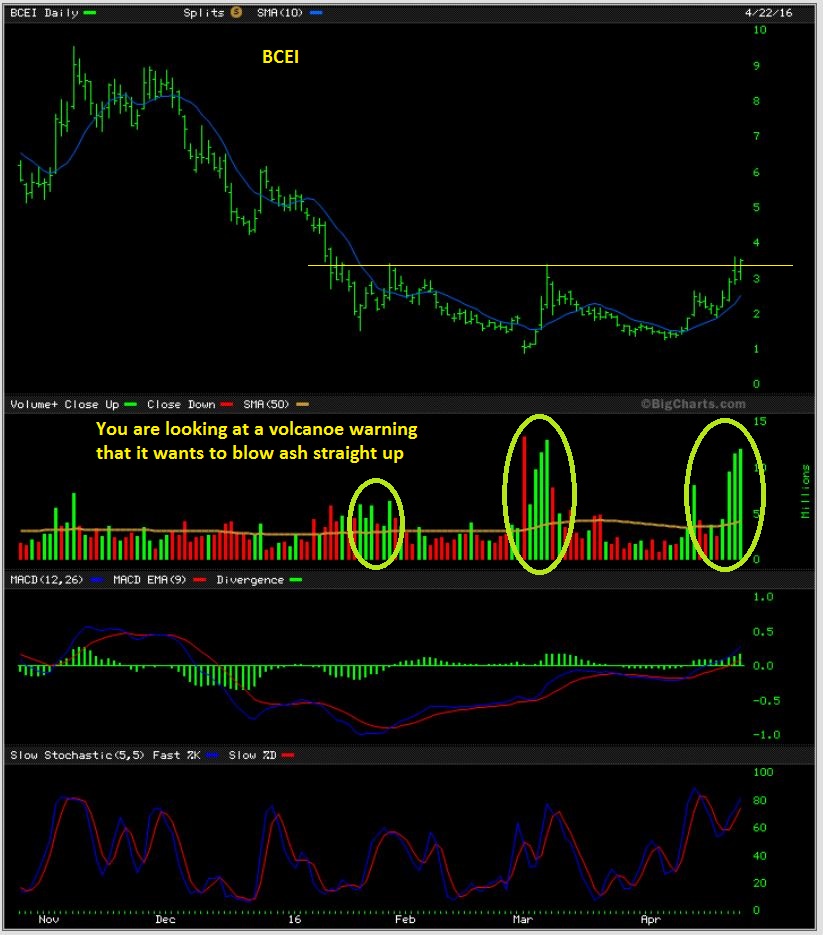
BCEI – For example, this chart was from April 19. I still like it, but it has run to $3.72 . If it pulls back, its a buy. On a weekly chart, I still think it could run to $5 quickly and even $9, but earnings are to be released on MAY 9th, so we keep that in mind..
.
BCEI – This is a solid base so far. This chart shows that it could run back to to $9 over time, IF the company recovers. Earnings May 9th.
.
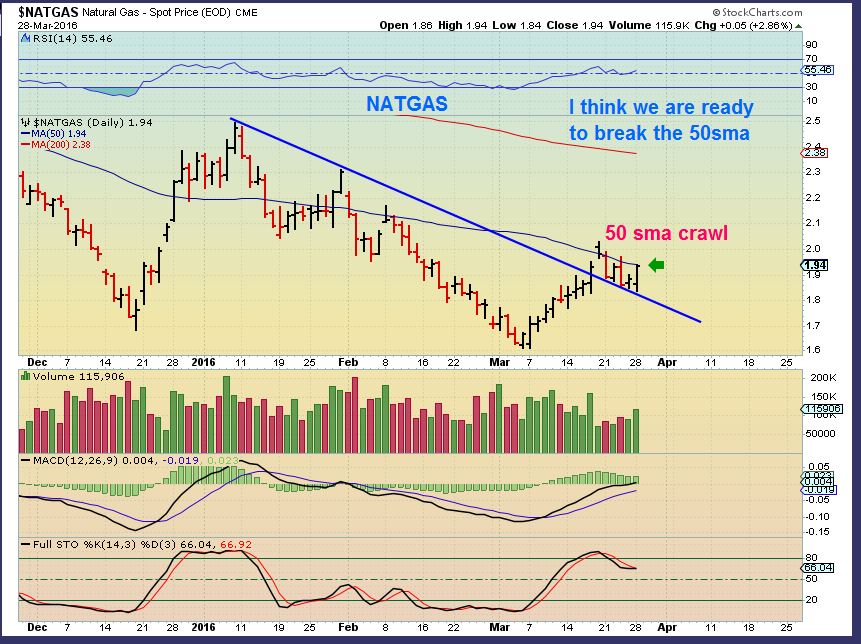
NATGAS MARCH 28 – I want to remind you that when NATGAS got to the 50sma, it crawled along under it, building steam to break above it.
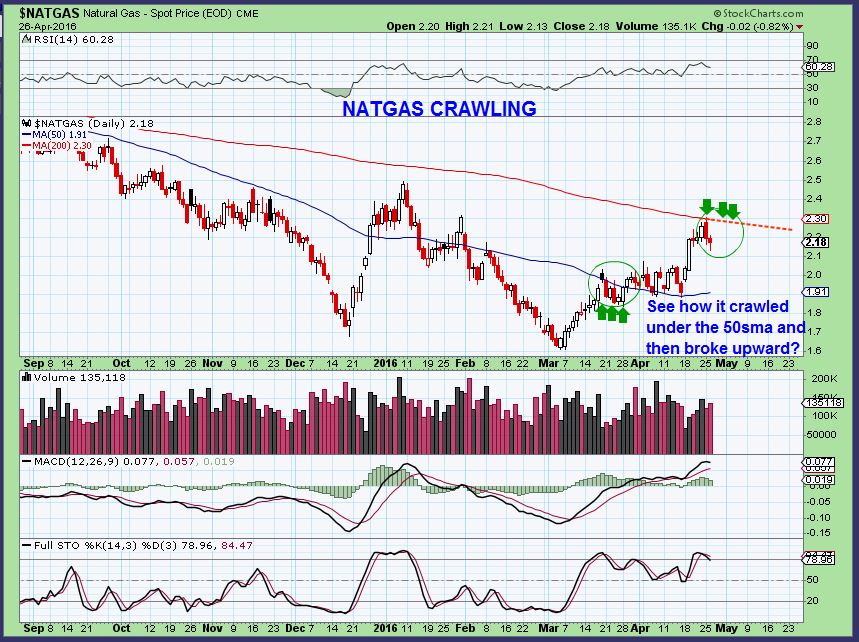
NATGAS Currently – Natgas has reached the 200sma as expected, and now it may crawl around here trying to build steam to break higher.
COMMODITIES ARE SETTING UP AGAIN
.
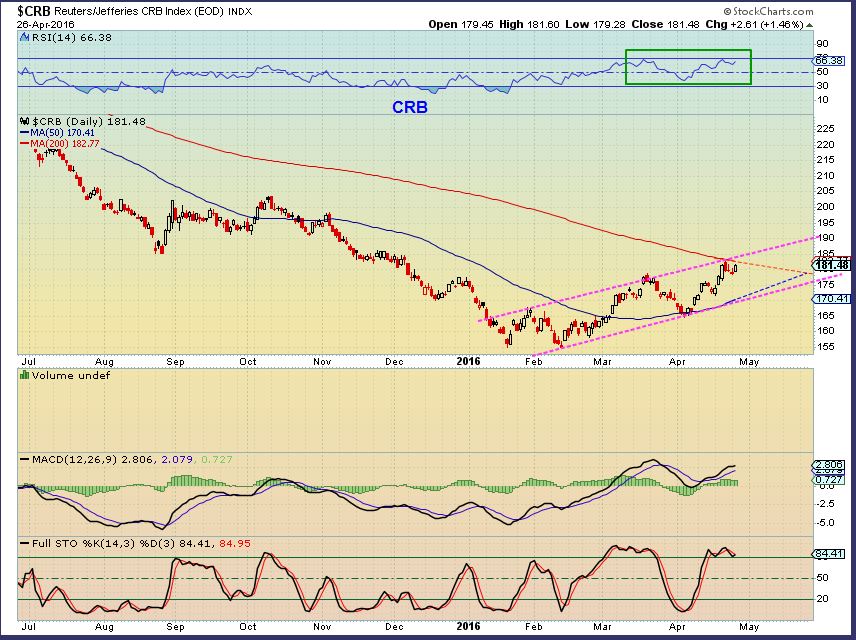
CRB – So the CRB is also just going sideways after breaking above the 50sma, and then dropping back to it as support. I dont know if it can break through here yet or not., IF NOT, MAYBE the commodities that we are watching will pull also back a bit more. IF the FED says that ‘inflation’ is a concern, Buyers may jump into Commodities and push the CRB above the 200sma.
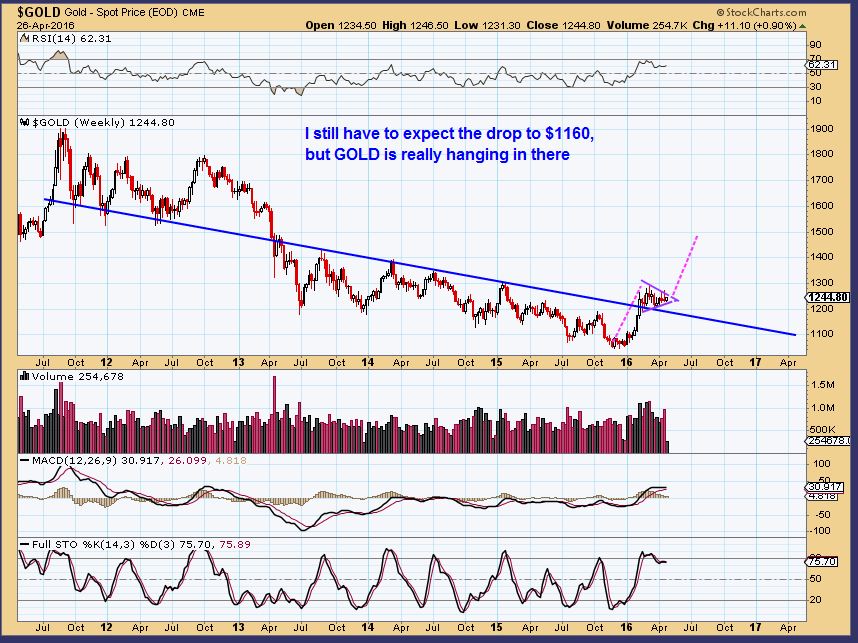
GOLD – What else can I say about Gold? 🙂 It is due for a pullback, but it has just been consolidating sideways. Maybe the FED can start a sell off in GOLD finally? This weekly chart actually looks bullish, and so does Silver shown in yesterdays report, but…
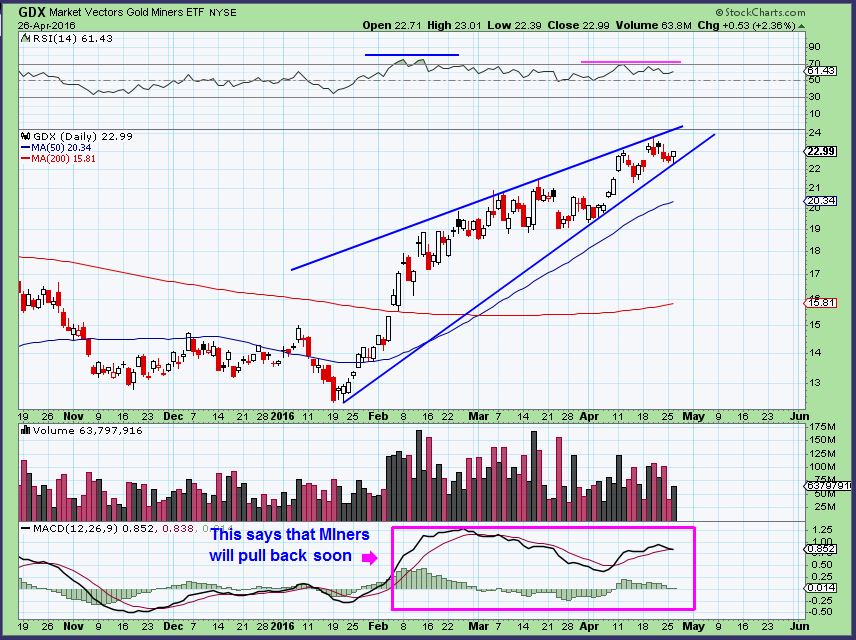
GDX – Miners finally look like they are losing steam here. Look at the MACD divergence. Unless Miners SURGE higher, they look ready to tag that top line and drop.
TRADES SETTING UP
.
( I apologize if this gets ‘wordy’. I want to explain things clearly)
.
THAT SAID – I want to just focus on our set ups in commodities and Energy. I have new readers here and I know that spare time is difficult to find, but I’d like to recommend going back to some of my weekend reports when you do have time, and reading them just to know the Big Picture expectations. Also skim some Energy charts on the 2 links that I posted above. Make a check list and look them up for opportunities. I had been saying in January and February that I expect Precious Metals , Oil and Commodities to BOTTOM and be some of the best trading around %-Wise. So far, we have seen spectacular gains in these areas. Peoples accounts have actually doubled and tripled in 4 months! That is why I want to focus on this area when it looks like the next run higher could be setting up. I think they are setting up now.
.
Tuesday I saw some very bullish reversals and I mentioned them in the comments / chat section as they occurred. I will start by showing those here.
.
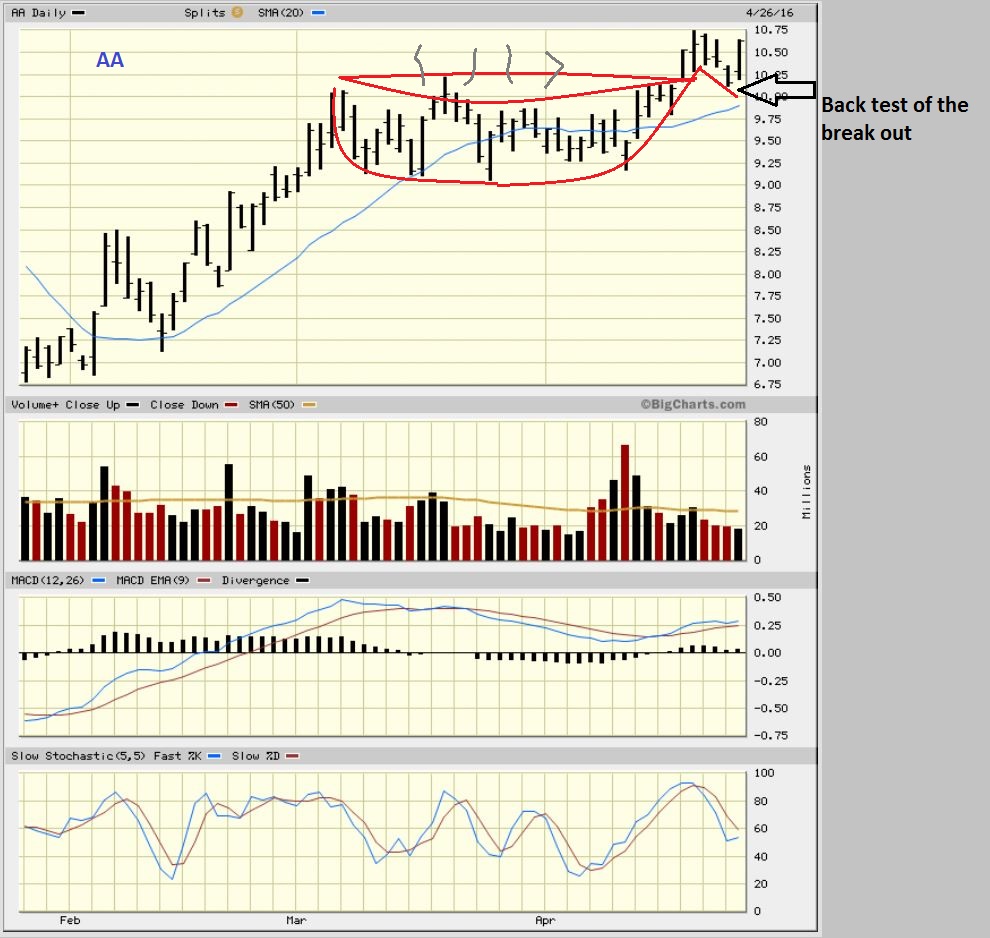
AA – The first run higher was roughly $6 to $10. Then we see a consolidation that formed a Bullish pattern called a cup & handle. Mondays dip ‘tested’ the break out and today AA burst higher. Volume actually closed at 27 million ( I captured this before the close). This stock looks ready to go and could easily run 50% or more.
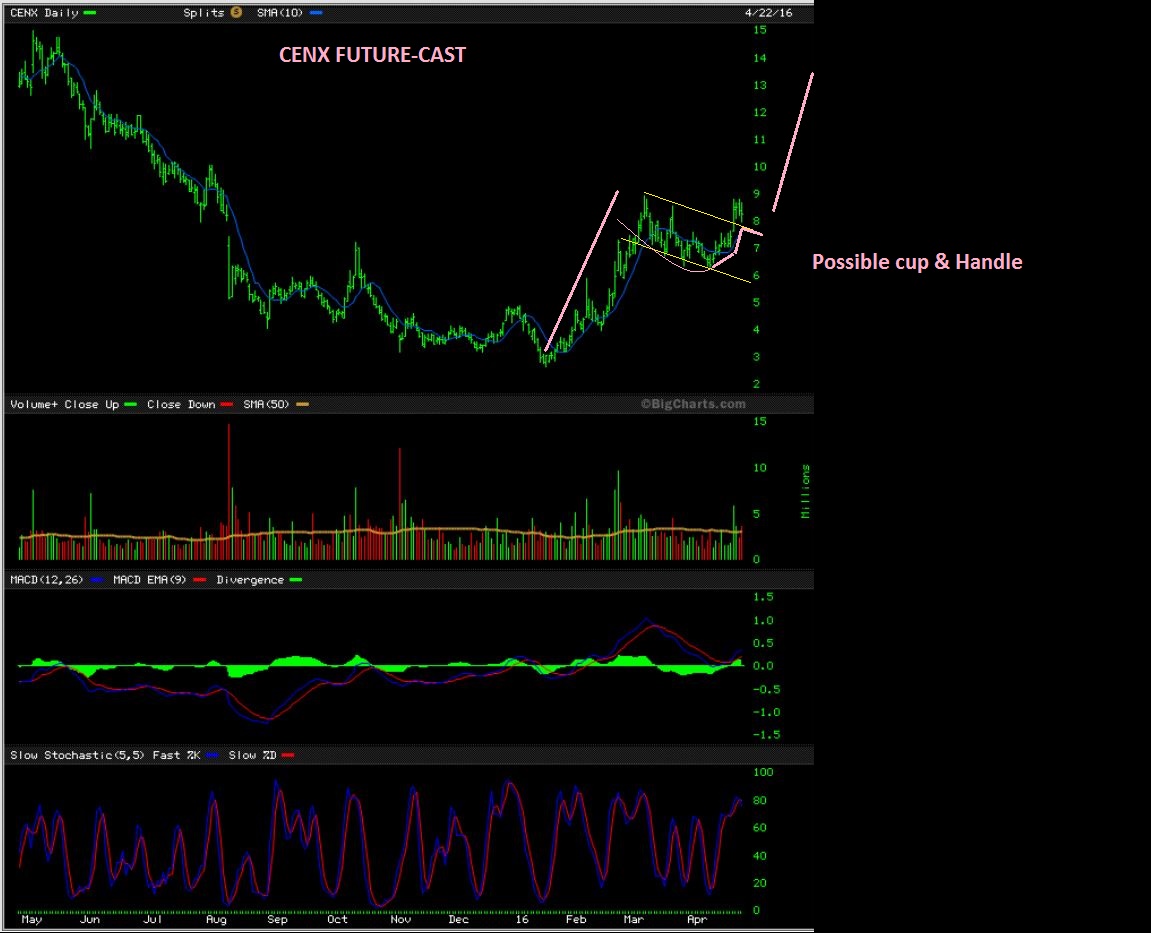
CENX – This was April 22. I was mentioning how this could drop to $7.75 and seem scary , but it is a very bullish set up. It is another Cup & Handle pattern. These are formed from Buyers supporting each sell off / accumulation.
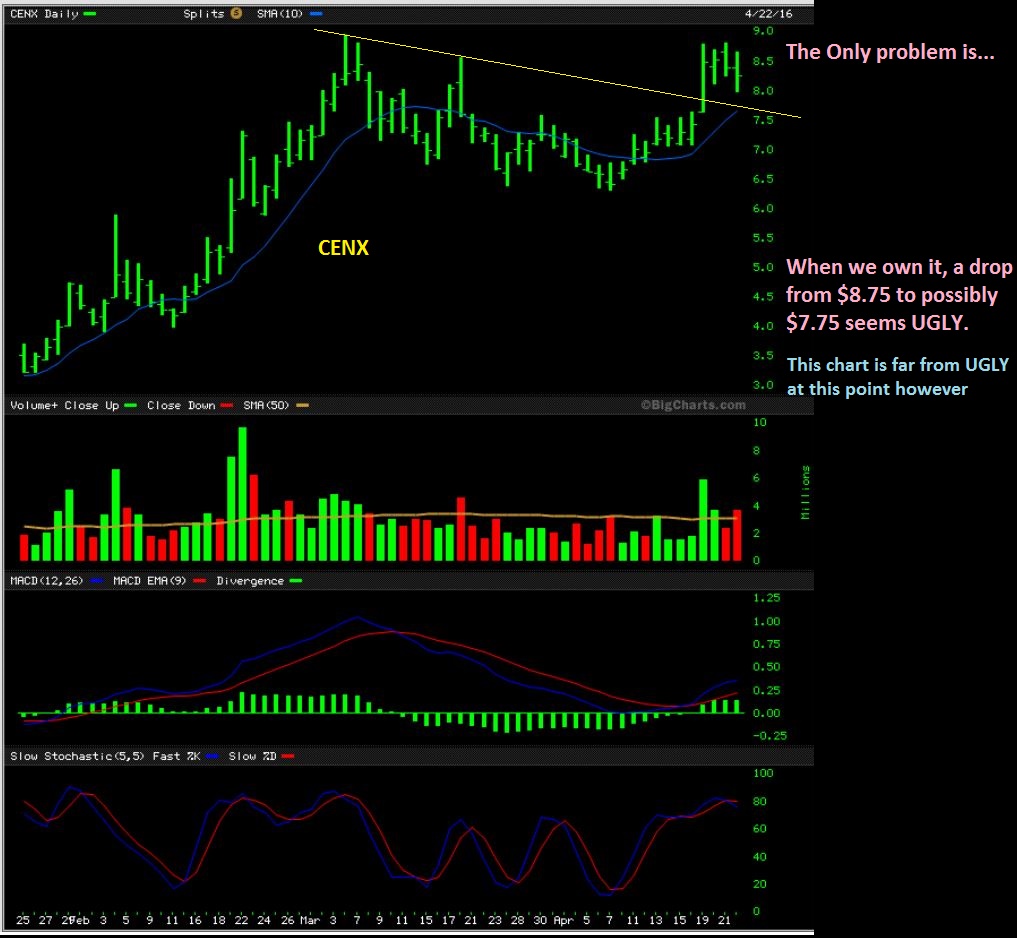
CENX – Tuesday it dropped to almost $7.50 all in one day and reversed higher to $8.50. THAT is bullish action when buyers that big quickly scoop it up on a sell off. Where does CENX want to go?
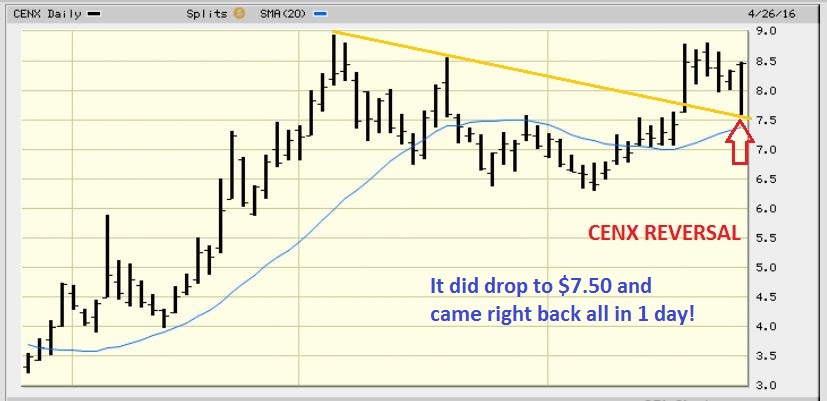
CENX could easily double from here. This just ran from $2 to $9 in 2 months in the first leg higher. NOTICE THAT IT IS NOT STRAIGHT UP. It can get bumpy and volatile, but rewarding . If you bought CENX in January at $2, you quadrupled your investment.
.
FCX in February – Using the chart below, do you remember when we bought the first break out at $4ish and a 2nd entry was above $6? On this chart it looked like FCX wanted to go to $12- $14 (Octobers highs) eventually. Maybe higher after that. We are in recovery mode from a beat down in commodities.
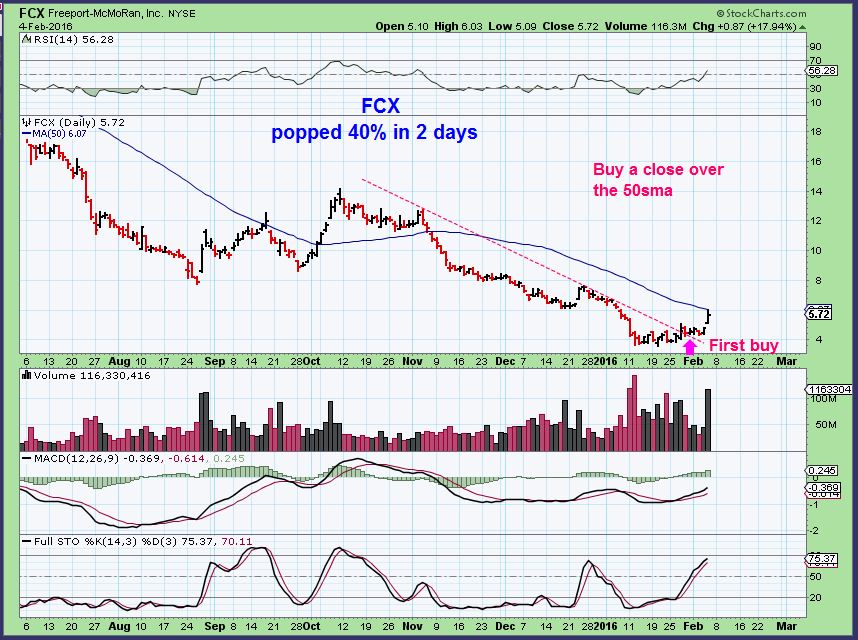
FCX TODAY – FCX was above $12 only 2 months later. This has formed a small cup & handle in the recent consolidation too. They had their earnings release and look at that drop to the 20sma and then it recovered. I would say that FCX is a buy in this area, someone with deep pockets stepped in and scooped that sell off up. Big Funds often look for a sell off to buy, to be able to get the amount of shares that they want without driving the price too high. If you bought this in JANUARY, you tripled your investment in 2 months. I think that FCX is a ‘buy’.
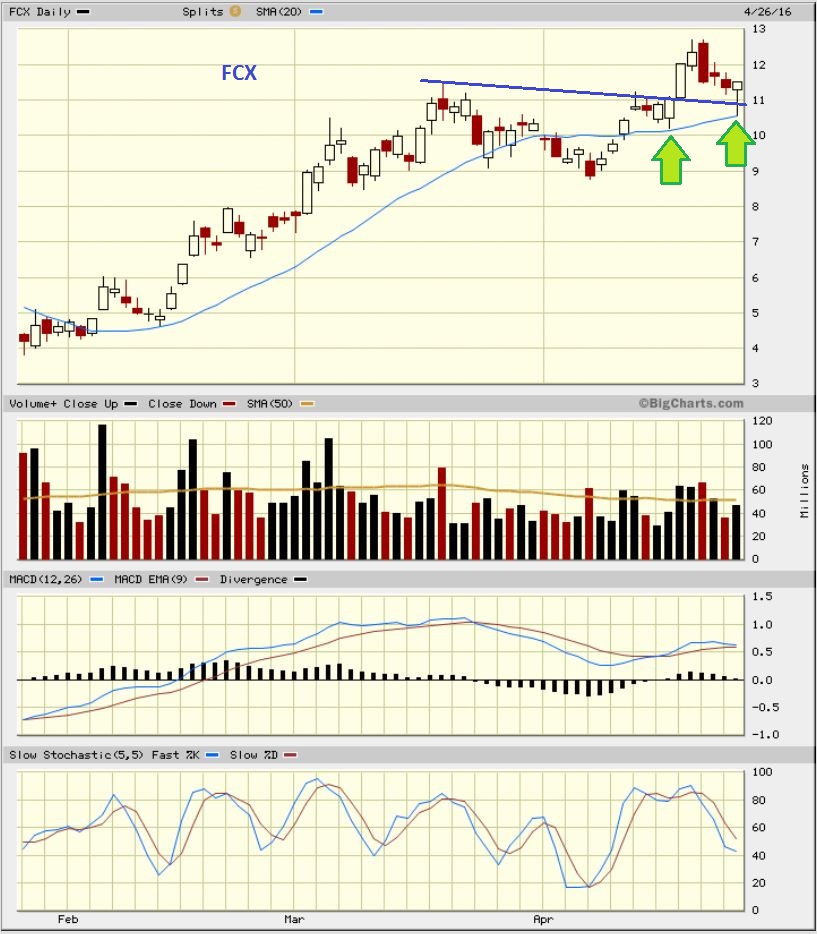
FCX is a copper and Gold Mining company. This weekend I said that I thought Copper was setting up to break higher, and Copper stocks were looking good too.
.
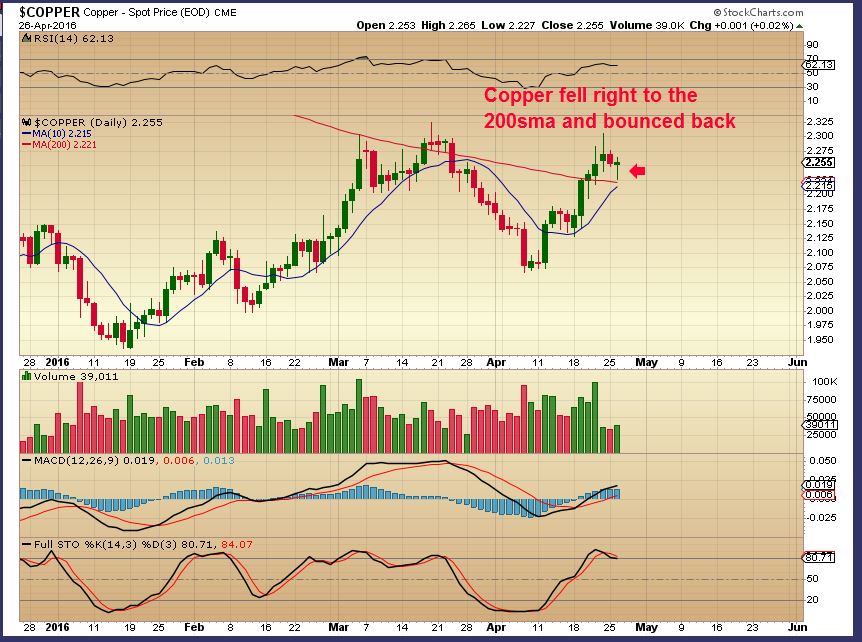
COPPER TUESDAY – Copper dropped and bounced off of the 200sma, remaining bullish.
.
HBM is a copper / Gold Miner that I have been interested in and accumulating. I posted charts in prior reports, lets look at it again here.
.
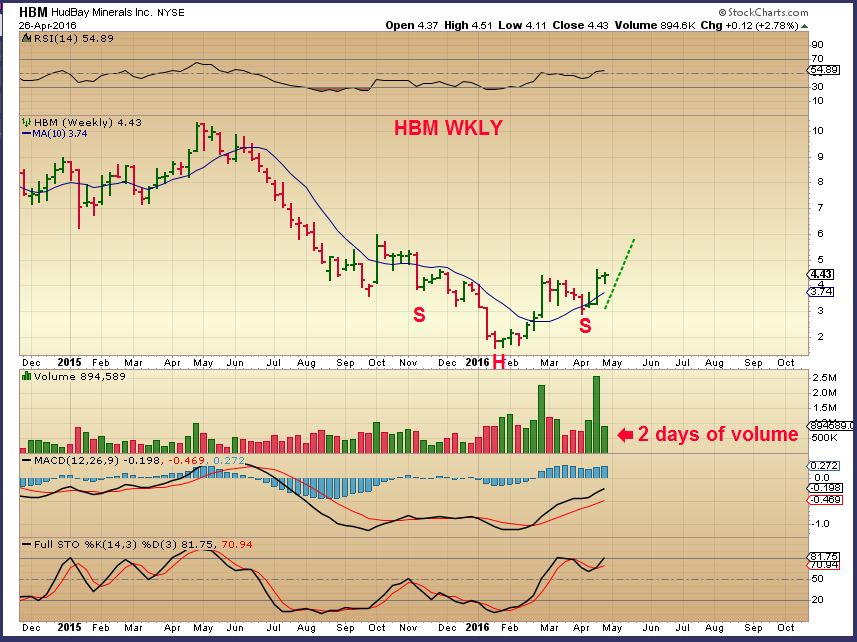
HBM WKLY – This weekly chart still has the inverted H&S pattern and the volume characteristics are bullish. This weekly chart is showing only Monday & Tuesdays volume. ( Remember that FCX ran from $2 to $12 so far. This looks like it wants to run to $10 eventually).
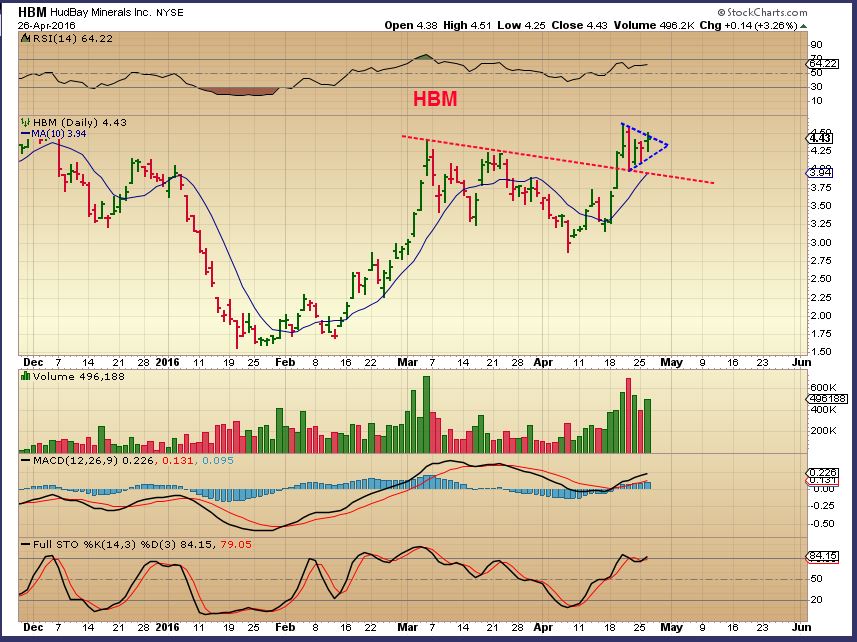
HBM DAILY – The daily chart looks like a bull flag. This could still drop again to the 10sma and that trend line, but it really looks bullish. Maybe the Fed will use the “inflation” word and causes this to pop higher?
.
SIDE NOTE: EARNINGS ARE DUE TO BE RELEASED FOR HBM THIS FRIDAY, and that is always something I try to take into consideration when buying a stock. It could POP the stock if the news is good, or drop it if the earnings ‘miss’. The last earnings report was in Feb, and the stock ran from $2.oo to $4.50
.
We discussed CLF in yesterdays report. I mentioned that a small starter position could be made at the 20sma , since it repeatedly tagged that support area and moved higher in the first run up.
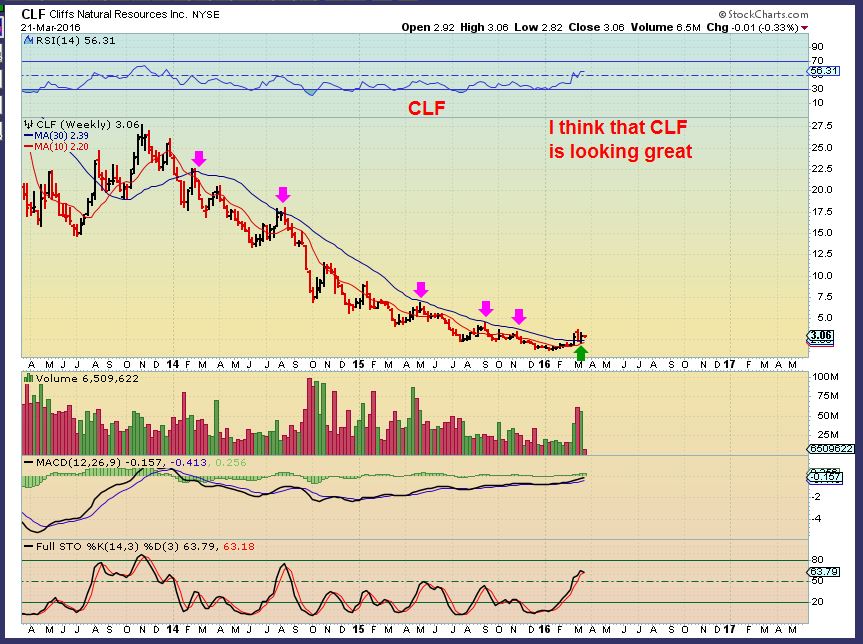
We were buying CLF in March at the 20 sma, shown in this March report.
After a very steep run, I sold out of it and wanted to re-enter on a pullback. This chart yesterday showed the 20sma, and maybe the blue trend line as places that it wanted to drop to. So I wouldn’t take a full position at the 20sma, maybe just a small starter position, in case it drops further.
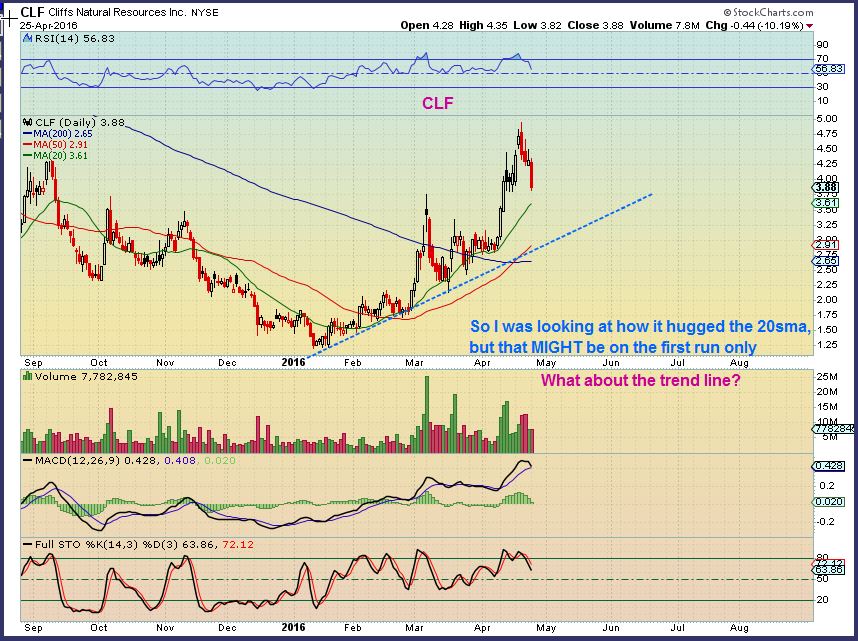
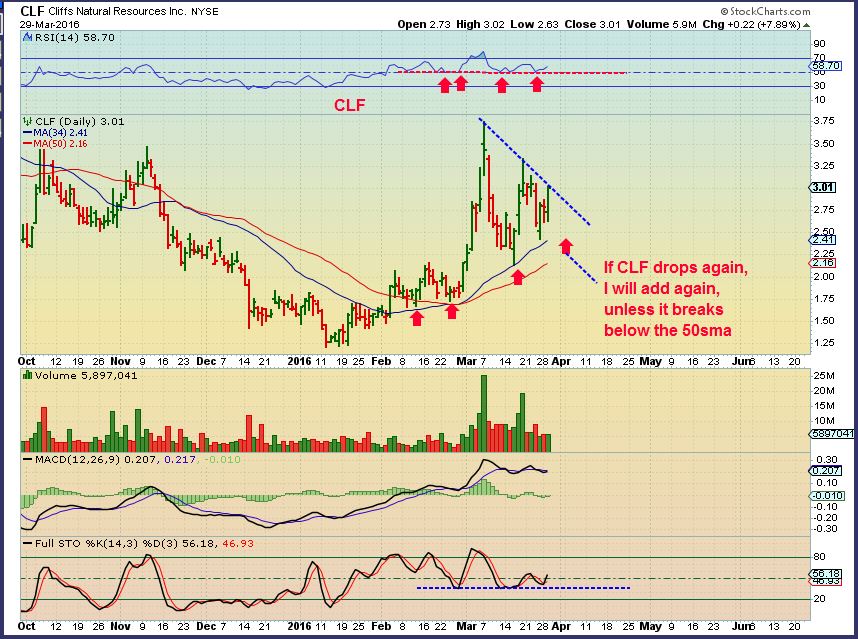
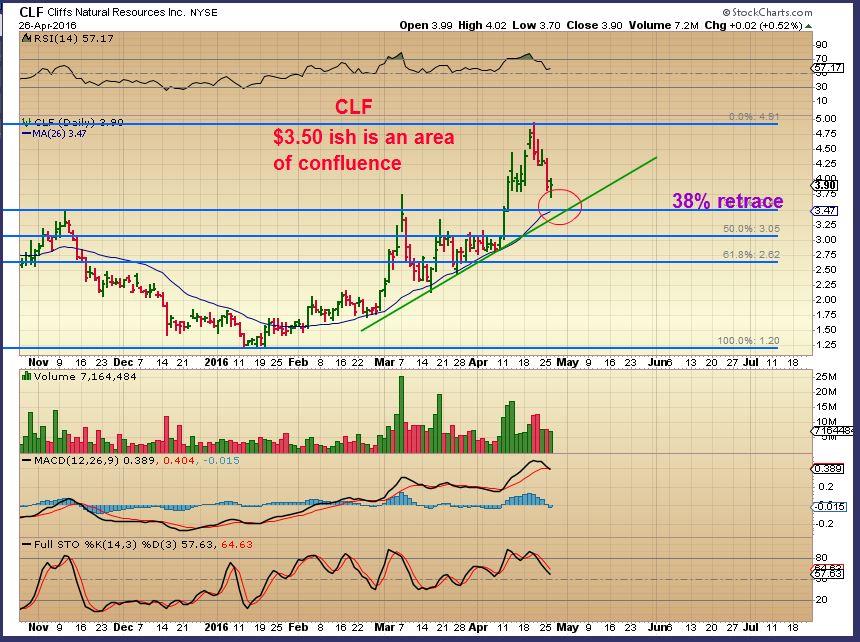
CLF – I started a position on Tuesdays dip, mainly because I saw all of the commodities putting in reversals higher. You can see that it could drop further, especially to the 38% retrace near $3.50. I will add on a drop.
CLF – THis thought crossed my mind about CLF tagging the 20 sma. Looking at this chart I remembered how we rode out that long sideways consolidation in March. IF we got another smaller one here riding along that red line, the 20sma would eventually catch up to price, instead of Price dropping to the 20sma.
.
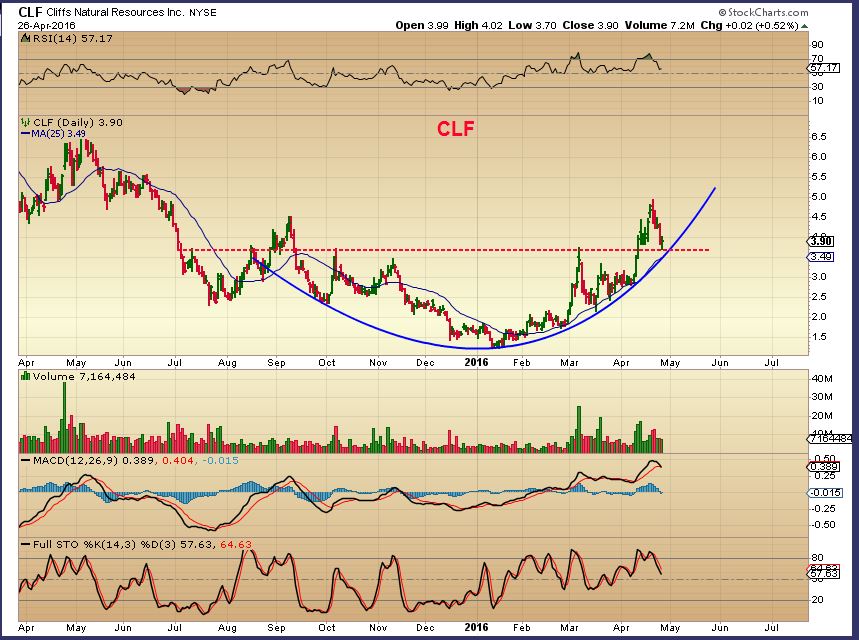
By the way, this is my March 21 ‘buy the break out’ chart at $3. It ran to $5.00+, and we are looking at the pullback now. This chart shows huge potential if we are in a commodity recovery. CLF was actually over $100 5 yrs ago. I think that CLF is ridiculously cheap right now, if we are in a commodity recovery.
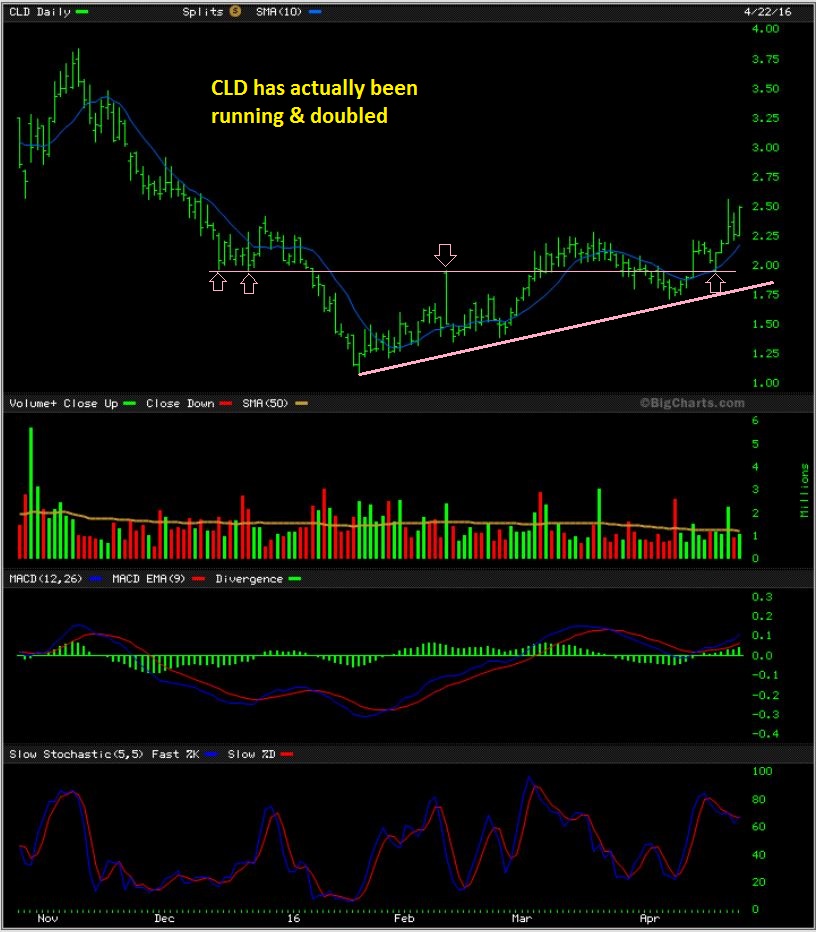
This past weekend I was looking at CLD and drew these weekly and daily charts. It looks set up to join the commodity run too.
CLD – Look at this weekly base.
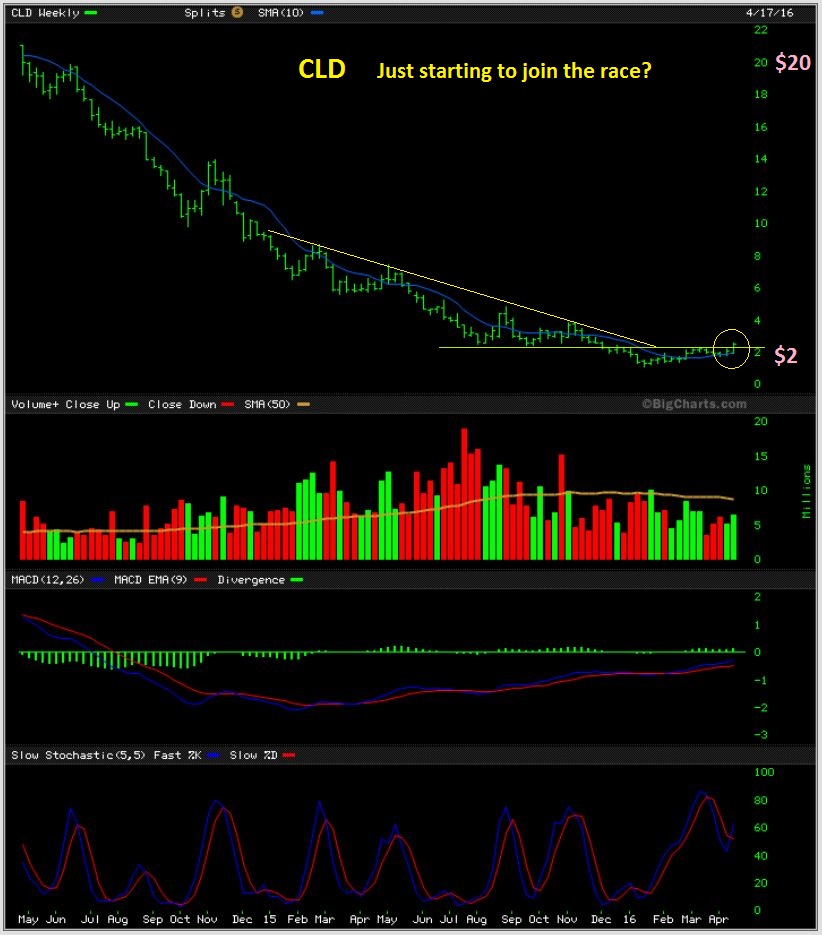
CLD DAILY – It doesn’t look like much, but if you bought this stock in February, you would have already doubled your money.
.
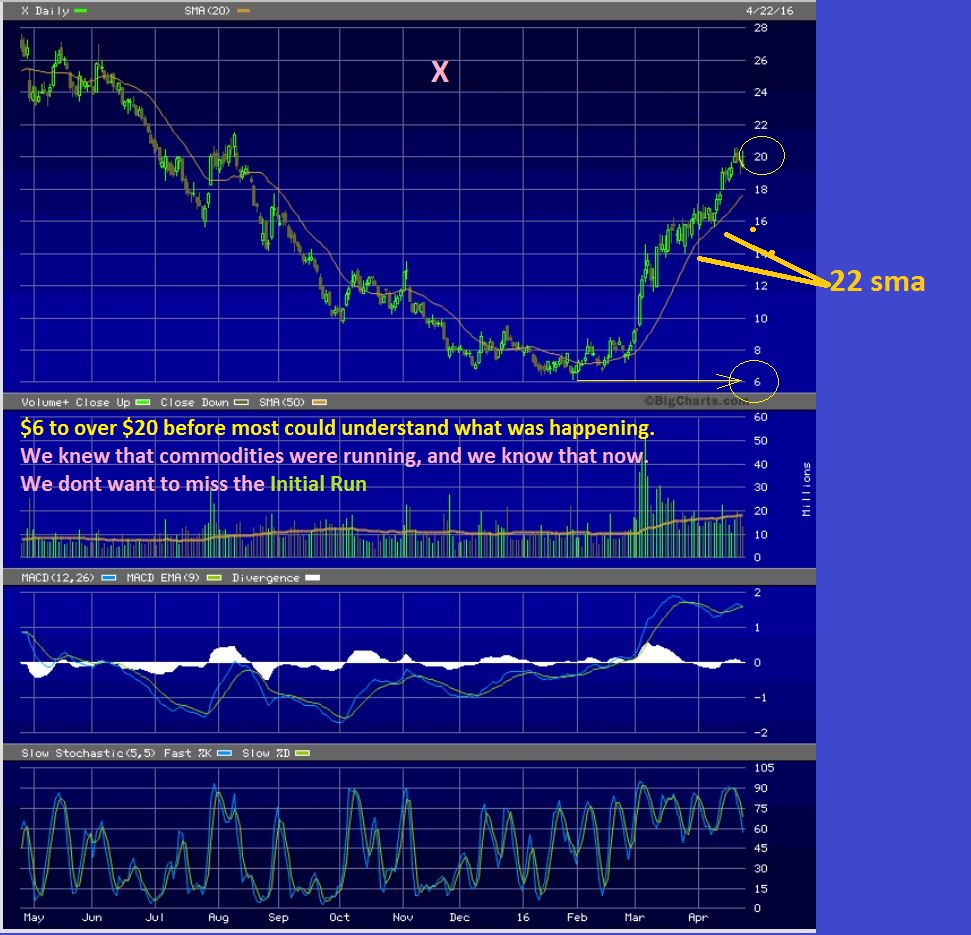
We also watched US STEEL – ticker ‘X‘ run from $6 to $20 in 3 months. They released earnings and and did not sell off in after hrs. This is a STEEL company that was beaten down to ridiculous levels too. I’m showing these charts to point out that some of these Commodity / Metals companies could still have large gains ahead of them as they recover. AKS ( AKSTEEL) Also put in a strong reversal yesterday.
For now, I want to end this report with these charts of interest in the commodity sector, just to show how things are lining up. Those reversals in AA, FCX, CENX were very bullish if you ask me. I would buy any one of them in this area with a stop a bit below Tuesdays lows. Maybe wait until after the Fed volatility expected at 2 p.m.?
.
There are so many other set ups to watch in Energy and the Commodities, but this is enough for a Fed Wednesday. Lets see how things play out after the 2 p.m release. We could get a little pull back or a break out, but either way we benefit. A break out adds conviction to the trade set ups and a dip may be the perfect buy spot. In Thursdays report, I will cover buying opportunities and chart set ups as they present themselves.
Have a great day trading and be ready for whatever volatility the FED Decision on interest rates may bring are way.
.
~ALEX
The usual warning always stands. Buying a small basket of stocks is far better than buying too much of one or two stocks. The risk is that some bad earnings or news in a beaten down sector could adversely affect ANY companies stock. Look up a stock on YAHOO.COM FINANCE and read the news headlines. Find out when they release earnings, due diligence is important, etc 🙂


2 charts here by request. ( he owns them). IT is a great looking move out of the lows. There isn’t much for me to say about this stock, because it is in the middle of a move / consolidation. From here it can go sideways, keep climbing , or drop the support area.
.
Basically It is recovering, if the company remains healthy, it can continue to get accumulated. Right now n the daily it is extended, but they stay that way at times.
F.Y.I. — I just looked into CLOUD PEAK ENERGY ( CLD in the report) . They have earnings after the bell tomorrow. They are a coal company and many coal companies have gone bankrupt lately ( ACI, BTU, etc), so I would watch this one.
MAYBE They are a sole survivor , maybe they have bad news.
Good morning All, been trying to catch up with all the reports from CF after joining recently.. thanks CF for the great charts and reports..
G-Morning Chiru
Thanks for being here and some of the past reports really did have a lot of information that can help one to see the big picture idea. The weekend reports are usually helpful that way too. Energy, Commodities, and Precious Metals have been very bullishly lined up the past couple of months.
Thanks Alex.. I think I am a little late to join the party 🙂
have started to build some core positions and entered into FCX and AA… Alex – can you pls comment on the GORO.. the chart looks interesting to me.
Sure, the hard part about many Miners is that I do see some bullish looking set ups, but I cant recommend them as low risk set ups, because I do expect a pull back in Gold at some time soon. In the past, when Gold would correct, even bullishly set up Miners would drop temporarily. I have been trading TGD ( And it just about doubled this month and now looks like a valid inverse H&S on a 1 yr chart, and BAA, and a few others, but doing so only as a trader).
SO GORO – It is at resistance if you look back at last October. Yesterdays reversal makes it look like ( as a trader) it wants to make a quick run higher. I attached a chart, refresh this page to see it. Since it could go either way, I would put a stop under $2.75 if I was trying a trade with it.
.
click to enlarge
,
By the way, if you know what an inverse H&S is, this looks to have just completed one.
Thanks much Alex..
Good morning Alex. Good report, very informative. FYI I like SDRL (Seadrill) here too. Looks like it’s setting up for a run.
Yes, I like it too. I posted a chart in the comments section 2 or 3 days ago, it does look good. I dont have that chart on this laptop that I am on right now .
Alex, thanks for keeping our emotions in check…probably the hardest trading lesson to learn. [sadly, still not quite there as sold LGCY way too early ugh!!] You had mentioned FEYE earlier and I’m still holding with earnings coming up. Still a good chart? Just asking but wondering if a consolidation ever gets “too old” that pushes the probabilities the other way? Still asking for fishing lesson advice :-). Thanks in advance!
Patience- we all work on that one from time to time. ; )
When I looked at LGCY, I sold 1/3 on the rip higher , but the weekly chart keeps me in it too.
FEYE is consolidating that run where it just about doubled. Kind of a long consolidation though. It still looks ok, earnings may be the catalyst for the next directional break.
FEYE ??? I bot Monday and I was stopped out
Yes, I recommended it using this chart ( refresh for chart)
.
I cant remember if I said BUY at he 50 , or buy with a stop below the 50sma. It went down and tagged the 50sma and is moving higher now. Your stop must have been very tight if you bought Monday and got stopped out already?
.
Nice Chart, i am watching FEYE VRA and MWW
Just my 2 cents, I dont like the light volume on VRA,
FEYE looks good, and MWW is a nice base . 🙂
Thank you Alex, I wait till FEYE go down a little bit, I want to go in , I like the Chart
Deshy, It kind of looks like it is breaking higher today , after a tag of the 50sma last week.
Thanks Alex. Do you think we should cycle out of some energy positions and add AA, CENX, CLF, etc. ?
Tough call, because its not TOO late in Oils cycle. Both look good, but AA, CENX, etc look ready too. Maybe wait a day and see if the Fed discusses inflation and maybe we get a brief 1 day drop in commodities. Ride energy today, add commodity tomorrow?
Just a guess there
A large increase in energy bullishness had me taking profits on most energy positions Monday and will look to reposition on retrace – if if happens to work out that way.
But then again I do tend to sell too soon 😉
As long as you just keep locking in Gains, its a winning trade 🙂
Thanks. That is what I am telling myself at this very moment since I sold LGCY at 3 bucks. Was still a nice profit from 1.05 though!
Alex, what do you think of the BIO sector. You didn’t mention it. LABU, etc.
No change so far, consolidation above the base. I mentioned it yesterday I think
Yes Alex…. many THANKS.
Also a very good and timing report this morning.
GUYS LET WE CELLEBRATE HIS FANTISTIC WORK TODAY!!!!
HOERAA
Thx Buddy 🙂
LGCY IS A MONSTER : )
Waiting for the dip on LGCY and maybe after the Fed talk or after earnings. Who knows – this could go to the moon!
G-Morning Moe!
The weekly set up on LGCY almost makes it look like it will run to $4 and then may Bull Flag sideways . If it does that, I will point out the buy then too.
Dear Alex, luckily i am still holding LGCY bought low $1. So not worried about 5% – 20%downside. Sure, i will sell little up or close to $4.
WATCHING HK TODAY. It could finally break higher here, recommended last week.
BCEI has just doubled & almost tripled since I recommended it 2 separate times on the 50sma.
It has actually doubled in 6 days. The weekly set up is great
X is a “steal” right now!
No Pun intended I’m sure : )
Alex, Never apologize for getting wordy, if you wrote another Bible it would be read.
Well , I humbly thank you Edward ( Welcome back too) .
I respect the Bible too much to even stand anywhere near THAT category 🙂
AMEN to HIM is the Glory.
Thank-you !!!
I agree, look at the 15min chart and see it building
Has anyone really looked at the run SM has put in? I sold it long ago, but it has steadily run up from $7 to $30+ today
Hey Alex – what are your thoughts on GTE chart? thanks!
Really nice on a weekly, too extended to buy on a daily ( Though it can keep going).
CLF & HBM opened red, now up 5% 🙂
Yes. CLF go BOOM (positive BOOM). SDRL go BOOM too. : )
Gold Correction Forecast: Alex – I’m sure you’ve gone over this many times, but as a newbie here I was wondering what your reasoning is for predicting a gold correction. It would not surprise me at all, in fact a correction in all the commodities at some time when it is least expected could happen. It seems to me that the price of gold is quite resistant to much change at this time, but what do you see that makes you feel there is a change in the wind?
Cycle timing. It can just consolidate sideways, but there are many factors that call for a drop. Mainly cycle timing.
There they go, MANY ENERGY STOCKS are breaking out with great volume.
See NADL, MEMP ( Nice long base mentioned here last week) , PDS, CJES ( Breaking above the 50sma after a long crawl).
AREX
Dear Alex, finally i sold LGCY @3.87. This is the first time i am reaping the gains around 280% in the short time. Always i used get-in and get-out to make 5 to 10% gain or loss.
After joining CF, i know the basics of low risk entry and cycle to go in safely and come out with huge benefits.
Congrats on a very awesome trade!
SIVA IS BUYING THE DOUGHNUTS THIS MORNING EVERYONE!
I sold mine as well this morning at 3.74
Congrats! – These are great trades – You get tomorrows doughnuts : )
nom nom nom thanks Siva!
Dear Tammie, thanks for your visual treat…
Dear Alex, with pleasure. Good to serve you all (good hearts).
Nice work!!!
finally CRK shot 10% anyone still holding?
I have that in 2 accounts…both in the red. I will dump if it climbs out of the hole. At least it is improving!
You can find better. CRK can’t ever hold morning pop. Skip it, she’s been no fun for me to trade.
AA raised to buy at Rosenblatt….PT raised to 15. 🙂
Nice, They probably downgraded it weeks ago so that they could buy it on the way down, now upgrade to ride it out. 🙂
That price target should be met rather quickly if this does an A-B-C-D on a weekly chart or that Giant Inverse H&S on a 1 yr chart plays out.
That’s the way these “Big Guys” usually do it! Shake out week hands, then buy back,
Hey Alex – what do you think about MDR chart? thanks! 🙂
Seems ok, its at 5 month highs, but sideways now.
Now we may have to prepare for the MID DAY DIP and Pre Fed Jitters.
yuk..red candle USO
Lets shoot for a gap fill 🙂
.. and maybe just having a little pause below that DT line from last year!
(REFRESH! … daily chart)
It’s hard for me to know if I should sell when a stock is up a certain percent….or hold….sometimes I sell too early…..but then again….sometimes I hold and my 20% gain turns into a 3% gain…..I guess I just have to decide what I want out of it and stick with that no matter what….
See if this helps ( It may not) . The way I try to look at it is that you will never sell the exact top, but your ‘time frame’ has a lot to do with it..
For example CLF – a year from now it could be above $10. If you bought at $3 & Held you’d be up 100’s of %.
If it goes from $3 to $4, and you hold, and then it goes to $3.50 , you feel like you gave too much back, but thats only if you sell. It could be $10 by the end of the year, so you;d have a triple+
So are you a trader / investor / both? As a trader, I look at the time frame of the sector that I am in. If Oil is early in a daily cycle I often just let my winners ride for a couple of weeks. If I take a trade on day 25 of the Oil Daily cycle, I may cash in sooner when it runs up, because I expect a pull back to a DCL.
Same with MINERS. IN January, I would BUY and Hold for 3 weeks. Now I wont until Gold pulls back and we get a lower entry. So its kind of a strategy based on the kind of market we are trading in & timing .
( That probably didn’t help — It is really experience that will fine tune that, and there’s nothing wrong with locking in profits).
Thank you – yes, that is helpful! Need to put a big chart on my wall of where we are in all the cycles…:)
I’ll try to put it in the reports often.
Can you give some direction on where I may find some info for learning about cycles and also your opinion of where we are on cyslcles and how you decipher them? Thanks in advance.
Hey Todd- There are a few cycle guys out there that use it exclusively, but they dont teach it to you, they just point it out and you learn as you follow along. I do the same here, but I use Technical analysis , and other things to give it added weight or to show that its hazy.
And cycles are different in length for Gold & Miners and Oil for int=stance, so I usually point it out in my reports. Like when I said Oil is only on day 10 of a 40+ day cycle…o r day 15 of a 40 days cycle, it means we can go higher, because the next LOW isnt due for weeks. And it may be a higher low if its a bullish run. I’ll try to be more clear and I’ll try to add an explanation in a future weeknd report .
Its a good idea
Hey Miller, I didn’t know about it either until coming here, but feel like I have a pretty firm grasp now. Keep reading for a couple of months and it will all come together quickly. Honest. You’ll look at a commodity chart and the cycles will stand right out to you.
Thanks Cason, I’ll study the commodity charts for a bit and may hit you up with a question or two about it along the way,
It’s hard for all of us. This will make you feel better – I sold X at 9.8 and $11.5 b/c I was up over 40% and it was overbought on multiple indicators. Thought I did awesome. Then it hit 20. Oops. A few years back I sold FB at $27, because I had done well enough and was time to take the profits – I had nailed their all time low almost to the cent and now it’s $118. 🙁
Oil inventories rose. Oh well, can’t have the wind at your back all the time.
That was a real pisser after having a bullish API last night. Why can’t those two ever agree! EIA Messed up the oil party I was having this morning!
MEMP is possibly attempting to break out from that base – great volume today .Chart was in the weekend report I think
PACD finally moving. I sold last week
Looks good
I couldn’t understand why that never poped
Oooh Bill, That looks really good. Strong volume out of that base.
I sold mine a while back also….but…it still looks like it’s at a good point to get back in..?
Only b/c you sold, right? 😛
You still own OAS or MRO Cason? ( I cant remember which one) Slow & steady wins the race. It looks good
OAS. Still there, full position, loose stop. 🙂
Goes up, sideways flag, up, sideways flag, just keeps grinding higher : )
Solid Defense. Doesn’t suffer big drawdowns!
Cason, thanks for the color yesterday re: WPX solid defense. Very true:)
Bill, thanks for mentioning PACD last week. Appreciate the heads up between you and Alex in the thread. I find these chats great for learning. Holding tight now and hoping for $1 magic number before delisting day July 16th…never too late to join in and help the cause (again). 🙂
PACD is getting delisted? I didn’t know that. This 40% day sailed without me
I didn’t realize that either! Although like you, I sold already…I looked it up….they were notified on Jan. 13th of continued listing standards…..have 6 months to get it up to $1 – so yeah, that would be July…..good to know….
CLF has strong volume as it moves higher here ( up 8%) . I didn’t get my complete fill : (
what about BBEP? It hasnt gotten going…will it play catch up?
It might, but its more of a 50/50 gamble until it shows some strength.
speaking of down & outs.. i see SUNE plunged to 16.5 after its feigned recovery
CLF nice and green 🙂
Gobbled up 2k shares of VALE at the open on weakness
Go CLF, it’s your birthday!
SYZM building up a head of steam (at last)
ALJ looks real good
SZYM is doing too badly either 🙂
SILVER strong…
Got some SLV leaps today. If silver is able to get a full head of steam, that could be a nice return.
What happened to EXXI? No chart data……
possibly delisted to new ticker on over the counter?
agree
They filed for bankruptcy 2 weeks ago. Last close was 13 cents. I felt bad about the last time I posted that EXXI was rumoured to be going down – as I think it was Bill that was going to invest and it shot up 30%+ the day after.
Ya I remember that. I also remember Maria talking me out of REXX, some pond scum comment. It went up about 300% for 10 straight days.
…what’s a matter billybob.. u miss me again? u have my email…..
*so Much 4 our Truce….
What? You had a Truce?
Thats called ‘Truce abuse’ – LOL
😉
I need more GIF Ts
I sold a little over 2/3rds of my LGCY at this point. ( I want to hold some bcuz you never know). I think this could drop or bull flag and still run higher in time. I will cover it in future reports.
I am Watching SSYS, Yesterday the price crossed the avg 200 and Today the +DI12-DI12 indicator ist giving a Buy-Signal
That looks like a huge inverse H&S on a 1 yr chart too.
I dont think that you were here yet, but I was advertising DDD, VJET, XONE and SSYS a while ago.
Thank you Alex.
Actually bought into it today!!! IF that inverse h&s triggers, good money to be made.
yes, Peter I think the same like you
The 2 Volume indicators: OBV and William`s A/D are pointing up
Alex, thanks for the read on CLF longer term. What do you have in mind as a target for FCX longer term? Thanks:)
It really depends on the health of the markets, health of the recovery in commodities, etc but if it fully recovered and committees boom due to demand or inflation, it shows $20 and then $40 long term.
MEMP ( Long steady base , Mentioned below this morning, and last week )
I am following closely 🙂
I am following from the drivers seat 🙂
Hi Alex
If EMES stays above the 50SMA, is it a buy…..don’t know why it is not responding to higher OIL?
thx
BAS driving me mental.. but i know the day i ditch, will be the day it takes off.
Same with me and HK. I am up on the position, but the money definitely could be better spent with some of the other crazy moves I’m seeing. Then you sell it, and it does what PACD is doing.
im in HK with you too…
thats starting to grind up & away from the MAs nicely
same here for HK. it’ll pop on us
can’t come soon enough.. target 2.60 ish?
you want the 200MA, don’t you :)))
…& coincides nicely with HSR from last sept & dec 🙂
Although the nice thing with PACD (not sure how much that’s worth) is that at least it’s posting some positive $$$ unlike most of the stuff out there..
I know the feeling, its just been meandering along, Ive been holding a trade from just above $1 and may add if it gets back down again,(big maybe), but Id love for it to see $2.60, my initial target was around $2.15 but the way its been moving I may just take the prior high around $1.50
Seriously, how many more days can LGCY perform like this?
Look at NADL in March, Kind of similar. And NADL has been up 16 % 2 days in a row , yet looks like it is just starting to take off
hushh… at least a couple more .. mommy wants it to kiss that $6 mark …. first …
*MEOW
With LGCY reaching its 200MA I see no reason why EVEP shouldn’t tack on another 40% to do the same. The two companies are very similar in fundamental terms. Perhaps EVEP is even a little better considering it paid dividends in Feb and has positive EPS as of last earnings report. They announce new earnings May 4 and May 9. I’m going to rotate the half of LGCY I sold into EVEP to stay greedily fully invested. I definitely have a bad feeling about being so greedy and I expect to be punished soon.
LOL – That was a good read., in several ways 🙂
And I tend to agree ( I added to BCEI at $2 8 days ago and its above $4 ). They are just recovering very nicely from a very nice beating.
giggle
… i really like that evap…. think it’s got a date with 5.40s … perhaps… 😉
LGCY , AREX, WG, PACD, great %-Gainers today – all over 20% so far
and EVEP, since it broke out that base
(oops didnt see post below about EVEP)
REN looks like a breakout with decent volume.
Some very interesting charts out there. CENX and AA finally moving, hopefully towards their targets, about $3 higher each still. HBM, inverse h&s triggered, with a target of 6.50. XBI, is that a small hammer and holding the 20 sma? WTI starting to move. SSYS looks good.
Anyone interested in cement? That CX chart is looking pretty interesting. I’m thinking of putting in a starter position tomorrow.
Good looking chart Kathleen!!
CLNE still not joining the energy party, BUT… keep an eye on it. I sold it today because it’s just lagging like crazy, and broke back below the 50 sma. But when it recovers that 50 sma, I’m back in. Looking at longer term charts, it really likes to move up in May/June. Let’s see if it can quietly recover that 50 ma for a run towards the end of the cycle.
PACD today just blew right through its 50 sma, but at least macd was positive before the move. CLNE has none.
Check out BAS and CRK. BARF!!!
Bill!!!! Just saw the move in PACD.. you sold out last week for real?? First SRPT, now this?? That ain’t right… I’m hoping HK can get its act together and deliver a day like that! Or WTI…
hi alex, just like to drop a line to tell you how much I enjoy your chart work. would you consider adopting me for maybe a year to learn all your expertise on chart reading[I am a slow learner]. last night listening to Kramer on xm radio he said bullish setup on aa[I thought of you] head and shoulders, also I don,t know if I want to be in nyc[ guess that’s where you live] I hate going there, get lost al the time and people are very rude[how did you get to be so very kind]. about 75 miles from city now. became a premium member for 1 quarter, but when time comes to renew will renew for full year. just love to look at the charts, and your comments. always knew there was method to this madness. is that your dog? had a black lab, he died a year and half ago. he was and excellent dog. I miss him he was 14 years old, good dogs are like people hard to find. tia richie
Hey Richie,
Thanks for the kind words. I am in New England, not N.Y. – A little quieter where I am, near the mountains and the ocean. Glad you’re enjoying your membership : )
Who bought CLF? Oh yeah, This Guy!! (2 thumbs in)
This is for Guert. Glad I took LABU profits last week. Got it too early again, though. :O I got only a 1/2 position so I have dry powder to add more. Check out the chart then here is the mathe.
277.49 down to $270 is 2.81%. 3 times that is 8.43%. LABU closed at $33.00 today. 8.43% lower would be $30.28. It’s not exact with 3x ETF but that gives you a basic idea. You can add on one more day lower. Below $30, I’d stop out.
Anybody notice that the reversals for CENX, CLF, and VALE, happenned right at the neckline of their reverse h&s?? Big money defending those formations so far.
There is a small german Energy Stock: Crop Energy(Ethanol) can easily goes to 6 €, At the Moment 4.04€ in Frankfurt