
3 D
If you’ve heard of 3D Printers, raise your hand. Not a whole lot changed in the markets Tuesday, so after a quick review, this is one area that we’ll discuss today…
.
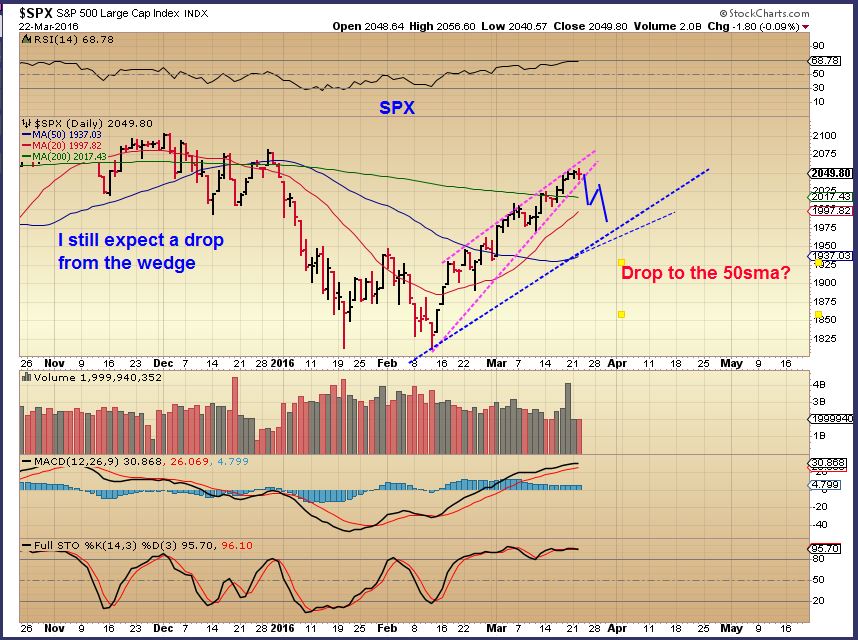
SPX – No Change in my outlook from the past few reports. I expect that this daily cycle is topping.
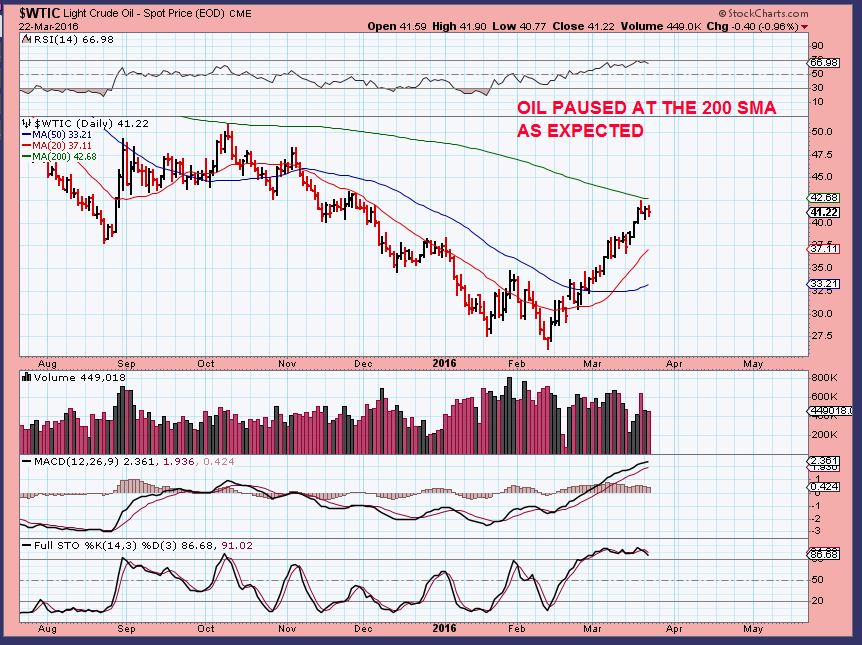
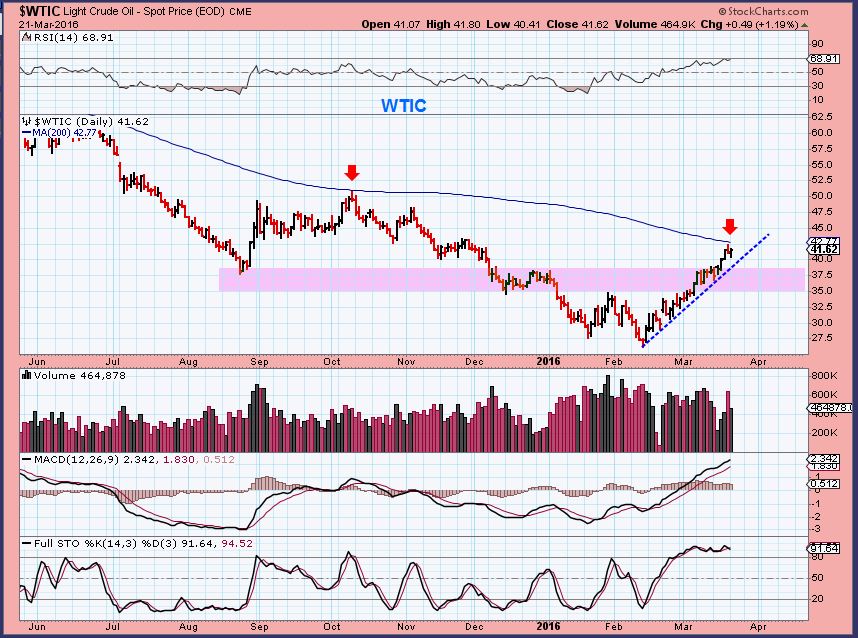
WTIC – Why dont I just post the current oil chart along with 3 oil charts from yesterdays report, and we’ll see that things are moving along as expected.
This is OIL currently, crawling sideways along the 200sma.
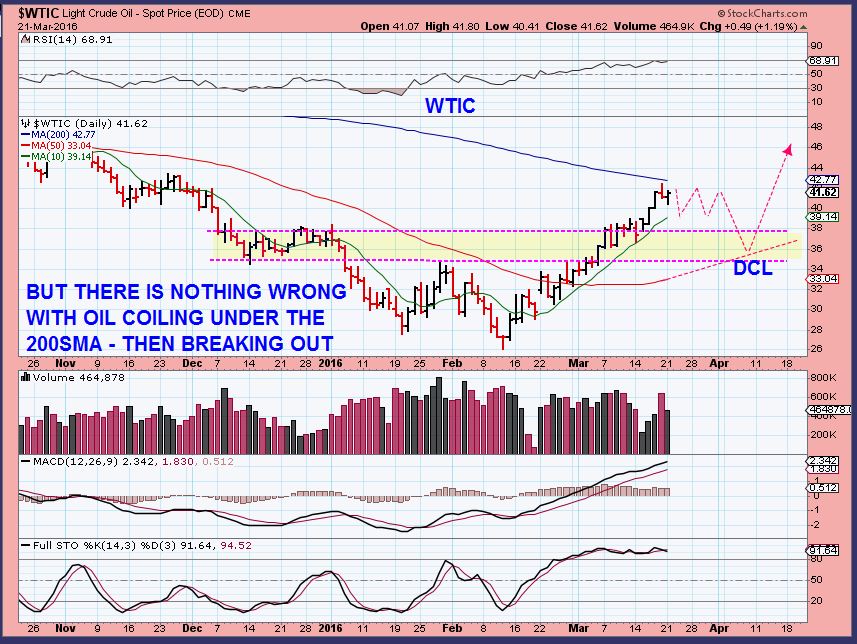
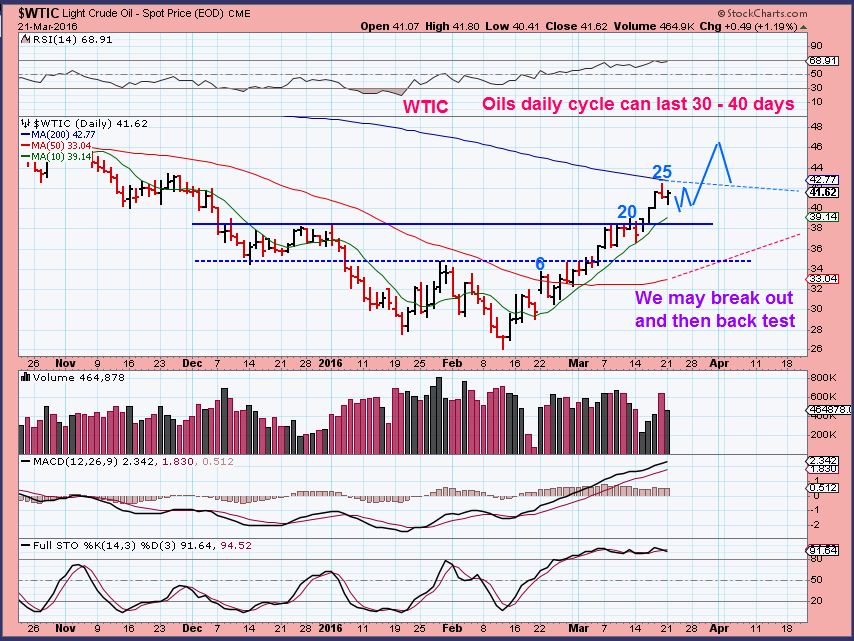
3 charts with possible expectations from yesterdays report.
.
NATGAS – march 21 – dropping to the trend line. I thought that it should find support there.
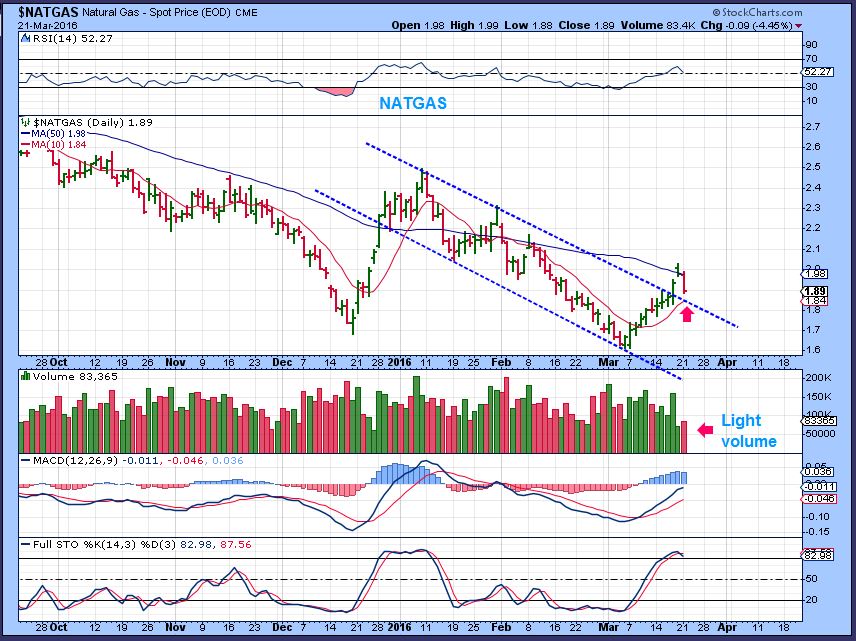
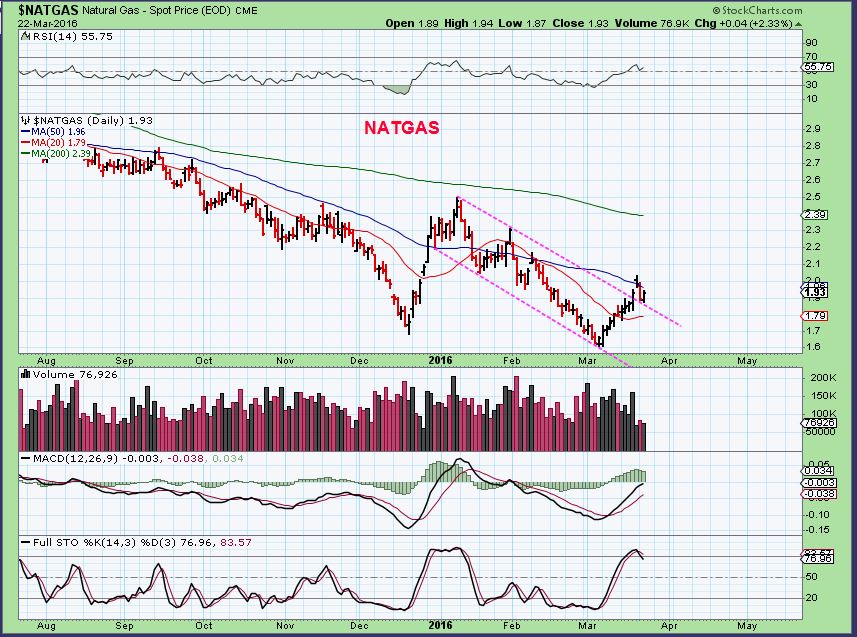
March 22 – We got a reversal on the trend line (so far).
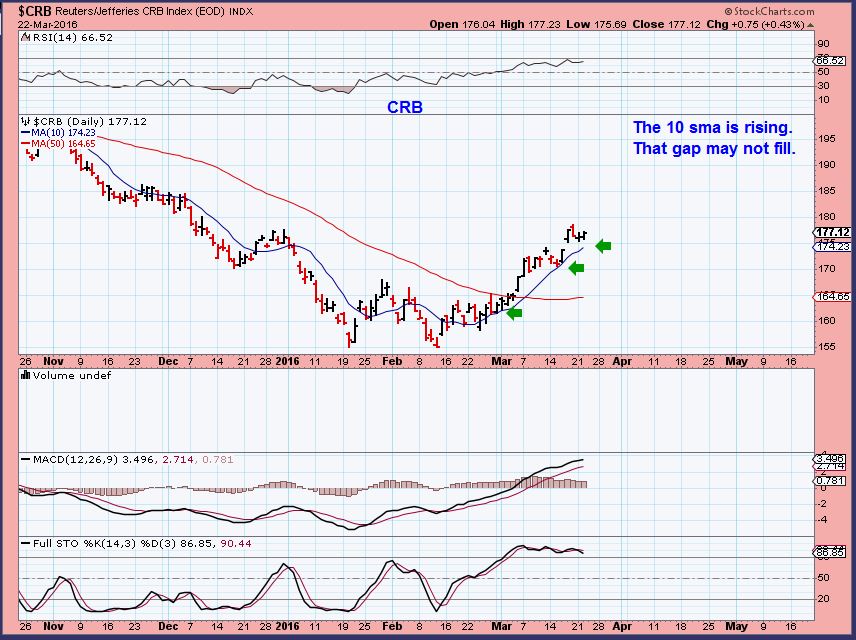
CRB from March 18 – possible dcl in place. Will that gap fill?
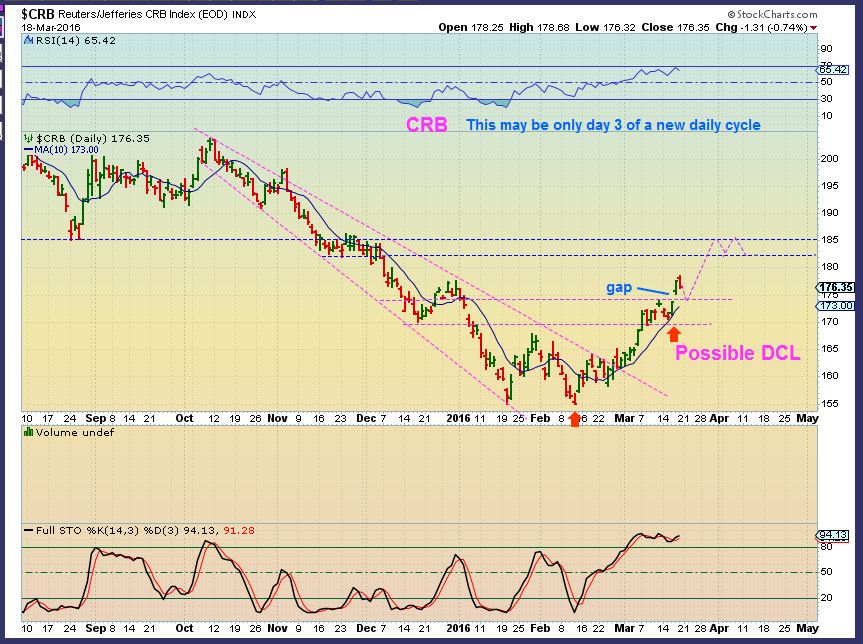
CRB – so far the CRB is holding up and the 10sma may just catch up to it. I also think that VALE and CLF may be waiting for the next run higher to join it. They are coiling along the 200sma.
.
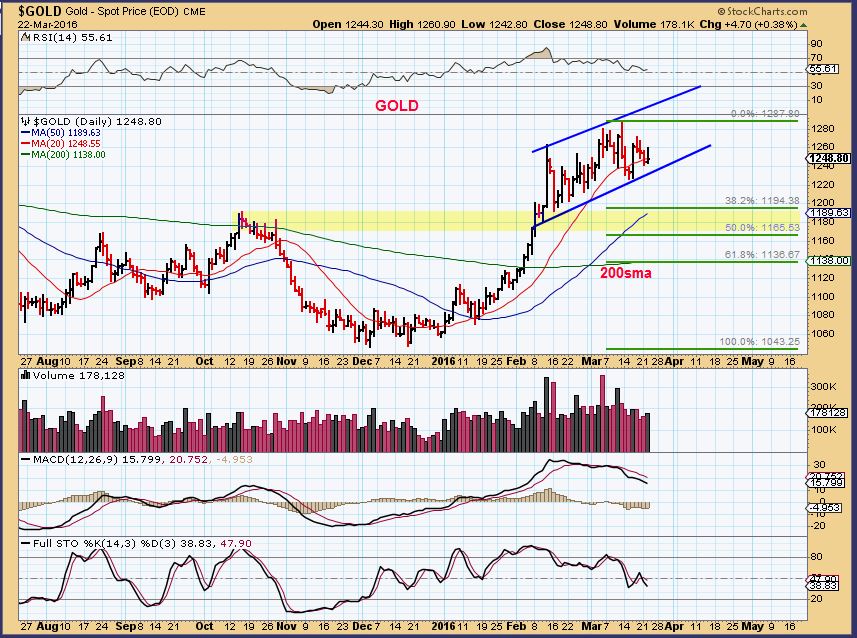
GOLD – No real change here either. I want GOLD to break below that trendline and drop to the 50sma ideally. ( $1190).
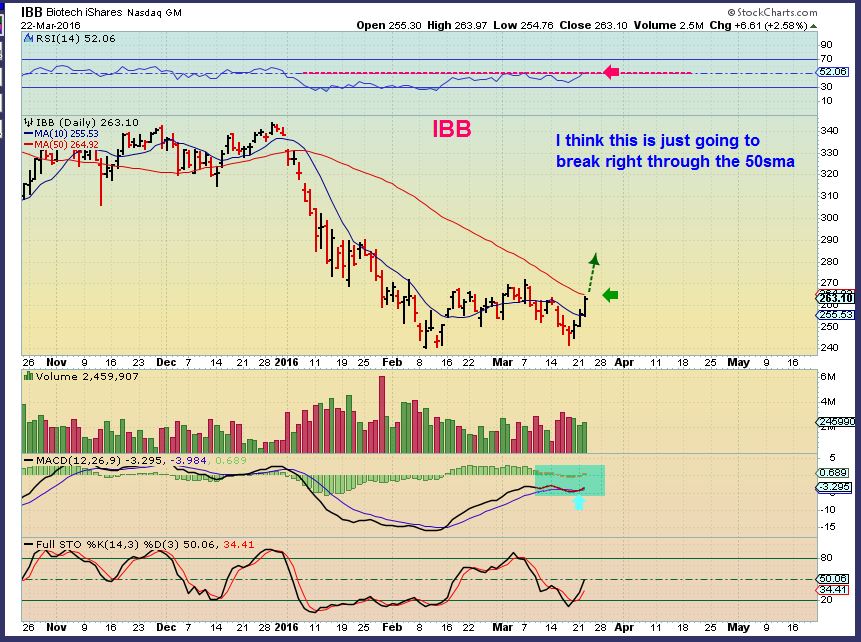
IBB – This still looks like a bullish double bottom, and it looks like it wants to break out. Individual stocks are acting well too.
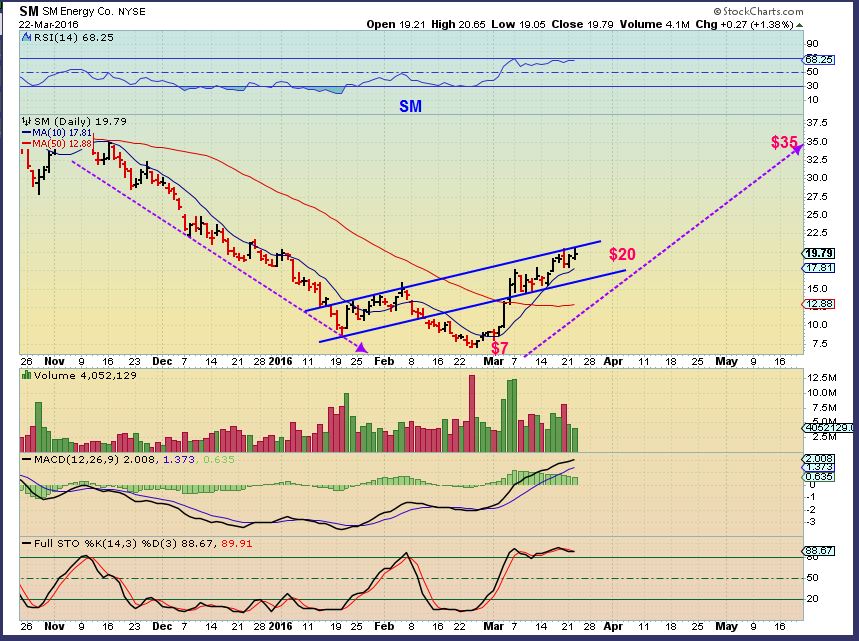
SM – Mentioned here March 11 as a leader
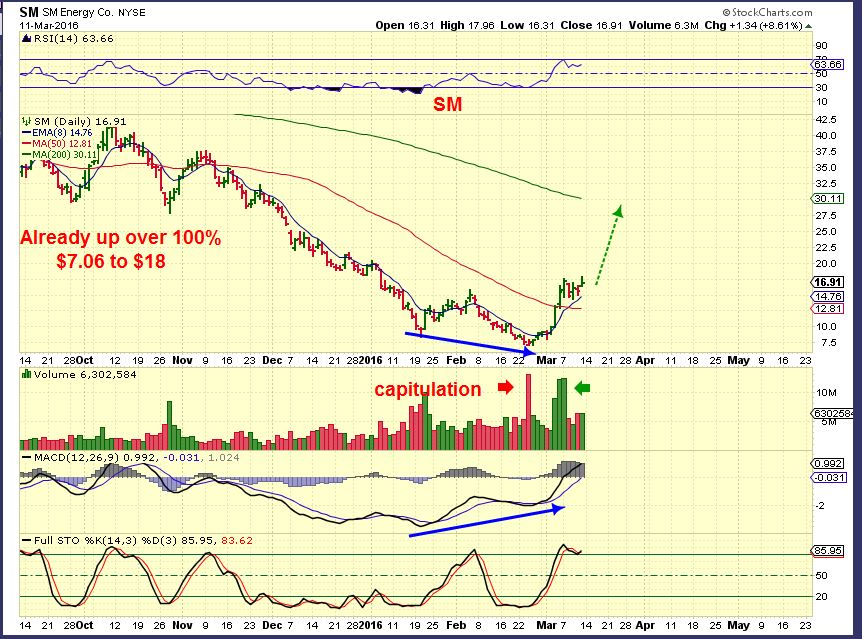
SM – It continues to move higher
I still like the looks of many of the charts. See for example MACK, CGIX, RPTP, and I like the volume on BLRX.
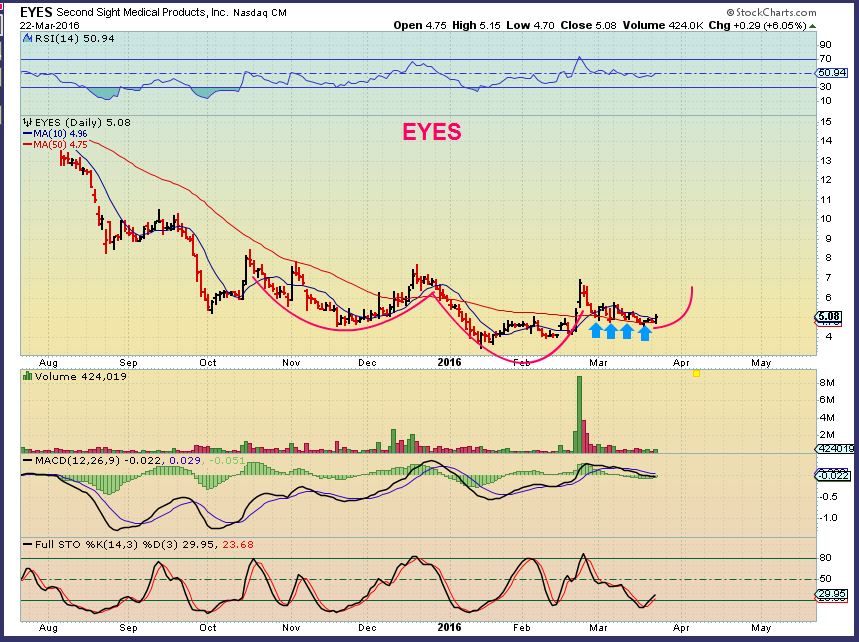
EYES is setting up too.
RISK on each of these stocks is HIGH for reasons mentioned in prior reports. These set ups are for experienced traders only. Small positions, nimble fingers. ETFs are safer for others. XBI, BBH, IBB, and LABU is the 3x etf , trade-able, but dangerous in its own way (Decay) .
.
SO I wanted to revisit 3-D Stocks. I had mentioned in JAN and FEB that they were starting to look bullish. They really did somewhat lead the way down. They rocketed higher in the bullish days, and then sold off relentlessly. I pointed out a while ago that they looked to be bottoming, but I didn’t buy and hold any. They were trade able bottoms. Well, they are still looking great, lets review.
.
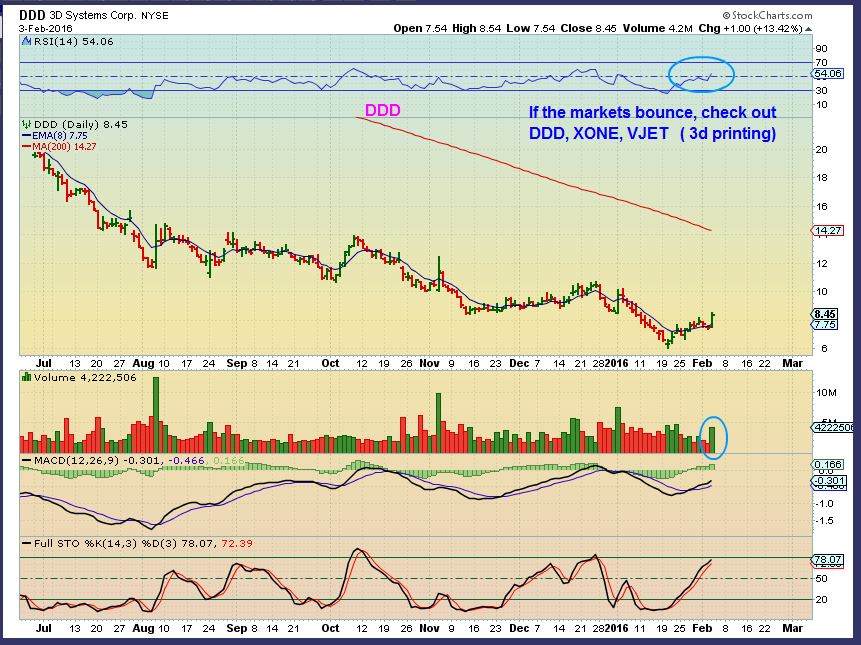
DDD from January. Nice setup, and a nice POP with volume at $6 to $8.00. I mentioned other 3-D stocks to follow too.
.
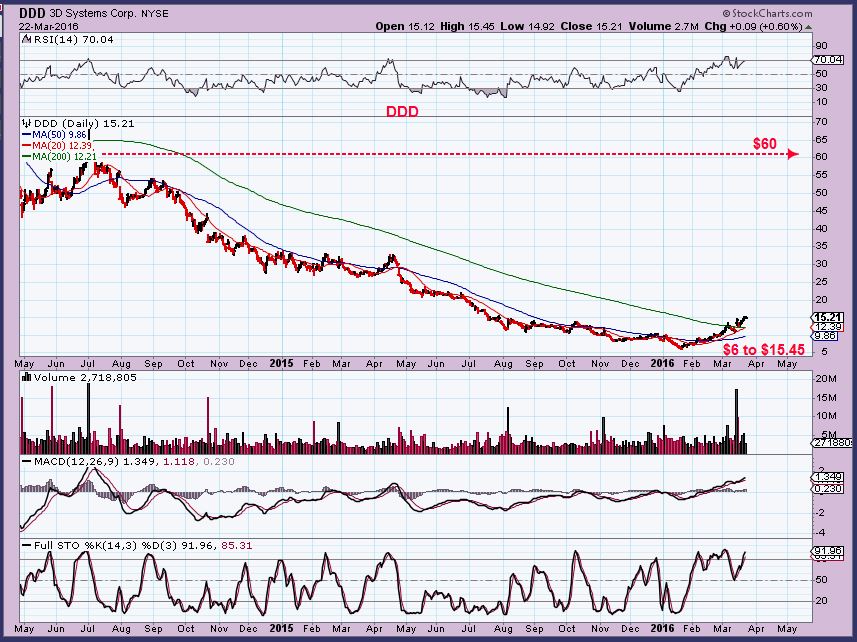
DDD – It is above $15 now ! It hasnt been holding back. It rose to the 200sma, paused , and it is now over $15. This has PLENTY of room to run if the markets decide to recover.
To save time, lets look at 2 weekly charts and see what a couple of the others have done since January.
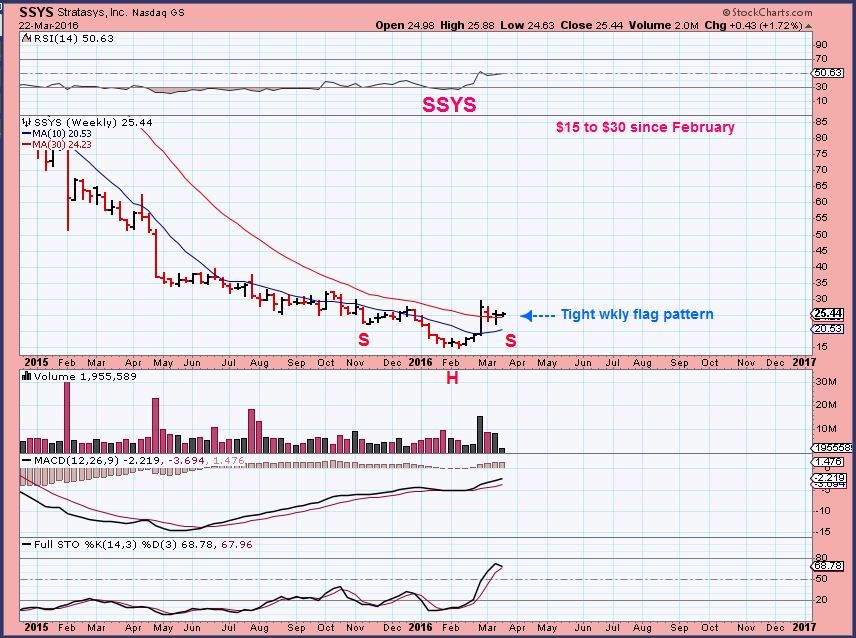
SSYS– $15 to $30 and also looks like it is just breaking from a base. It has pulled back and is in a bullish flag pattern. This looks about ready to take off higher again.
.
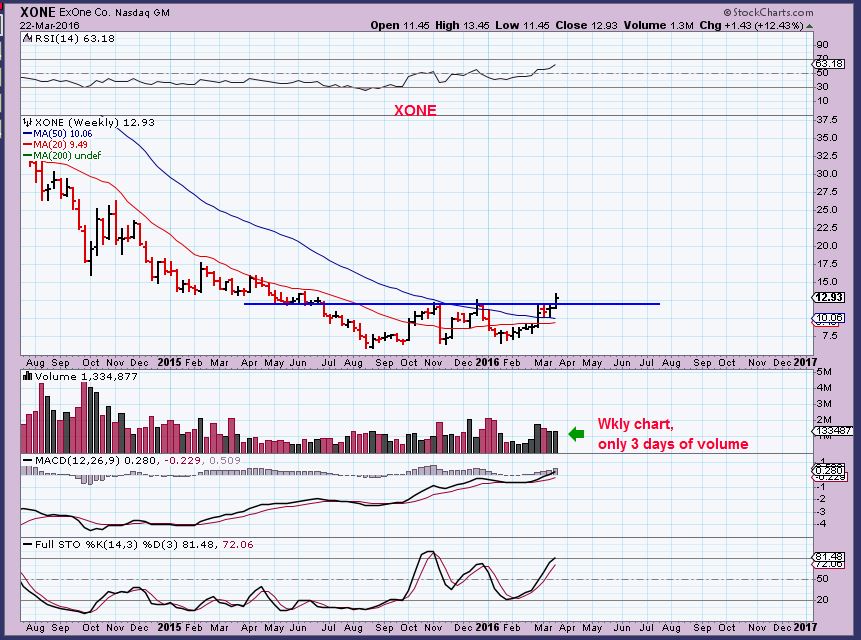
XONE WKLY – This bottomed out last summer and formed a base. It looks ready to break out now.
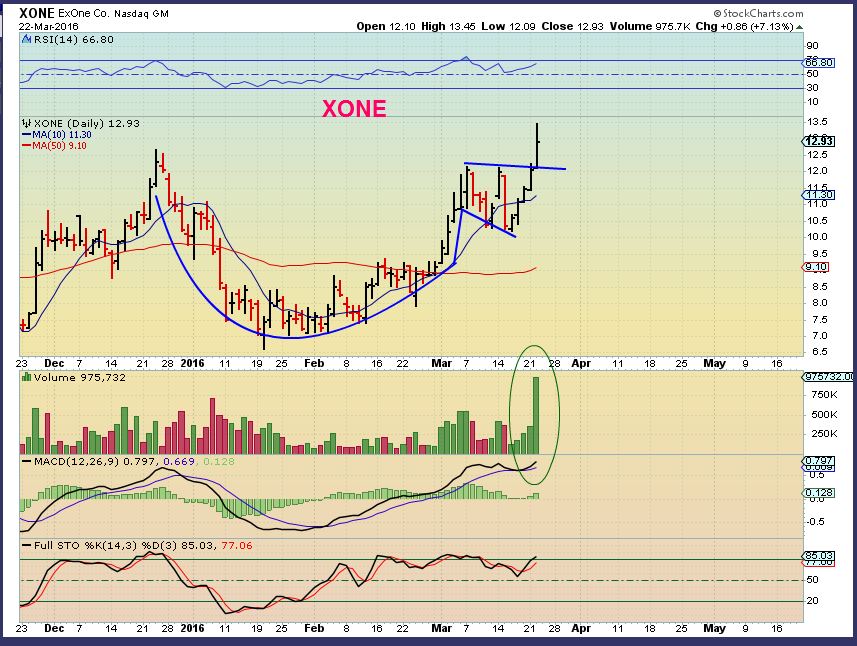
XONE DAILY – And today was a break out. We might get a back test when the markets pull back.
.
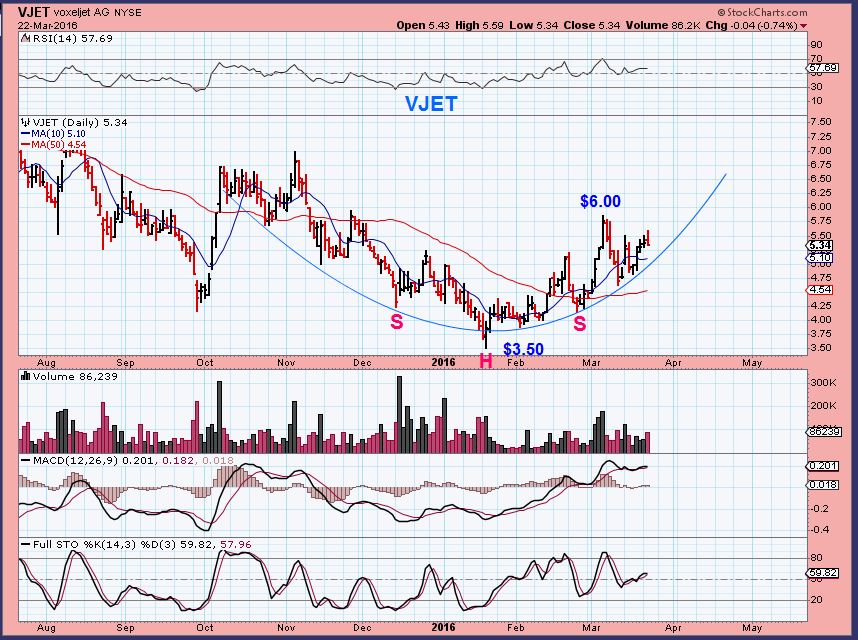
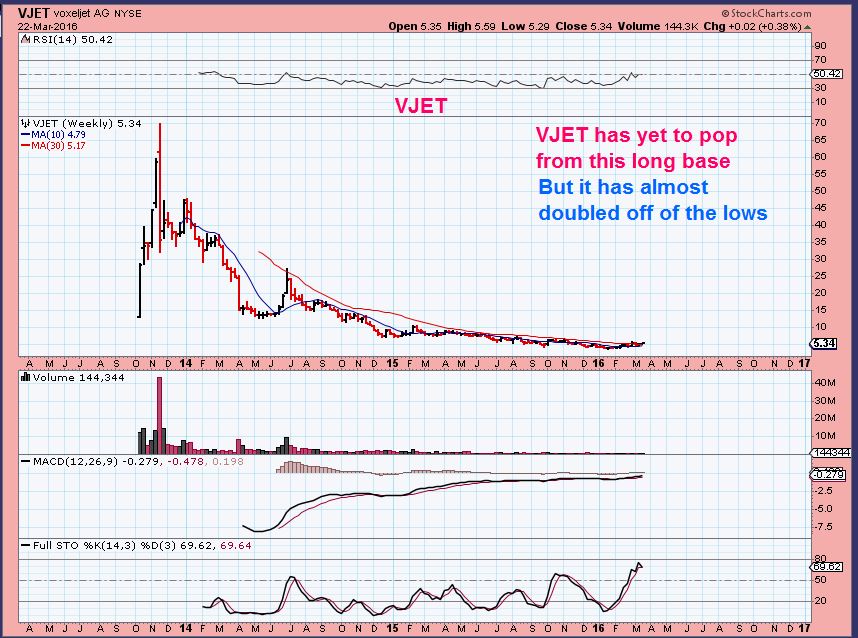
VJET – This is interesting. It has also almost doubled, but it hardly looks it on the longer term chart.
This was FEB 4th, I pointed out that it was breaking out at $4. This was a buy.
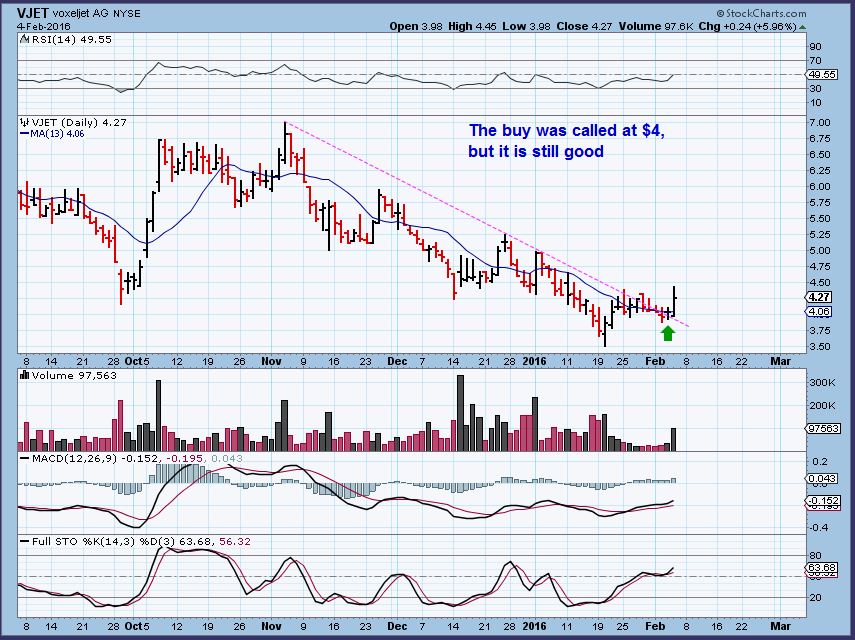
VJET – It has continued higher, but this is a Rough Ride. Take some Dramamine for this ride. It currently looks like it may drop to around $5, and then it looks set to move higher.
.
VJET – Amazing looking base. The upside looks huge if the 3D printers continue to move higher.
.
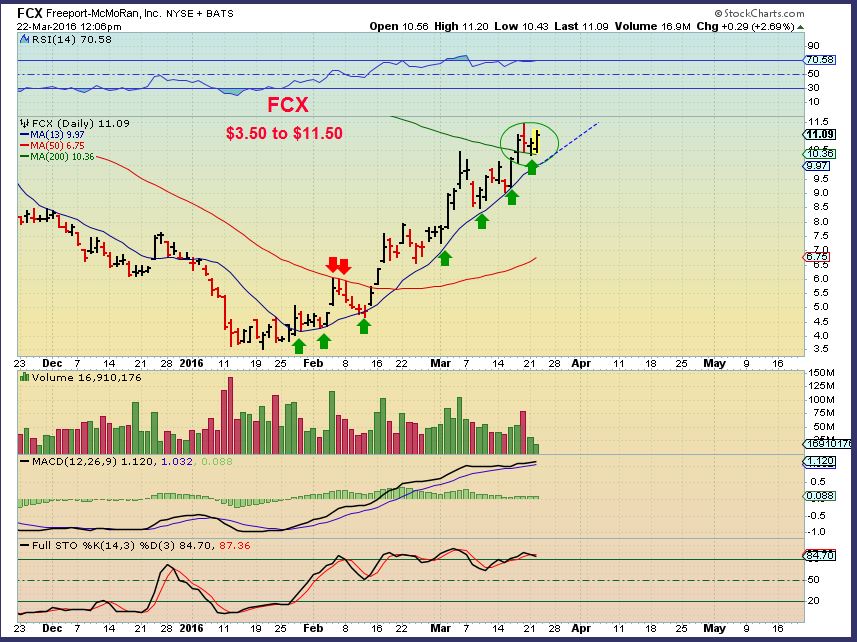
So I am still expecting a pullback in the general markets soon, to a daily cycle low. Then I expect another run higher in the 2nd daily cycle, and we’ll see how that unfolds. The CRB may already have put in a DCL ( Daily Cycle Low) and could be setting up to run higher soon. This should help commodity stocks to continue their moves higher ( like VALE, CLF, CENX, etc). X, AKS, FCX and a few others never really stopped moving higher.
Notice how FCX just climbs the 13 sma. It has enjoyed a beautiful run higher.
OIL is going sideways, NATGAS may have tested the trend line and put in a reversal Tuesday. Both OIL & NATGAS can be swayed by inventory reports, etc . Oil is released on Wednesdays and NATGAS on Thursdays. Gold and Miners are still holding up, some Miners are still making higher highs. Experience has been that being patient allows the trades to present themselves, so I am waiting for a pullback in this area too.
.
BASICALLY, on Monday and Tuesday trading, nothing changed from the weekend report. Patience is a virtue here, waiting in cash can pay off. ( Along with cash, I am also holding VALE, CLF, RPTP, LGCY and a few core miners in another acct, patiently waiting for upside action there too, with stops in place if needed 🙂 ) Thanks for being here!
.


Hey Alex, take a quick look at GENE, looks good to me but, that isn’t worth a pounds worth of $h!+
Hi Steve,
yes, I dont know about the company itself, but that does have a nice basing pattern and then a decent volume pop ( Usually indicates that there may be follow through and a break from the base). November had some huge pops, not sure what ws happening there. So I agree, the chart looks pretty good, but the company may be a pile of manure 🙂 I’ve seen a few companies with failed efforts.
I added a chart here, Steve
.
F.Y.I. – Someone sent a question to “Support desk”. That is not me, but the question was relayed to me saying that some do not know what I mean by “refresh” when I ( or others ) say that here in the comments section.
When you comment and add a chart or attachment, the words of your comments always show up, but the charts do not unless the page is refreshed . You have to refresh your browser to see the chart.
Some will write “refresh” to indicate that they have attached a chart.
YAY – Gold if finally breaking down below the lower trend line.
Surprisingly %R is already near oversold. 38.2% might be all we get at $1194!
woo hoo …
yesterday i was mizzy cuz I couldnt find a trade i ‘luved’ to take …
today im a bit happier …. #LotsOfRed #iLikeCash
*tho i did snag a little DQ… yes, no, spank?
#Yesplease
**grin
SIFY..hmm
sup with trucking&ground freight.. poppin
CVTI USAK etc
Getting buy list ready…!
Morning all. I was just noticing some familiar patterns in the SP500 and XLE. They have been moving together, so get ready. Harmonics aren’t real good to act on until they form fully. When they do they usually prove out. Attached are links to Harmoni patterns in SP500 and XLE. If you can see the Harmonic pattern, you can see that we are near the end.
https://www.tradingview.com/chart/SP1!/9wgy7HyX-SP500/
https://www.tradingview.com/chart/XLE/THCeI7cf-XLE-Energy-Sector/
Good.morning everyone!! Hope you all have a beautiful day! Reminder: if you took MU for a trade, earnings are due next week. Last few qtrs stock has gapped down on earnings.
Ok so I’m catching finally a pattern with Alex. His predictions don’t play out instantly but 3-5 days later. I love it it’s like we get an early buy of what this guys sees. Please keep up the great work.gold, Spx, vale miners etc are all playing out as he said last week. Including moving avgs, trends and patterns
… yeah .. he’s “OK”
….once in a BLUEEEE moon he gets stuff right …
Alex,
What is the read on gold and silver miners. Start of a correction?
yes
Been awhile since commodities got rocked across the board like this. Not buying the dip yet, gonna let this play out more. Stopped out of DNR this morning – mad b/c I coulda/shoulda ejected Monday for small gain instead of hoping to stay above stop.
So, at this point essentially out of energy with exception of BAS, planned as longer-term play. Bought back 60% of calls I sold last week for half the price, holding a few still for downside protection.
These sharks love to take people for a ride with the 3x etf’s. It’s like an Orca tossing around a seal before it chows it down! XBI getting sold back with a vengeance, after it broke above its 50 day with force yesterday. But if you look at LABU, it finished the day RIGHT AT its 50 day sma, and getting getting shoved back. So if you analyze the sector etf, XBI, and trade off of that the 3x etf, yesterday gave a strong buy signal by moving above its ma with force like it did. But if you go by LABU, it never gave the buy signal. Thankfully, saw that in real time and went in small. Sometimes you can’t help taking the bait. It’s like taking candy from a baby for these guys. I wished we had it that easy!
Bound to have some down days. I still like the Pharma sector. I think it will rebound. ENERGY and GOLD, correcting.
Of course there have to be down days Bill, but sometimes you see something happen on a chart near a point of possible reaction, like a major ma, that really makes one shake their head. Thats what I mean by “them” having it easy. You and I, and the rest of us are like Remora fish. We try our best to make an educated guess as to which direction the big money is gonna make a stock go, and we latch on for the ride. These guys that make the market though, how powerful do you have to be to make a market go up or down as you wish? To me, it’s incredible the power these guys have. But although it may sound like I’m bitching, I’m really not. It just never ceases to amaze me, the power these people have. It’s called getting your hand caught in the cookie jar, thats all. I was just making an observation. Thanks for the reply, as always!
Ya, I know it really sucks. I knew energy sector was getting weak, I sold some but kept others, Should have sold it all. Now I have to pay.
I know, I did the same…sold some, kept a little….it will come back up! Just think of all the good buys out there now……now, if I only knew exactly when to jump back in………:)
Too Early, wait a while
Thankfully I had sold all my ERX last week at resistance. Replaced it with LGCY and ATW much smaller positions, just in case there could be further upside. Sold.out of those today for <10% loss. Bought small ERY, BUT not totally convinced that could be a smoith ride either. We might chop around and frustrate everyone. But as far as energy, I'll be long again once price can break above a slew of resistance right above here. So far it's proving a tough nut to crack. I am most bullish on miners because they are above the 50 week. Energy and other commod's, not yet.
GDX not even corrected 38% yet. Wait for it to get under $18. You want a smooth ride in Energy get XEL or XLU both were up today? Amazing.
wow… nice
I’m not buying miners here, just holding my core, and will add when conditions are right. Those are hedged right now, so no big whoop. Sitting on plenty of cash for when the moment is right. Not there yet. Still need to see more proof of how this has better odds of.playing out, the overall market, to be bullish or bearish overall. My bullishnes towards miners is because of them having based for a long time, and moved above MAJOR resistance at the 50 week ma against the SPY and NYSE. Other markets are yet to do this.Energy is.the closest other, but still below that 50 wk..XBI still has a lot of ground to make up to say its bear is over longer term.
XEL and XLU are both in an.uptrend and above their long term ma’s. Above those you have *better* odds of money coming.in and supporting.price, while under those ma’s you have better odds of being sold down. In my experience anyway, and in the context of a medium.to longer term trder/investor, not short term trader.Good work spotting that Bill. Thanks.
You only buy stocks above the longer term MA. What do you look for? 50sma? 20sma?
Good morning Bill!! Sorry for the late reply, hadn’t checked in since yesterday. I have found out that what fits my personality most is a longer term outlook. I tried being a short term trader and was unsuccesful. I guess if I really wanted to be succesful at short term trading I could be, but I noticed that the level of anxiety and the attention you have to devote to charts everyday was something I really wasn’t interested in. I have my own business, which basically takes up most of my time in the day, and 2 young children that I devote basically all evening helping with homework and other things. I love spending free time with my wife and kids. This was the most important fact in putting me in the track that fit better what I am trying to do, which is to have the right balance in life. Short term trading put me out if balance. Longer term time frames move a lot slower, and IMO, are a lot more reliable. One of my mentors, an old friend who’s worth a staggering amount of money, always told me to stay away from making too many moves. He told me “the more moves you make, the more you play into their game”. This has always stuck with me. A longer term outlook keeps you in the long term trend, and thats where the $$$ is at. Sorry to have given you such a long explanation, but it’s just an insight into what and why I look at mov averages how I do. So to answer your question, I consider the most important data in a chart to be where price is relative to the 50 week sma. Above it, and odds are high you have a bull, below it, odds high you have a bear. If price breaks above it after a long bear, like gold stocks have, with force and volume, after a ling basing period, thats a powerful buy signal. Any.move to retest that ma or ma’s below it, is a chance to add. This was also the major sell signal for gold stocks, the move below te 50 week, that sent them into the bear. I do, however, use also the 50 day sma. That gives you access to trade to counter trend rallies with little whipsaws within a major trend. The shortest term ma that I look at is the 20 sma. I could make a small buy above there and add above the 50, and monitor from there with macd, rsi, etc. But if you look at most charts that break above or below their 50 week sma, you’ll see that even with counter trend rallies, you would have stayed with the long term trend. That would have make very few moves, with a very high profit potential. Look at GDXJ, XLE, IBB, or any other stock. Had you sold short a small amount on a break and close below the 10week sma, and added on a close below the 50 week sma, the gains come by staying with the long term trend. Same goes for the upside. Sorry for the length Bill!! Hope you’re sitting comfortably!!
miners and steel contending with or well above 200-day. Oil plays arent even close. Run a gold:gdx comparison and then wti crude to XLE. Big difference!
Yeah, I had same issue. I could have taken DNR off the table, I mean it looked weak to me, grab lunch money and save myself the loss. But no, needed to be a pig… I took most others off last week. But I got drug in CLF and VALE. Remember the comment about riding the ‘wiggles’? Yeah…
The unexpected large inventory build from EIA really slammed oil below $40. I am very interested Alex, if today’s close on WTIC below $40 revises your oil expectations? Or too soon to tell yet?
Hi Ms C.
I gave a few charts with oils possible path. A couple showed Oil dropping under 40 and going sideways. Time will tell how the drop unfolds, but todays move by oil didn’t not change the expectations in those charts in this report yet, but we may be dropping into the dcl. That could end at the 50sma
Thanks so much! Still trying to learn to remain unemotional when these drops happen and so appreciate a voice of calm and reason. Listening to the news/CNBC or reading posts on ST on these volatile days can be unsettling when you have long positions that take hits – but you want still to hold on to a core. Appreciate all the great work you do 🙂
And just took a closer look at the second scenario for oil…
I looked at it yesterday but did not really “see” it. Now I do.
This is so true. I read ‘stuff’ or see commenters on CNBC and it can throw one off for sure. I have just learned to ignore them over time by seeing how emotional and excitable they get, and how it can alter their analysis.
Just wanted to tell you that effects the rest of us as well. I’m really working this year on discipline and having a plan and trading it until priced wrong. In the past I have seen big drops and made emotional sales and purchases and most of the time they end badly. We have to stay in the know, but remain emotionally neutral and we ALL struggle with that.
These drops can’t be avoided … What is infuriating is more often than not, they wipe out a physical stop I have in place, and then… A few days later the stock often bounces back. I feel I am fairly solid in my buys, but selling is much harder — especially when fear or greed messes with your mind. so so difficult in this market to want to build a long term portfolio with commodities — and at the same time trade them. I admire Alex in that he is able to do both.
FYI – I RELEASED A NEW REPORT AT 8 A.M. , BUT THE AUTO ALERT BY DISQUS HAS NOT SENT THE ALERT YET. TWITTER HAS
Alex,
Your Gold chart looks to me like a cup with an elevated handle. Looks
to me like pullback to 1200 and then move to 1340. Measuring cup from base of 1060 with lip at 1200. I am still siiiting in your GPL recommendation since .55. I think you exited at .75, but I remain looking for $1.40.