
Calculated Risks
Nobody wants to take unnecessary risks in the market, but the saying “Nothing ventured, nothing gained” applies too. So you have heard me mention looking for “Low risk entries”, but what is that? It is timing an entry where the risk to the downside is minimal, and the gain on the upside outweighs it. We will discus that further later in this report.
,
SPX -Friday is Quad witching. The Fed didn’t kill the markets this time, but that wasn’t a very convincing push either, was it?
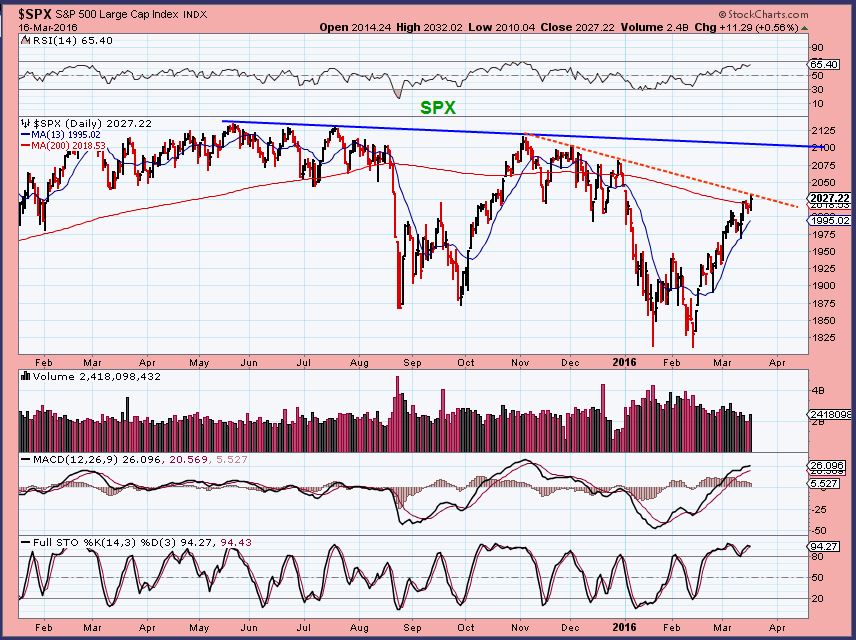
I still see the rising bearish wedge for the general markets.
,
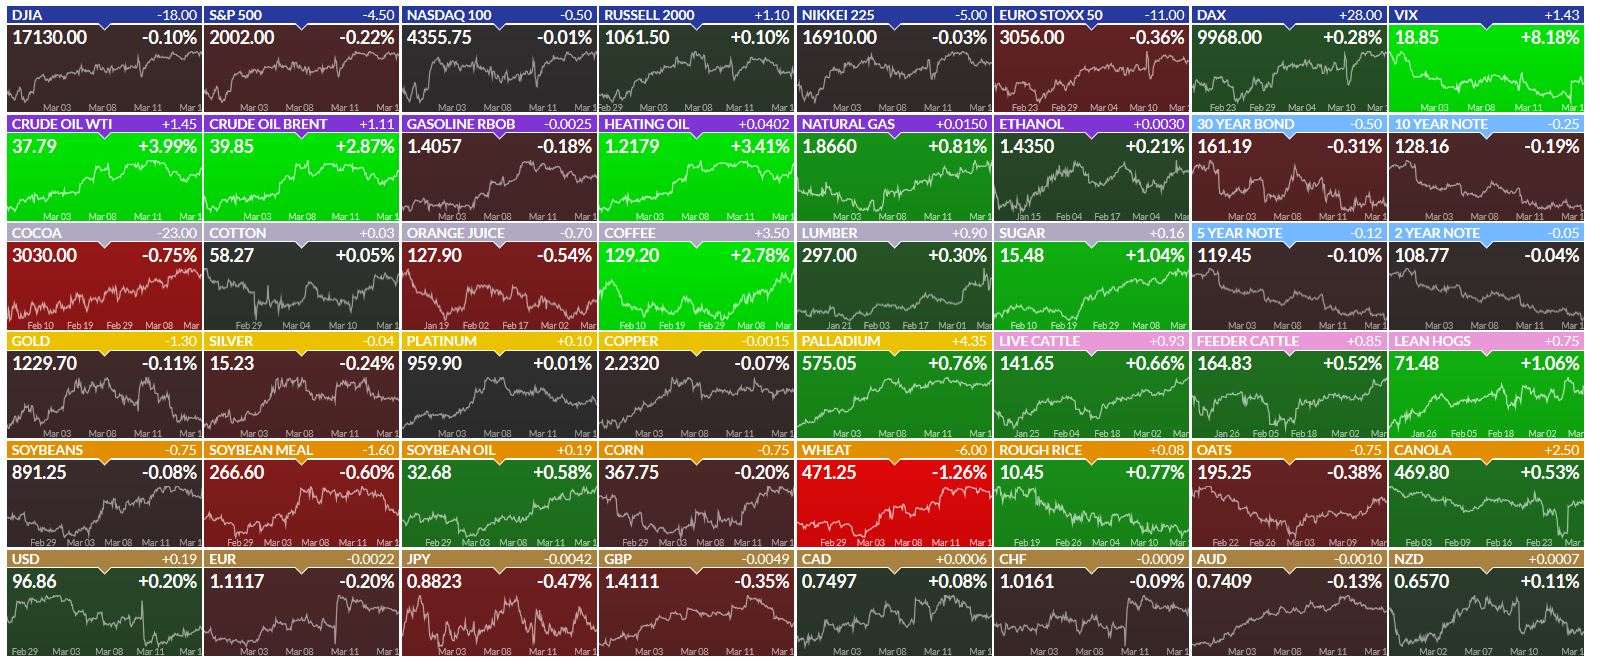
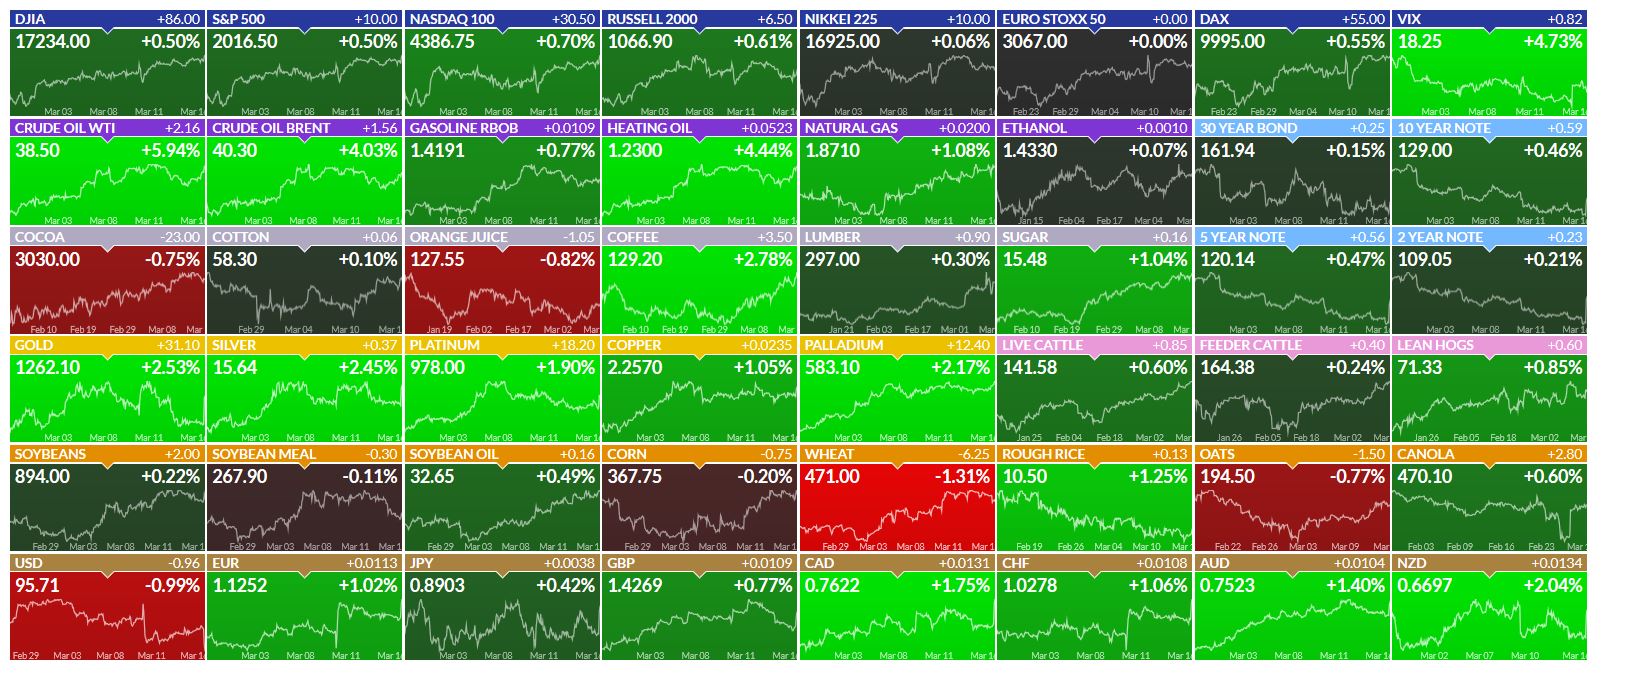
So, lets take a look at PRE-FED and POST FED results. Looking at the following 2 snapshots gives you a visual of how things were affected by the Fed decision. For example The SPX was down a little before and up a little after. The USD from Green to RED. Commodities REALLY GLOWED after the Fed.
PRE- FED almost 2 P.M. Eastern
POST FED –
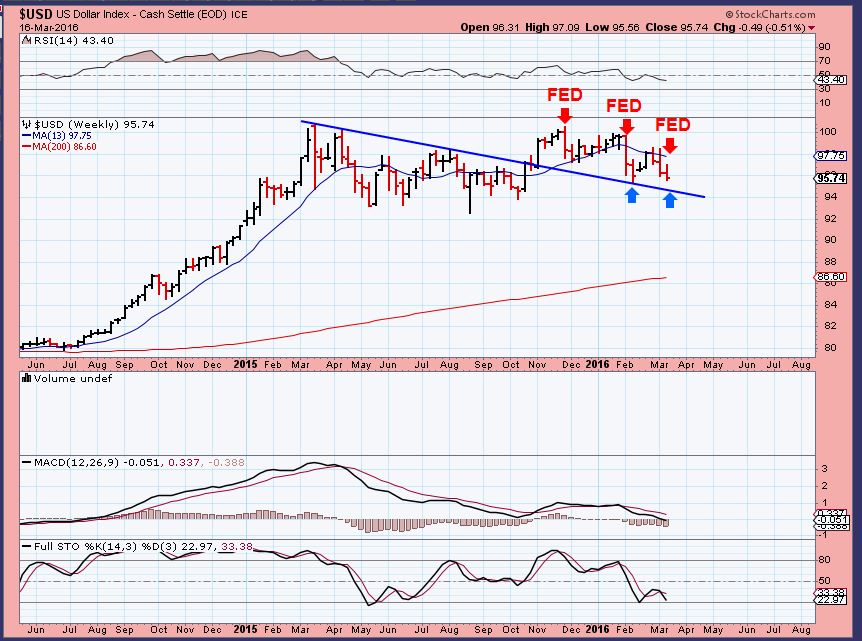
SO lets look at the USD. I said this weekend that the FED has been knocking the dollar down . I posted this chart of the Dollar from last week, expecting the same drop this week, as drawn.
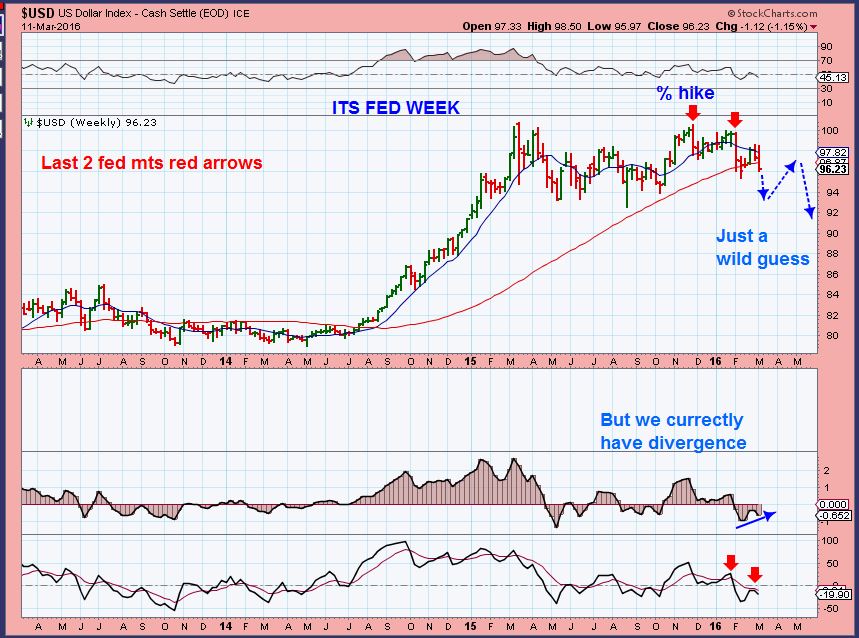
This is the DOLLAR tonight, with the Fed drop.
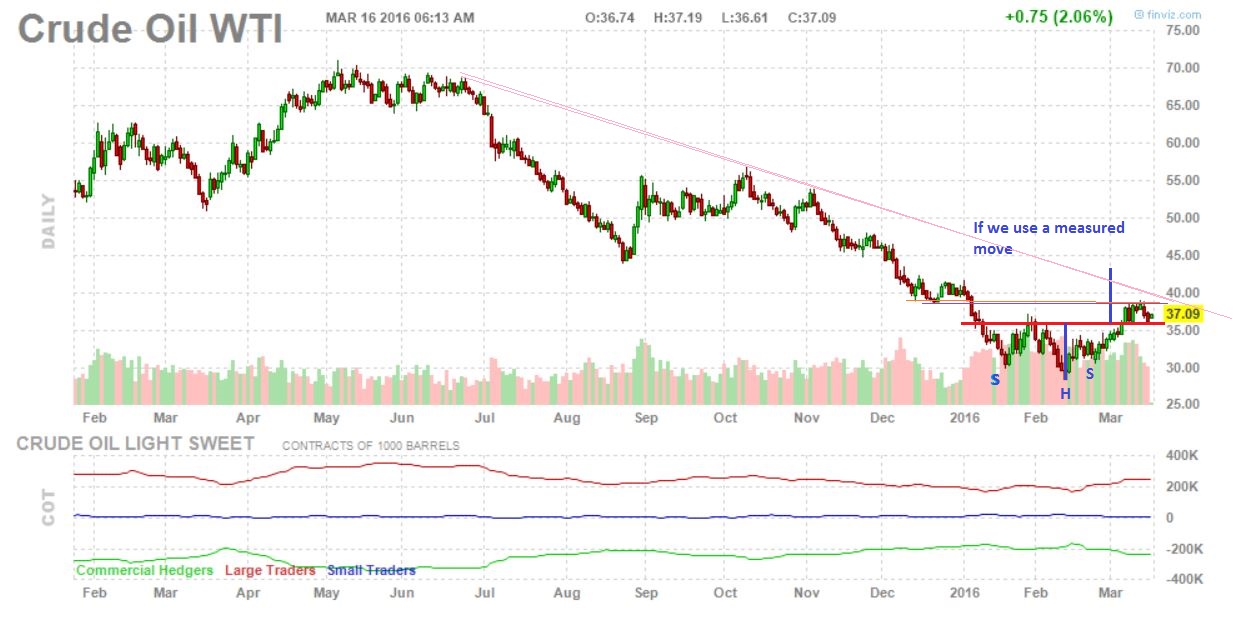
Crude in this chart this morning looked to be on support.
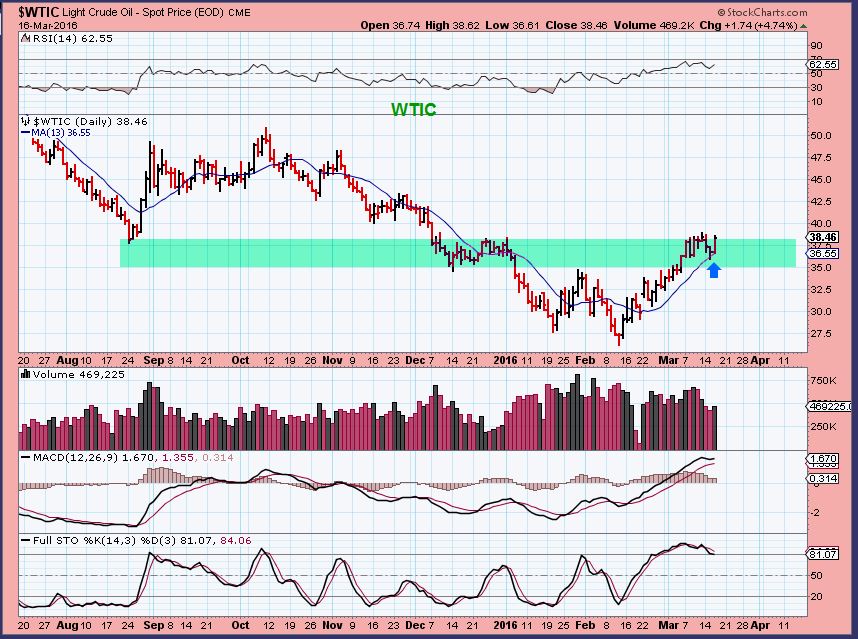
WTIC – Oil moved and closed higher today. Overbought, but that can stay that way. I mentioned that we may have seen a 1/2 cycle low and that may have been what we got.
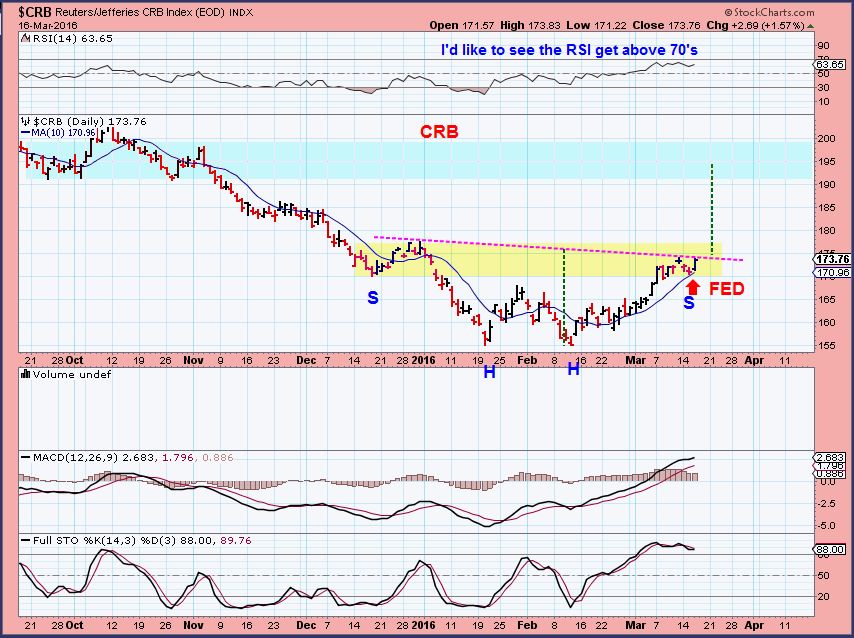
CRB – The commodities chart looks bullish after consolidating for a week.This can run higher now.
.
SO if commodities have consolidated for a week or so, and the POST FED REACTION was a lot of green for commodities, maybe they become a less risky trade to enter.  More on that later.
.
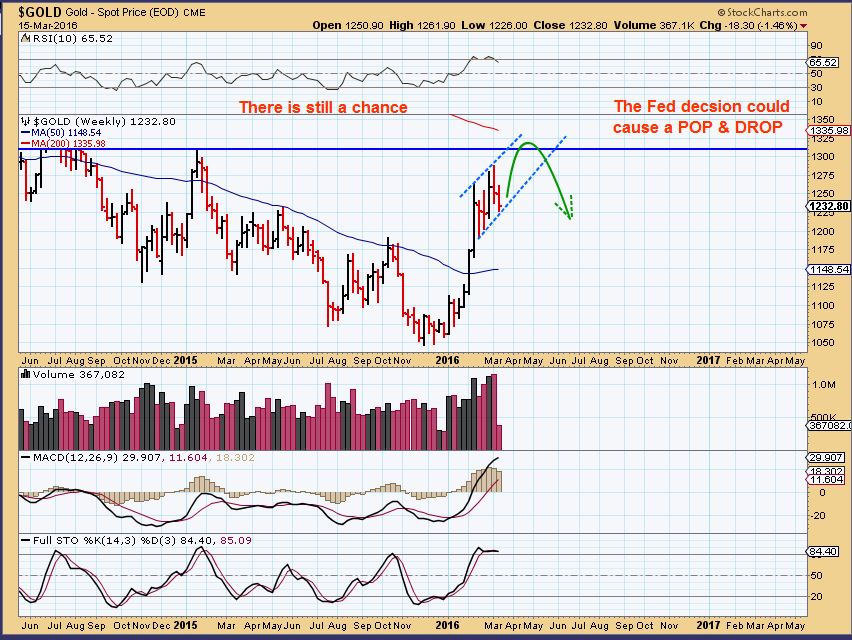
GOLD – I’ve been expecting a pull back in GOLD & MINERS to a Daily Cycle Low , after the recent steady run higher. There was a possibility that the fed would be Bullish for Gold, because it was on the last 2 mtgs (Dollar drop, Gold bullish). SO I did throw this wkly chart in to show a FED POP and a drop later.
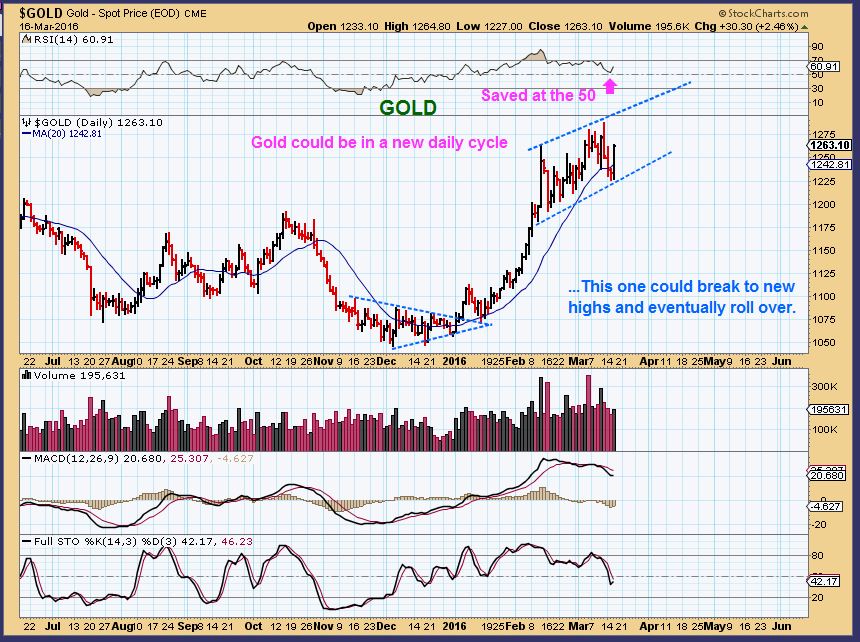
GOLD 3-16 – Quite the reversal. Likely DAY 1 of a new daily cycle. So this could run higher to that $1310 area and then drop to it’s dcl. CRAZY stuff 🙂
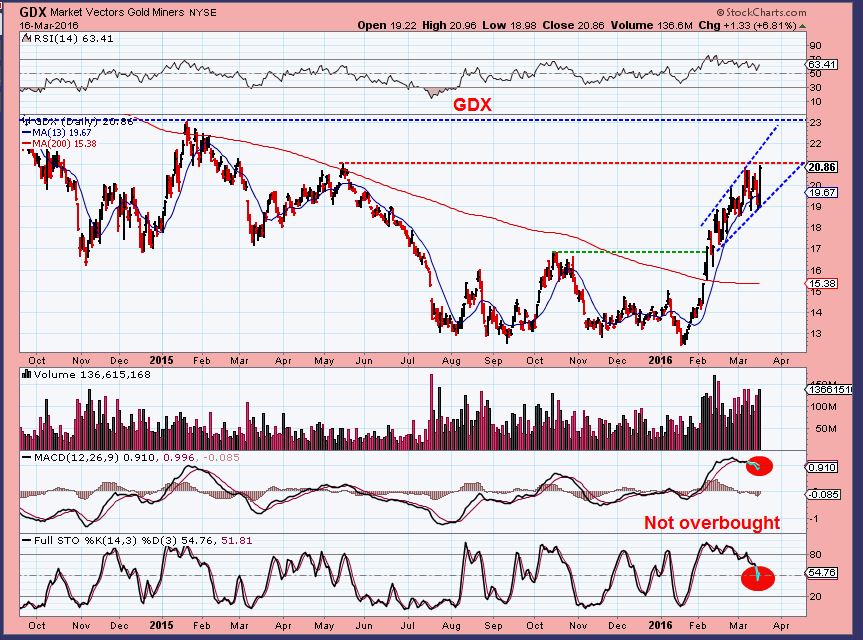
GDX – What a strong surge higher. Shorts got crushed again. I may have recommended selling miners on the way up, but I didn’t recommend DUST under these conditions. Dust buyers beware, right? Surprises to the upside again and again. The low 4 days ago was likley a DCL. This also has been range bound in what is known as a running correction. SO now Miners can run higher, but they are a bit more risky in my opinion, timing wise. Lets discuss that…
Lets Talk: TRADERS WITH SHORT TERM IDEAS. It becomes difficult for me to recommend buying extended stocks. A PULLBACK INTO THE NEXT ICL WILL BE A GREAT BUY!! Buying now can be risky , because Pull backs can come out of nowhere, but I seeing signs that we just saw a stealth daily cycle low. Even a left translated daily cycle can go higher to day 5-8 or so, and then roll over. SO Gold can run higher for a week or more, and I took a look at Miners individually. I found some that as a trader – strictly using technical analysis, I would buy for a quick multi-day trade WITH A STOP.
Examples:
.
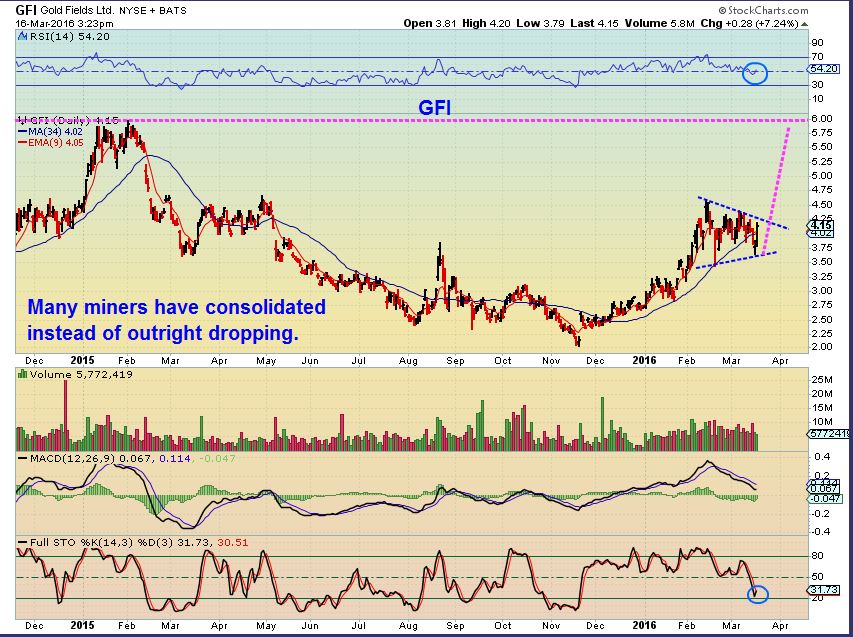
GFI– This is not extended. It has consolidated. This can run higher if Gold moves higher. And if GOLD goes higher and spends days at the top ‘topping out ‘, this can keep running.
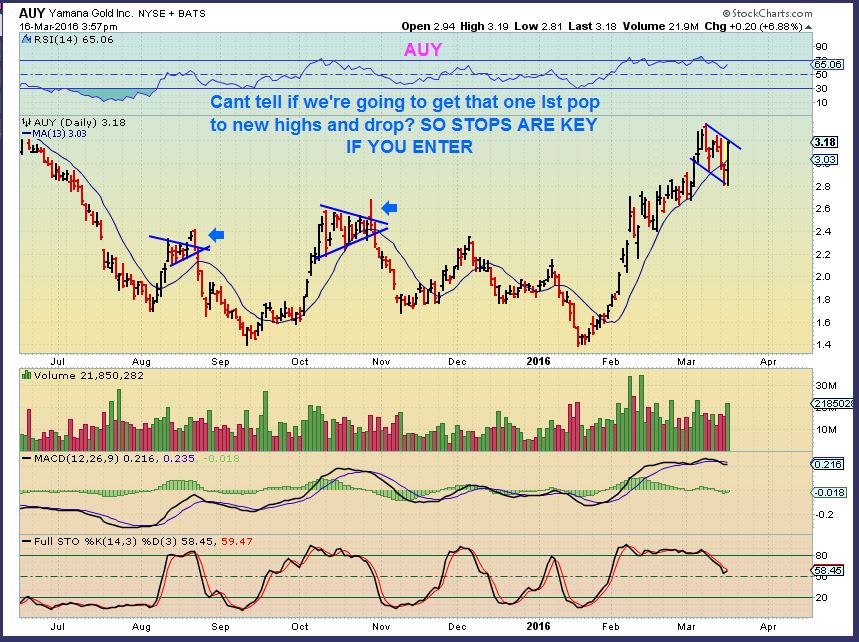
AUY – Was extended, but look at the stochastics. The consolidation worked off over bought conditions. I also pointed out that at prior tops, we saw that dreaded ” POP to new highs, and roll over”. WATCH OUT FOR THAT.
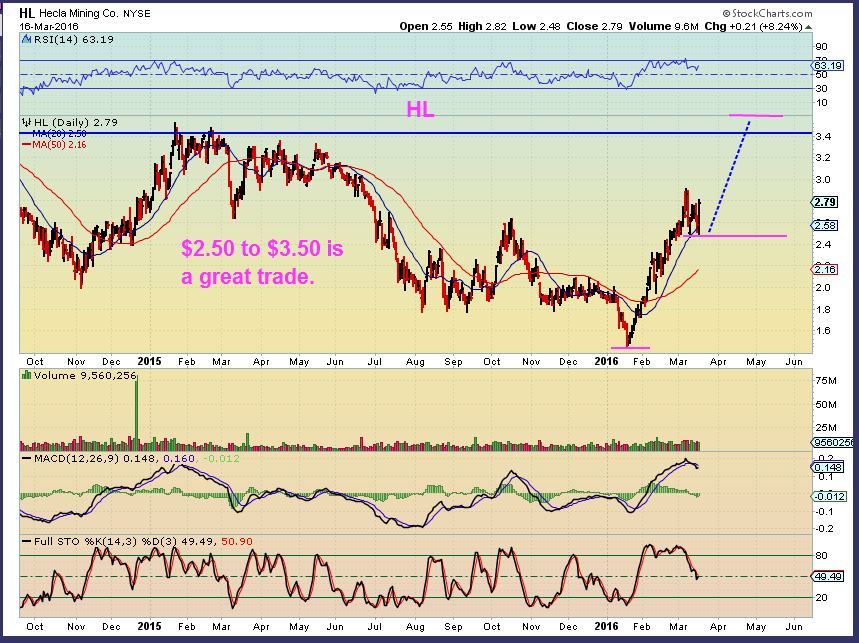
HL – Stochastics no longer overbought
SO there were many Miners that went sideways recently and took off the overbought conditions. They are a tad risky, but entries here for traders may pay off in a 5 day trade or so.
.
Lets also discuss that GREEN area that was Commodities / Oil . We may be seeing continuations in this area too.
,
How long have I been discussing VALE? Well, I’m not going to stop now 🙂 It is a good example of how you want something to act when it’s pulling back from a nice run higher.
.
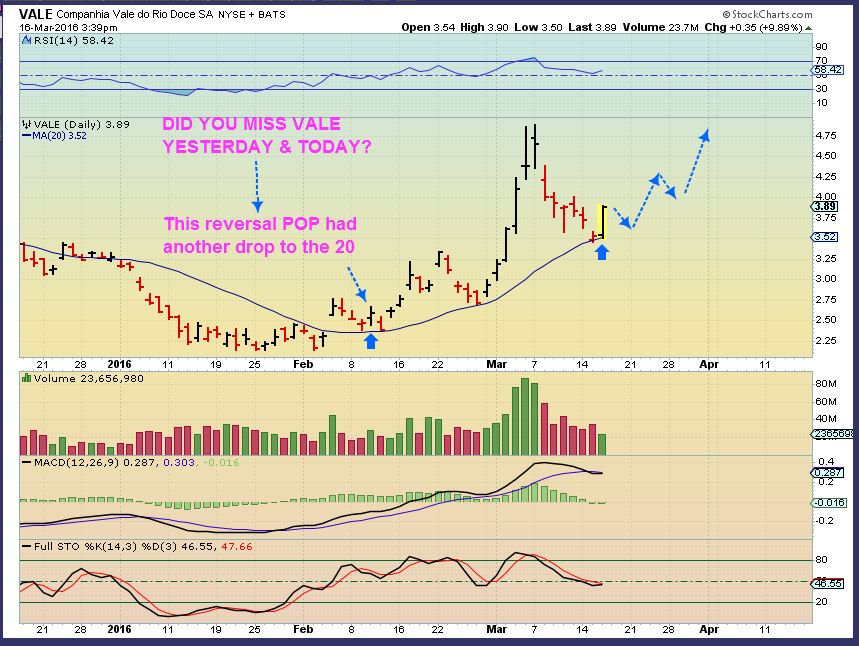
VALE – Vale pulled right back to the $3.50 area as hoped for. Today it took off after the Fed Decision. I captured this chart at 3:30, but it closed even higher at $3.99. So you see that it was a low risk entry, and this could be too. We may get a pullback in the morning, because many got overbought on the 5,10,15 minute charts.
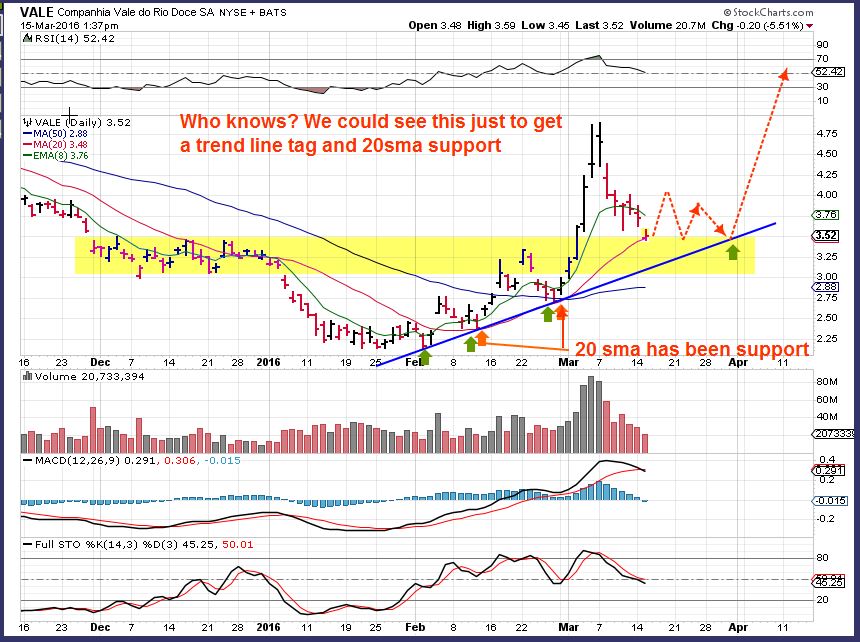
REMINDER CHART – This may or may not go right back up to the highs. It could play out in a consolidation manner as shown, but that was a nice reversal Wednesday.
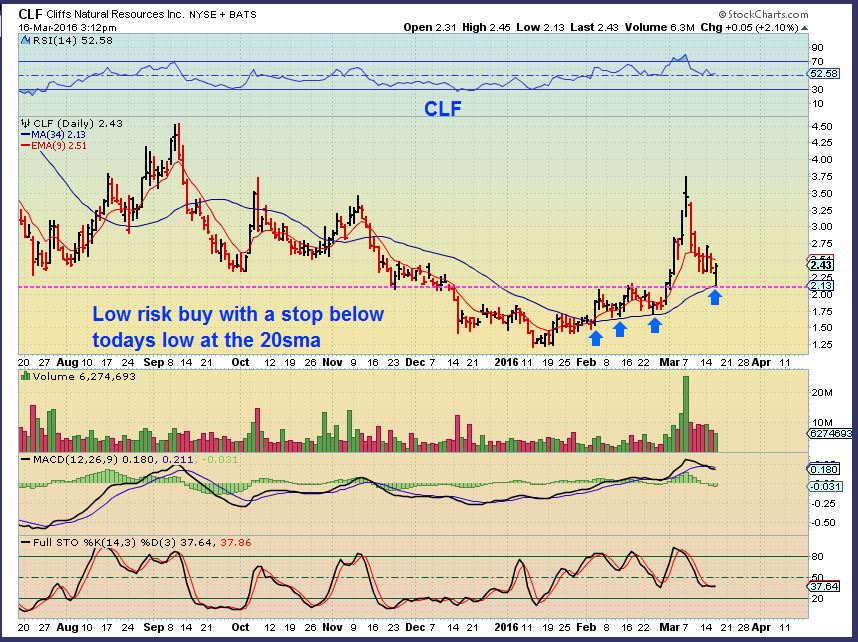
CLF – CLF reversed and popped higher Monday off of the 20sma. Similar to Vale. Did you miss the move? Guess what? It dropped Tuesday…
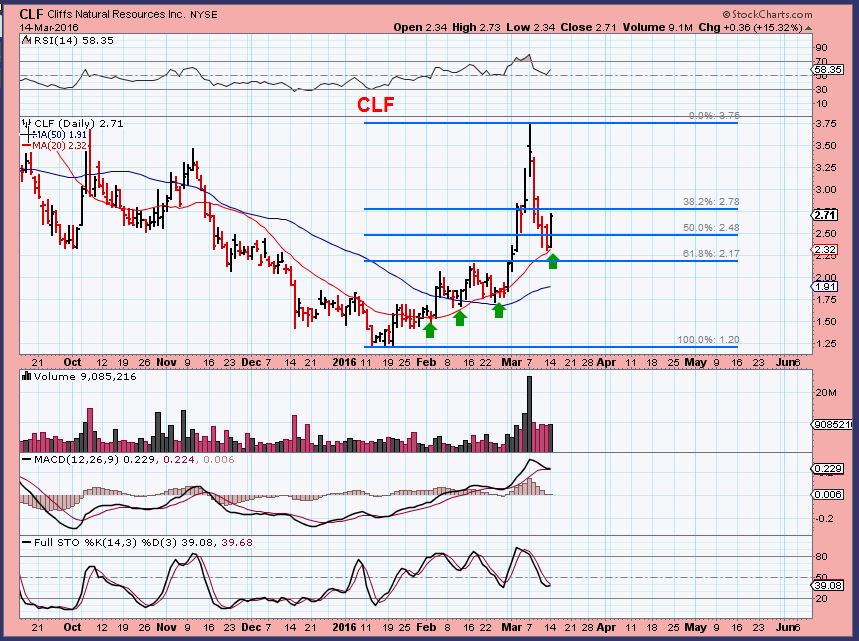
CLF gave it up Tuesday, reversed again with the Fed. You have a 2nd chance. THIS is why I didnt instantly write an “ALERT” after the Fed Speech . They POP and they can drop. There may be further consolidation or a little drop tomorrow a.m., but these are good entry points for starter entry points. I bought this reversal today.
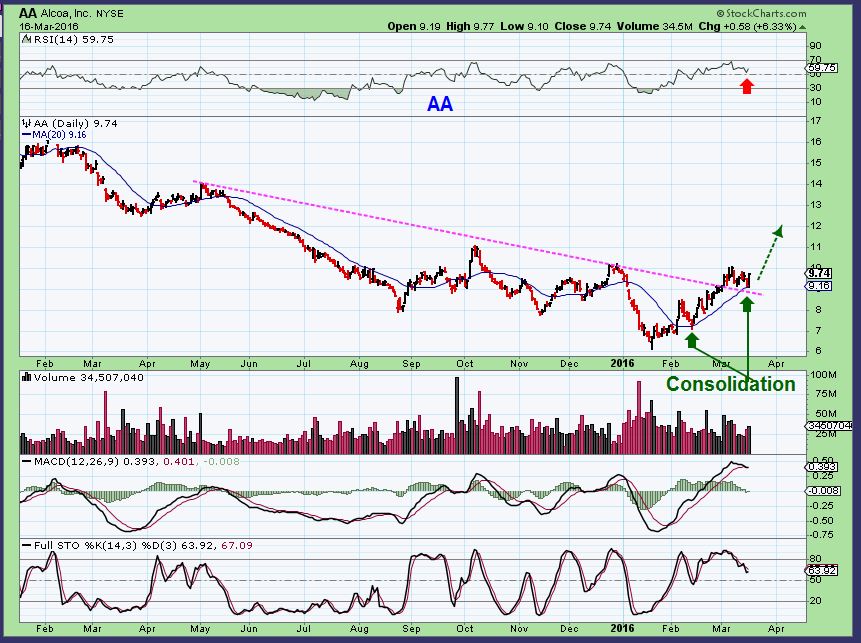
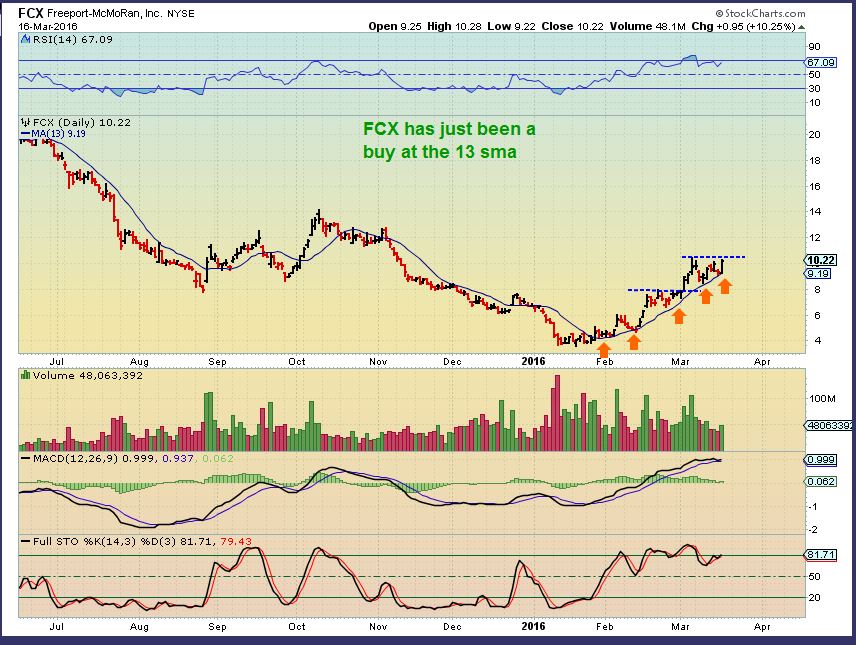
So we actually saw STEEL stocks move higher again last week and this week. Others like Aluminum, Copper, Iron Ore, etc consolidating , but now reacting are as follows ( There are many more, these are examples for you to know what to look for).
AA – slides on support, moves off of the 20ma.
CENX – similar set up

FCX – Run / consolidate / run / consolidate , etc at the 13 ma
So did you buy when VALE dropped to support? Did you want to wait until after the Fed? That’s O.K.
I’m thinking that maybe Thursday morning Some of these “POPS” could drop back in the morning from becoming overbought shorter term. Others may GAP OPEN, and drop into noon time to close the gap, etc etc. The scenarios are endless, but the point is, the FED Decision seems to be favorable for a continued run in Commodity stocks and they present low risk opportunities of you honor your stops. Many have pulled back and consolidated going into the Fed Mtg as shown. Now they may be at a lower risk entry point. OIL moved higher too, so we’ll see if some more of these Energy stocks can tack on some gains. They have pulled back too. If you didnt buy the pullbacks in commodities yet, this may be your day. Miners are for traders with a shorter term outlook, and Energy is setting up too. Happy trading!
.
~ALEX
.
BY request. Are these stocks still “O.K.” Here.
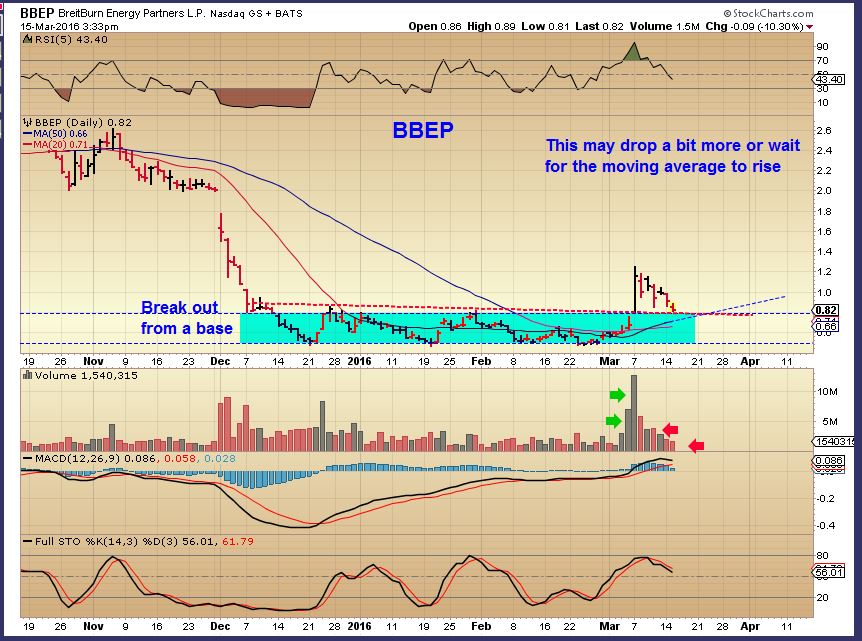
BBEP – So far, Yes
WKLY FROM March 7

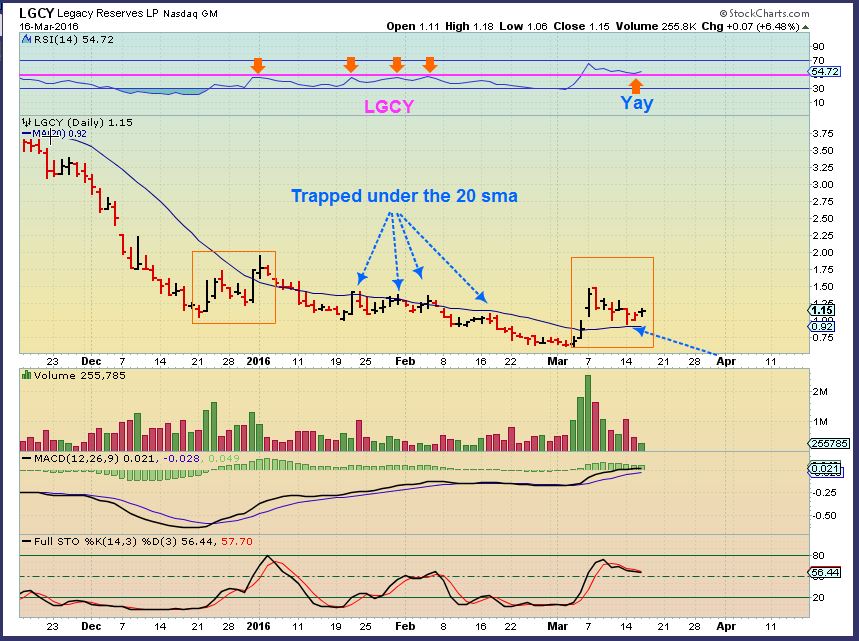
LGCY 3-16 …Yes, it is still acting correctly consolidating that blast higher. I’d like to see a repeat of that orange box. 
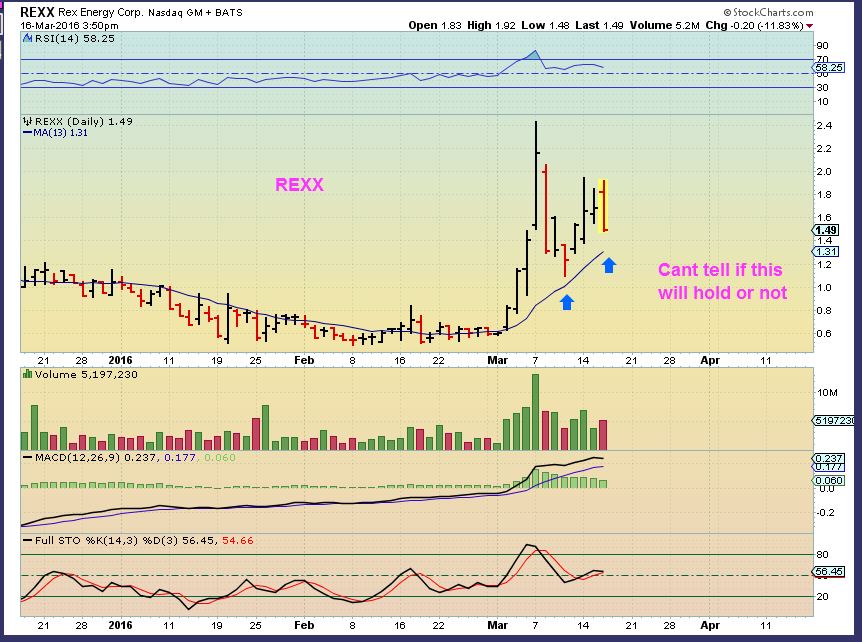
REXX – This one? I dont know. It looks like a bearish engulfing candle today. 6 days ago when it dropped like that, it dropped for 2 more days and then recovered. I wouldn’t buy it here yet, watch it at that 13 sma.

Just something to consider. Smart money likes to run stops and create an undercut bottom so they can enter as low as possible. A classic example was the January bottom in miners. They do the same thing at tops. They manufacture a breakout so retail traders buy the breakout and smart money sells to them ahead of the impending intermediate correction. Gold is 15 weeks into an intermediate cycle. Be mindful of a false breakout as a possible intermediate top.
And the dollar is getting very late in its daily and possibly intermediate cycle as well.
UGH
NIKE revealed sneakers that lace themselves up.
Man are we getting lazy, or what? – LOL
Lol that’s awesome like back to the future movie
CLF – Did the necessary gap fill and now attempting a break above the 200sma. Good volume and up 13% ( yeehaw).
Yay!
Wow, suddenly it burst through the 200sma and is up almost 20% at this time.
Hi Alex – what are your thoughts on ARP and BBEP? thanks!
Hi Tammy
I own ARP and I am mixed on it. It is acting correctly and remains bullish. The RSI turned up at the 50% line, that is good, but I hate this light volume. I also dont like the surprise that I got with SXE – so it heightens my caution in this sector ( SGY got hit too, but I didnt own it).
SO it looks fine, but caution warrented if your position is very heavy.
BBEP was at the end of the report. It is now up over 10% from that chart and it looks ok. same sector tho
Tammy – refresh for a chart
.
Thanks for the chart! You are a good teacher. 🙂
POT is a beautiful rounded bottom looking ready for a leg higher. That could be a volatility coil just below the recent uptick on the daily, though.
http://stockcharts.com/h-sc/ui?s=POT&p=D&b=3&g=0&id=p16322966132&a=441969663
FUBSY!!! Long time no see!
And I agree , and MOS is the same thing ( AGU pretty close too).
Holy crap great job nailing CLF and other stocks. I haven’t bought anything in a while, just riding full positions for two weeks now. Yet I am tempted to chase here with my little remaining cash buffer.
So far, they acted correctly, to a tee.
I love it when that happens, and it happened ALL – THE – TIME when the Gold Bull was running. Miners behave very well in a bull, and we could be juggling positions like an ATM machine in the future return of the bull.
For now, I’ll take it with commodity stocks ( look at that chart in the report of FCX ( I’ll repost it below, refresh ). It doesnt get much more orderly than that! 🙂
.
DNN got some good news. Chart looks real good. Alex, thoughts?
I dont know what the news is, but I always like when a price crawls under the 50 or 200sma and then surges above.
Doesnt look like a lot of resistance on the left side of this cup ( 1 yr chart)
http://finance.yahoo.com/news/inplay-briefing-com-055139997.html#dnn
DNN positive drilling results with Uranium finds
Man those silver stocks sure did come alive, while many were waiting for SLVER itself to break out.
I was just looking at CDE run / flag/ run / flag.
Looking at AG $2.50 to $7 in 2 months.
#Beautiful
I have a confirmed beginning a wave 5 of 1 on Oil this morning.
There was a beautiful inverted Head & Shoulders pattern in Feb. where the Head was an ICL … imho.
…hmm… did the mountain say it was so…. 😉
I did hear a whisper……. 🙂
A few days ago you asked what my Oil count was and I stated I felt it was working on a wave 4 that I thought might be somewhat deep but the Fed. had something to say about that yesterday not to mention the EU last week ! 🙂
I believe I see it on UCO . Cant wait for 3 of 3 🙂
Did it look like this, or did you use the dip higher up also in Feb rather than the dip in Jan that I chose to label for your left shoulder?.
.
showOff …
oh .. and btw .. REALMEN don’t use hashtags….
*this is what I’ve heard….
#TalkToTheHand
#TwitterIsMyWitness
timestampSHminestamp…
More like #talkingtothewall
U got that right – lol
#nomoregifs”
☺ im on my cell…later….
…
No Seriously, #nomoregifs!
ok Bill.. here’s one of your no more gifs.. as requested 🙂
You know that telling her that is like asking for 5 , right?
Oh .. u just hush chotfreak…
*so glad i resisted the urge to have some sxe with u two the other day…
Lmao
As luck would have it… i do have a sh*tload of selfies here on my cell.i could post for u. BUTT….
…. just sayn….
*yes.. i really do hava catsuit…
Meow…
orrrr…longer term …mayyyyybe even this….
#tradingview
I will only accept this count if you would be so kind to add your ending wave 5 count. 😉
I am using USO for my count since that his my trading vehicle of choice. It is close though but my left shoulder was in Feb. not Jan.
I will most likely take partial profits on my basket of my low debt Oil Jr. stocks that I have held for a few months (hedged at times) at this wave 5 top of 1……then ReEnter at the bottom of wave 2 expecting our wave 3 accent……..
I can’t even imagine what that will feel like…. whewwwww….
GiddyWithExcitement
you looking at something like this Ken?
Yes……nice channel SOG. 🙂
Hey, That looks familiar SOG 🙂 nice update.
..all new improved edition, washes even whiter!
your Bob Ross ‘vertical drive 5th wave’™ into the 38% retrace zone is lookin good…
Good ole B.Ross. A happy Drive higher no doubt 🙂
im watching this….. is it a 3 and done correction.. or a 5?
https://www.tradingview.com/x/gcdCouPa/
CF, your CNX looking great too. Once decisively over 12, we should run. Any target? Thanks…
Yes, that was a good longer term chart. Right now it stuggles at the 200sma at $12. After it gets above that, it may just keep rising. I dont want to get crazy, but it looks like a giant cup is forming, use a 1 yr chart, and it runs to $30!..
Added some of your CLF 2.8ish as well. Thanks!
Hey KathleenChow-
I actually added there too, it was the 200sma area. We could experience a bumpy ride , but I still really like the set up. Good volume today.
Watching the live crude US OIL chart and the fight at $40 – with options expiring tomorrow, I’m wondering if we might see some volitile action tomorrow – esp if oil holds overnight and shorts panic
HEY BILL,
You asked about DNN. URA broke out today with volume.
200sma overhead, but it looks very good.
URRE up 20% off of a double bottom
i stuck with it.. now well back in the green.
i figured it was a pullback shakeout
wouldnt THAT be interesting … if it blows out earnings and pulls one of these… hmmmm
https://www.tradingview.com/x/OgtU8weI/
giddyup
#MyBoxIsaMagnet
yesss plz.. i’ll take that
c’mon ChartBox.. work your magic
Does anyone remember me saying that TAHO breaking above that 50 and then the 200sma was important when it was approaching $9? And then I sold it with an OK profit.
.
Refresh for 2 charts
.
Wish I held on
Bill remembers….
Oh no You Didnt?? 🙂 ( Of course you did)
SWC taking off again too. I sold it somewhere around here at the 200sma. Breaking out now
Smirk… one good ballbust deserves another……
I did hold on, matter of fact I added with my sale of TGD. 😉
I added with my sale of LSG, to hold as a core… then sold thinking that if it stayed in the base during the pull back, I’d get in lower. – LOL
Still living, still learning!
Is anyone following CUBA in the news? Anyone playing the CUBA fund? Looks real good on the chart.
Forgot all about it. Saw that MASSIVE pop in 2014, then forgot about it for a while.
by the way, I posted to you about URA breaking out. That can be good for URRE, DNN, URG, UEC, UUUU, etc in the long run
I bought some DNN on the good news. URRE is up 20 but low risk as its near bottom.
Sold out of ERX at this level. XLE just hit the $64 target from ascending triangle, and closed gap on the weekly at same level. Should be meaningful resistance around here. Might be giving up a few % if it wants to keep going higher, but not worth risk if you’re up like I was. 200 sma a few cents away as well. I’ll post a chart. Mind the lines!!! Again, I draw a few too many lines sometimes, but they’re there as reference points. Bill mentioned yesterday that ERY has a H$S target much lower than current price, but I think we are due for a shakeout and then another run. What concerns me is that XLE seems to be forming a bear flag in the weekly similar to the previous bounce. This one IS different in the fact that it already came back and touched previous support, previous bear bounce did not. RSI is also at resistance in weekly for xle.
Here’s the weekly
Daily
Nice trade. I do see XLE at resistance ( 200sma right overhead).
Nice trade. Two weeks ago I said one could take an ERX position at 17.4. Too bad I didn’t listen to myself. Drat!
CF, how would you read LPI chart ie. target etc? A bit confused here. Thanks:) And, thanks for answering my prior comments. First time posting and wasn’t sure it would work lol! Hello, Alex & room!
Welcome to the comments – I actually thought that I recognized your name, so I didnt say that the first time.
Anyway- I see LPI as likely running up to tag the 200sma. I have seen this SO MANY times, that I will almost guarantee that If the volume stays at this level, it will not be able to break through, so then it will pull back or go sideways underneath.
Refresh for a chart. It could go sideways and eventually become an inverse H&S with a good break out later.
.
Come on REN, lets go
welcome kathleen…:o)
I’m loving all the new female posters.. hoooorahhhhhh
…watch out boyzzzz… the ladies …. have entered the room….
i hope the laydezzzz appreciate your catsuits as much as the boyzzzz do 😉
Anyone see any news that might be sending LGCY down? Maybe I just don’t have enough green on today….
No , and I dont want to start a panic, but one thing that I was looking at earlier when it was at $1.12 was that the 50sma has started to turn down. The volume in the sell off is light, so thats good, but…
See chart
Back when I drew this – I was going to say that we could get a test of the 50sma at $1.08 ( And we are there now). I was also going to say that I want to see this bounce off of the 50sma, not drop below and close there. I May lighten up a bit more because it isnt really reacting to OIL moving higher yesterday and today.
It is not acting badly, but a break of the 50sma again could drop it back to $1. THAT was a 61% re trace, that was one of my entry points as a trader. ( This has large swings, huh? $1.07 to $1.24 today alone).
.
This chart was drawn up earlier, before it dropped to $1.08
Remember when I bought the gap last week and predicted we’d be in for a wild ride with this? I am always suspicious of these whipsaws – I suspect mm’s are shaking out weak hands. I think your instincts are right–this is going up. Sometimes your gut knows more than the charts
Bouncing off the 200sma on the 15min chart
Here is XLE:USO chart I discussed with Bill yesterday. 50sma has been lost again, with a break of neckline pointing at circle in chart or thereabouts.
Also liking SDS here with stop below previous low.
beware miners ppl.. could be a flat correction here (GDXJ).. now getting 5 waves down
I like that chart –
I Agree SOG – WE ARE DUE timing-wise for a pullback. ( Broken record huh? Been saying that for a while and they just keep popping higher)
It should become a great buying opportunity, but expect it to take weeks
i had it in my mind yesterday.. that impulse looked like the ending c wave of a B wave correction…
caught me out so many times before.. im really suspicious of any vertical shot to the moon.
Yes, If you scroll up in the report to the AUY chart. Kind of like those tops in the blue triangle
would be fab if energy tops out just as miners bottom out.. nice straight swap over
If you want I could buy some tomorrow then that would cement it. You guys could JDST for weeks.
Energy rolling until miner pullback is done? That would be AWESOME!
Think I’ll have a smoke, GWPH anyone? #upinsmoke
I was waiting for a confirmed false breakdown @40 to get in… nevver gave a chance…
Dude!! I had a CLF limit buy in and it missed by a couple of cents this morning (why? Why do I always try to lowball!). Ugh.
Hey check out DNR!
Held my EXK too long, but this has been hot, can hold through eventual pullback likely (unlike that crazy NUGT stuff).
CF, do a sanity check for me. VALE and CLF look good. REXX and LGCY look like they are rolling over. BAS and REN look alright. Some of my holdings. I’m looking at an hourly scale
Hey Bill. Also in VALE, missed CLF by pennies. DNR looks solid, CRK looks like fried crap. I own BAS but have sold part of the position. Plan on riding the rest for some time; not a short term trade like others. I post chart above but WPX has been working for me since Alex had in a report 2 weeks ago.
I see that LGCY volume picked up in the last hour before closing…hoping that is a good sign for tomorrow.
LGCY looks amazingly poised on this weekly indicator i have.
may be a touch more downside to the ma before breakout, but then wooooshhh!
That would be awesome SOG! Would make me very happy that I held on..!
looking at the hour version.. it is coiling.
may be a drop to the lower red line first befor breakout?
i will buy this as soon as it turns up 🙂
Son, Thanks for reassuring Tammie,…your chart helped me too! Tammie, I am hanging on to LGCY too!
Me three!
We’ll all be watching tomorrow, the Quad witching day.
see the hourly chart too
Thanks for posting it! I like your charts.
thx.. you’re more than welcome
Looks like I’m in good company! Lots of us in the same boat paddling along!
Might be time to reassess your stance on BIO’s Alex? My watch list of bios are poppin’ VTAE OPK RLYP SRPT INO GI BDSI XON my personal favorite
It’s all about correct timing MxsC
When I looked , it was not right. Today is a double bottom low with a reversal candle.
I know someone else who has been buying Biotech (LABU) for over month. Its all about the timing. 🙂
Mx? No not at all – do I need to change my profile pic?
Interesting that nobody has mentioned SWC today…
Daily breaking out on massive volume. Weekly shows what should next level of resistance near $12, then $14. Watching to see how it closes the week.
I thought I did, with TAHO. Maybe I didnt?
And now somebody has! I’ll add to my watchlist (which is REALLY LONG right now). Thanks!
WPX? Working it!