
Anything Else?
Well, the past several weeks have been excellent for trading , and we have seriously had reasons to celebrate, catching the lows in various sectors. All good things come to an end, so is it that time yet? Can we keep the celebration going? lets review!
.
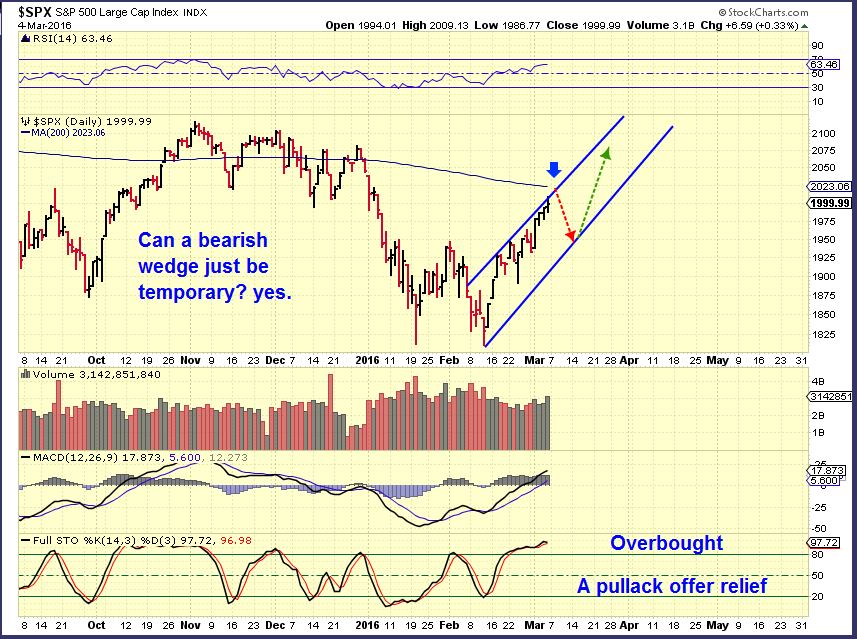
SPX ( or SPY) – A few weeks ago I was calling for a rally to get the bulls excited. Those who wanted to play it long should now be a bit more cautious short term. We have reached the spy gap, using a wedge to transport us there. The 200sma is there on the spx too 😉

Lets look at another indication that the SPX is at least short term topping, and we’ll then look at a longer term weekly SPX chart.
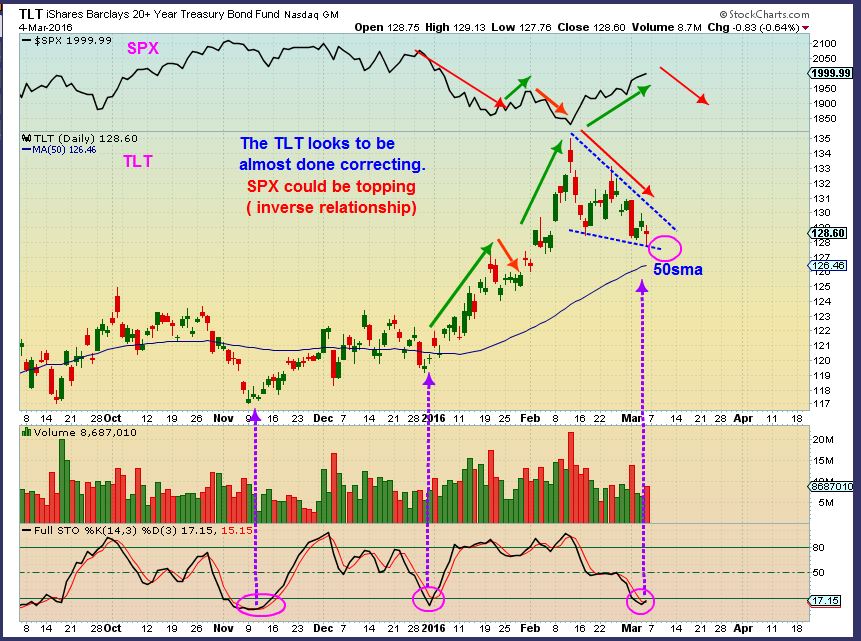
This is a bit cluttered, sorry about that. The TLT looks to be near a short term bottom, maybe at the 50sma? That would confirm the rising wedge that I see in the SPX as causing a pull back soon. They have been running in an inverse manner when you compare the upper box of SPX to the TLT chart.
.
So I expect a pullback soon. Important- We are still early coming out of this ICL, so I think that we need more time before shorting a potential larger drop. Lets look at some longer term wkly charts.
.
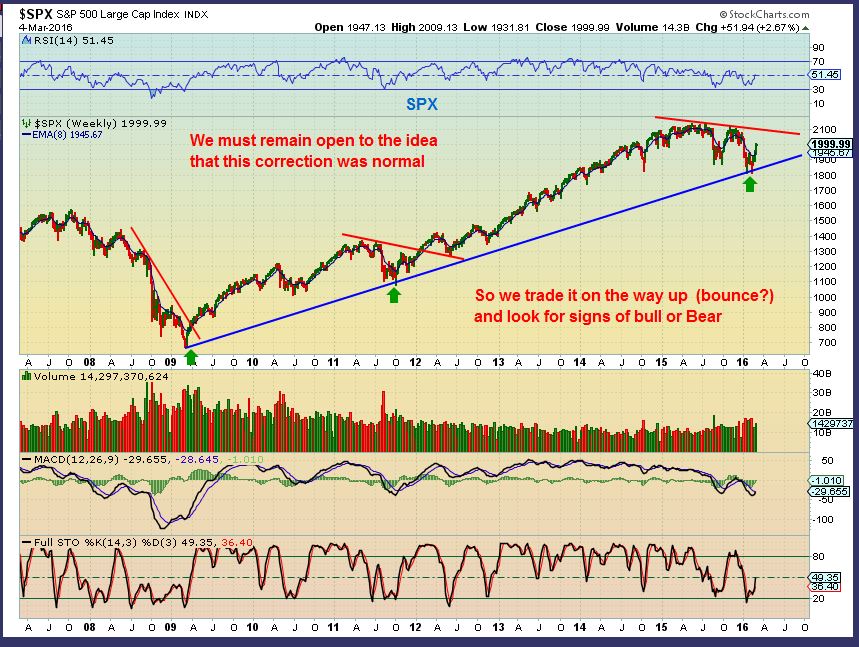
SPX WKLY – The pullback in SPX, DJIA, RUT, ETC all fell to support and bounced or recovered it. That means we need to see if this can remain a recovery or are we seeing a new bear market, with lower lows and lower highs.
 .
.
If this was a normal correction as shown above, and the bull markets would resume, the wedge that I see playing out now might still resolve bullishly? I wouldn’t heavily short it yet. It could still play out like this.
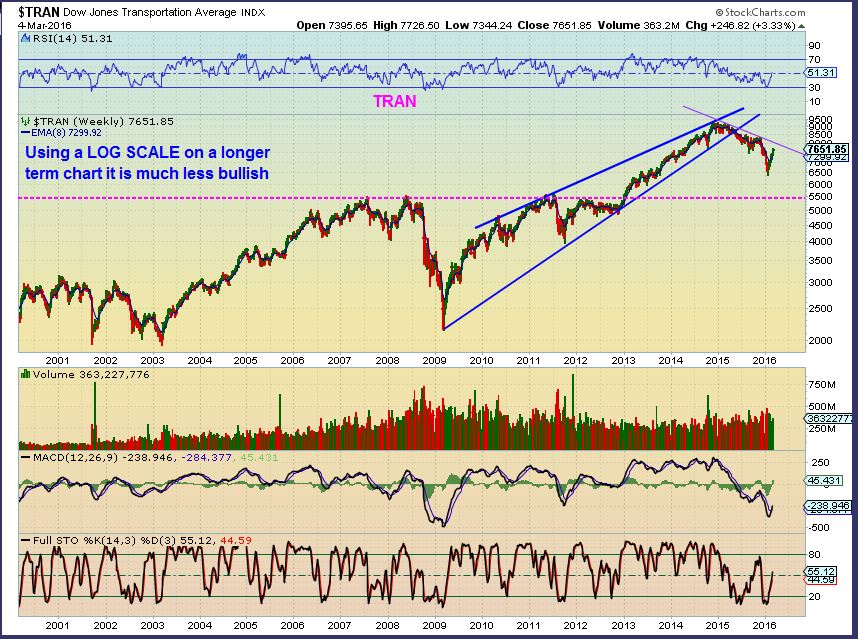
I see the same thing with the Tran, but let me show you the difference between the Log Scale and Linear Scale charts.
.
$TRAN – The TRAN broke down first. The linear scale shows the same break down and now a possible recovery. I was looking for a sell off to 5500 and back test the inverse H&S. Was that just a shake out? Time will tell.
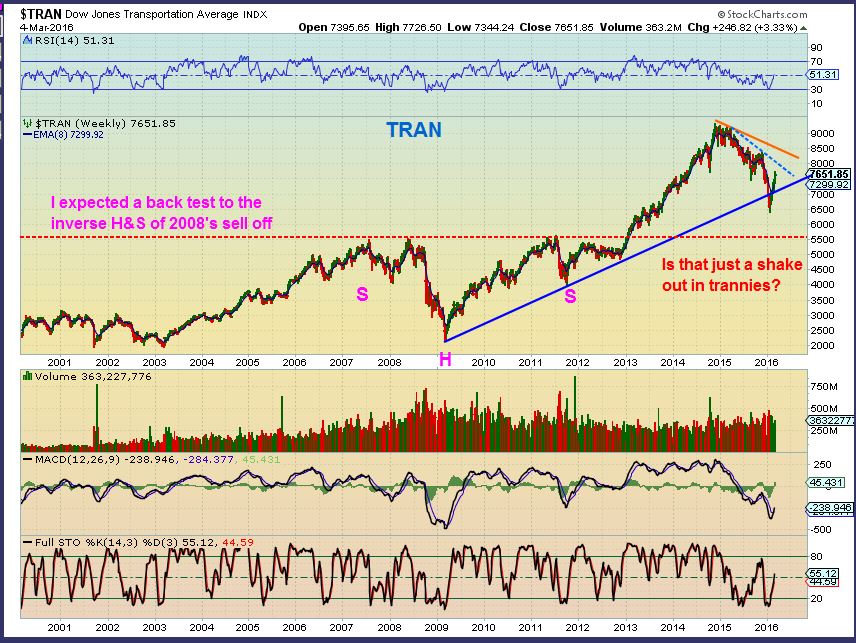
TRAN – If you use a LOG scale, This is ugly and the bounce is running out of time.
.
SO I called the top last yr and we saw the correction. I called for a bear market in the markets and a bull in the precious metals. Lets continue to see if this plays out that way. So far we are right on the money, but I never become blinded by bias.
.
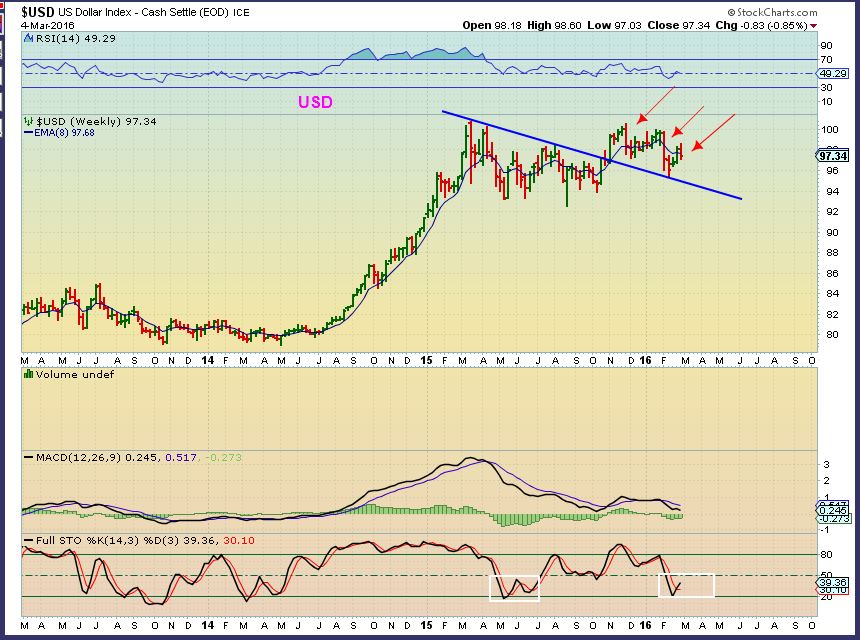
The USD – I called for a double top in the dollar last year, and so far that is what we have here. This has helped Precious Metals and commodities. The Dollar dropped last week. I expect it to drop further, and Gold could pop to $1300.
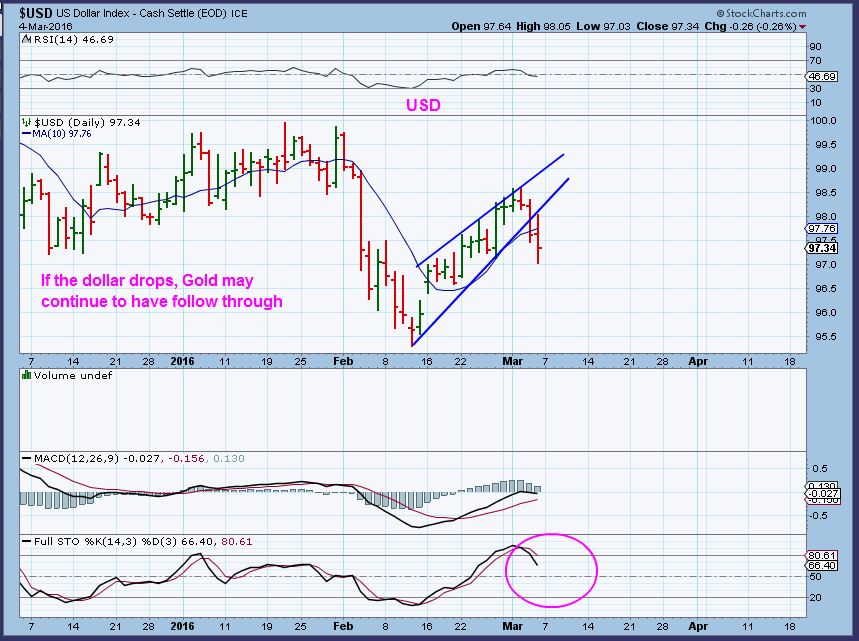
USD DAILY – The dollar is overbought on this bounce, so it should drop further, I would imagine that Gold would continue its break above the flag pattern.
.
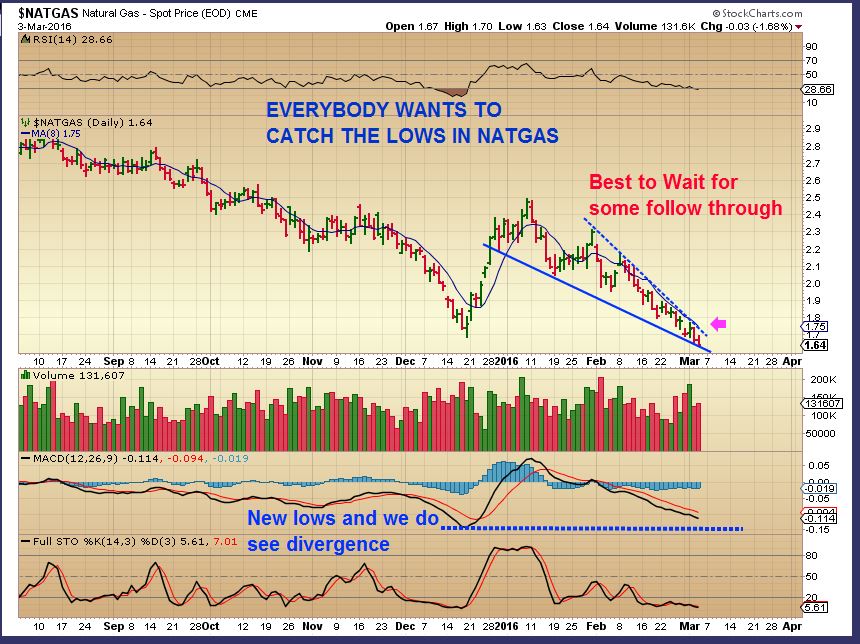
REPEAT : This was my NATGAS chart Friday – Best to wait for upside follow through.
.
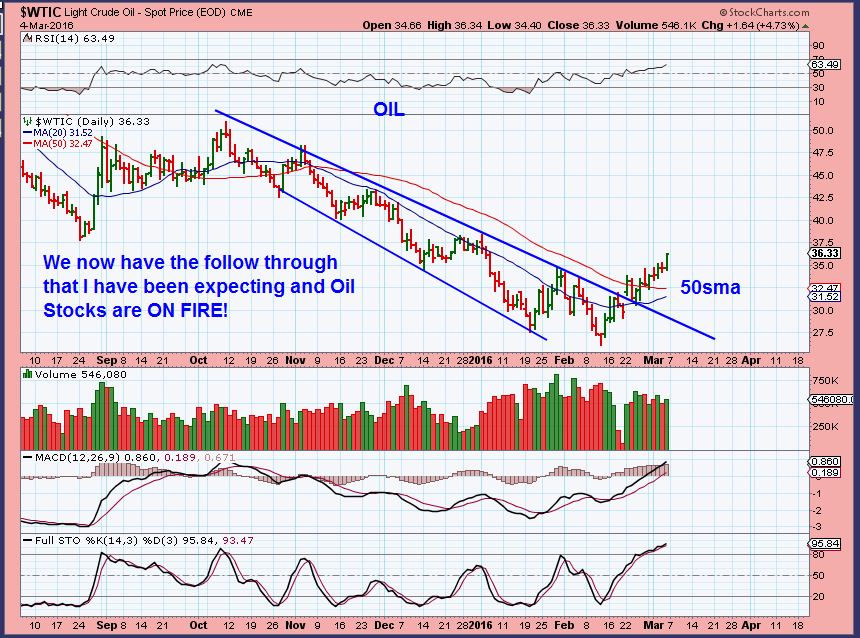
OIL & ENERGY
WTIC – Oil bottomed as expected, it is getting a little follow through. It is overbought, but it can stay that way. it also could drop to test the 50sma.
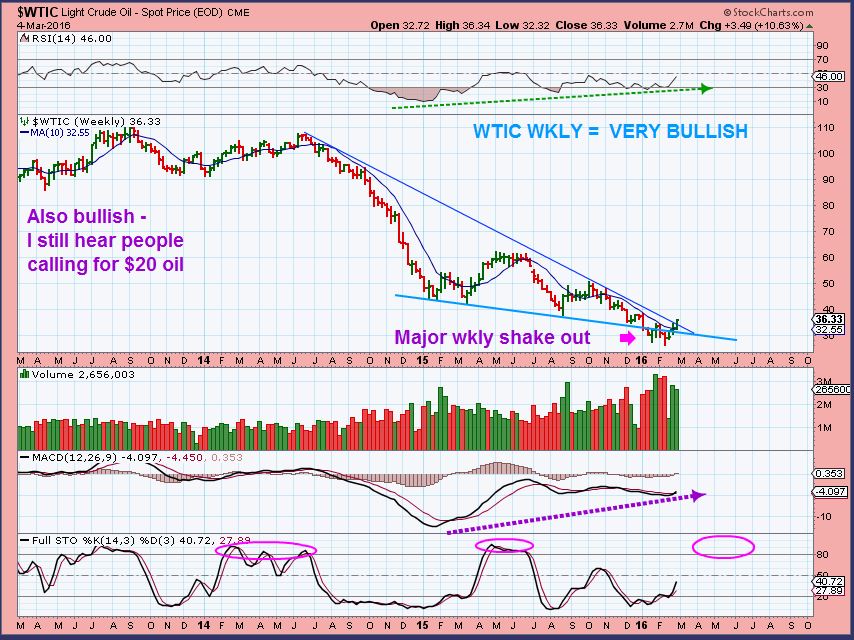
WTIC WKLY – This is quite a bullish looking chart, as though it is just starting its climb higher.
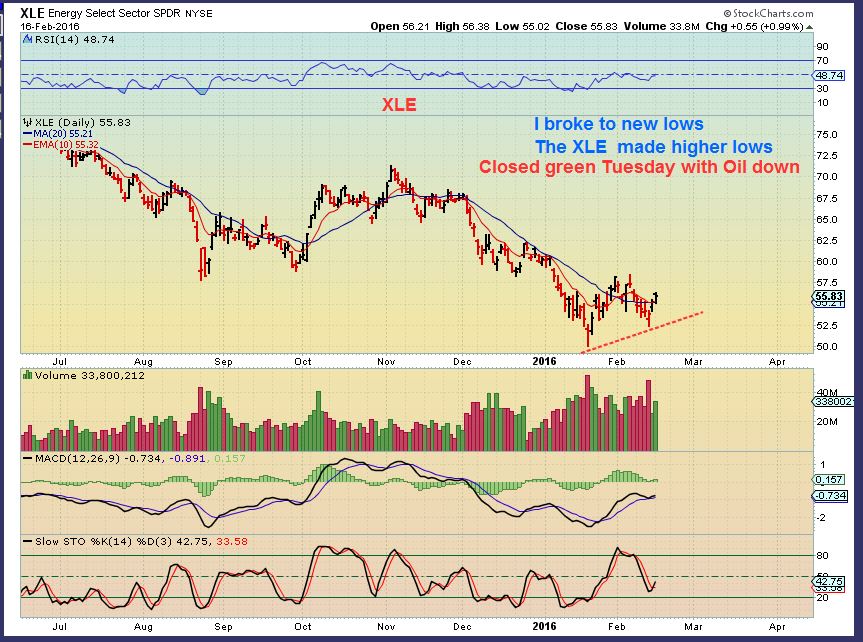
XLE – In my Feb 16 report, I showed this bullish divergence and mentioned that Oil just broke to new lows, but Oil Stocks were making higher lows (Bullish). I pointed to the oil stock WTI too. So I was expecting a break out higher.
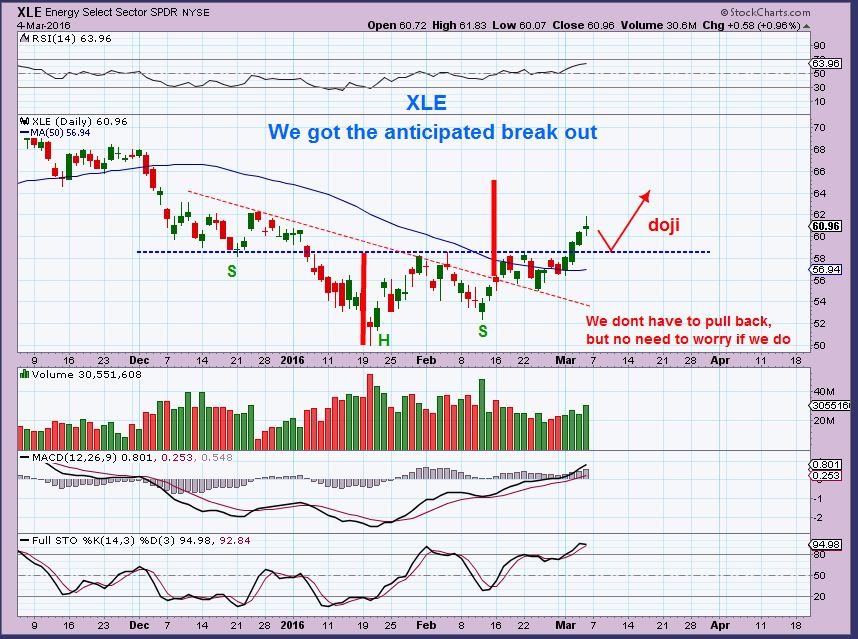
XLE – Now we have a possible inverse H&S with a measured move to roughly $65. Fridays doji could mean a pullback first, but my gut says that Energy stocks are not done moving higher either way.
We have been KILLING IT with just a few energy stocks in the past couple of days. All of my recommended picks in last weeks reports popped 10%, 20%, 50% etc in a day, then continued even higher. I do not think that these moves are done longer term (but be cautious of pullbacks. They may be as big 5-wise).
Please review Fridays report ( Thursday night) and Tuesday & Wednesdays for a few ideas if needed, I will post a couple of examples of these types of set ups here.
.
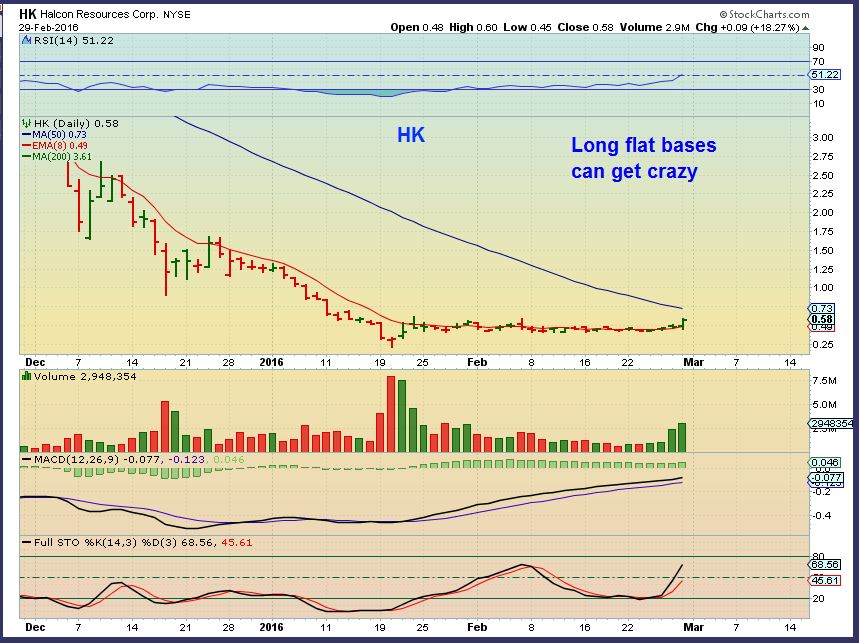
Feb 29- I loved the flat base of many oil stocks, and pointed out HK. This jumped from $0.40 to $0.58. Roughly UP 20%. I was saying that just because it is up 20%, DOESNT MEAN you’d be chasing, these are explosive set ups. These can get crazy.
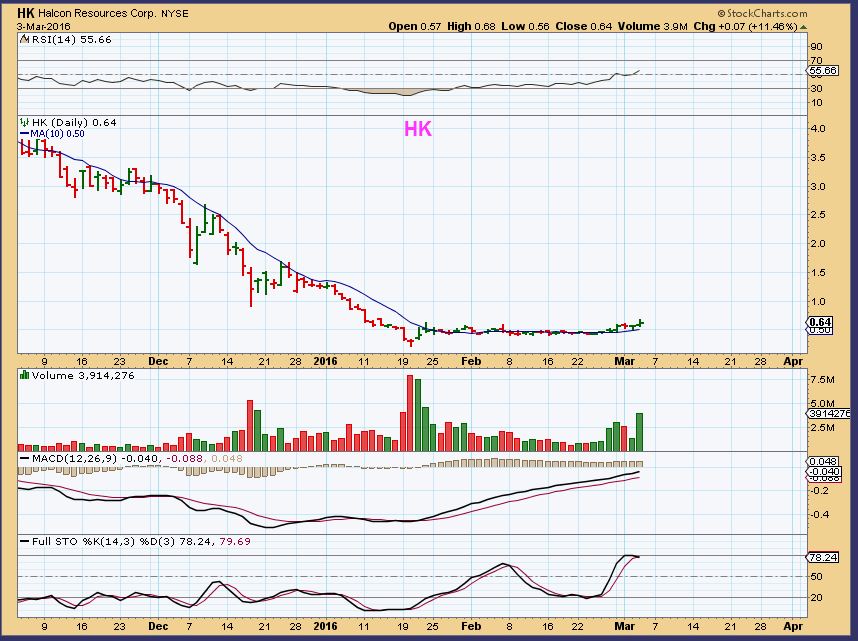
HK March 3 – Sideways for 3 days after that pop ( a buying opportunity) and then Popped another 11% to $0.64. Now its up 30% – too late? Would this be chasing? No- Under the right conditions these set ups are explosive. Zooming back like this, I was pointing out the potential.
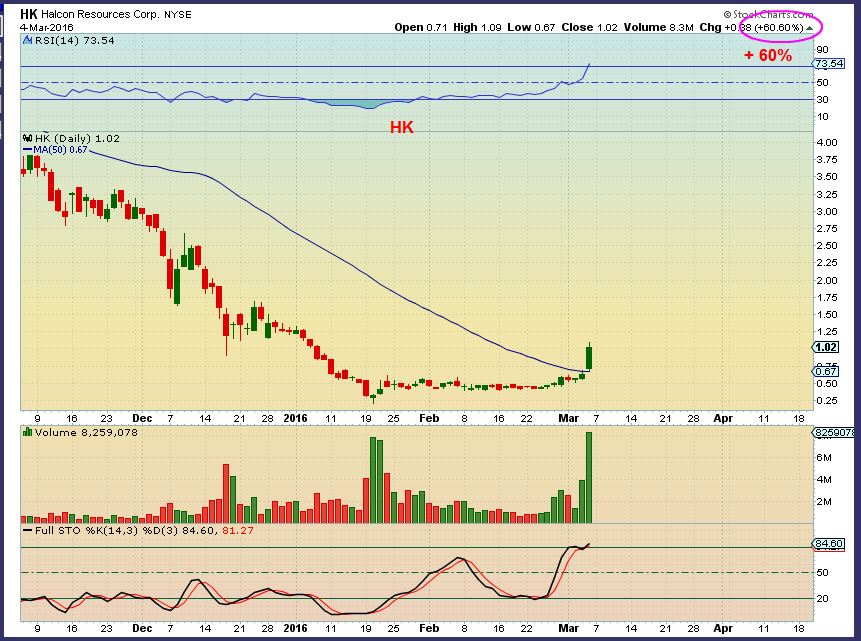
HK – up another 60% ! This can do anything now. It can drop 30% or just run higher and higher ( see “X” as an example of day after day , higher and higher).
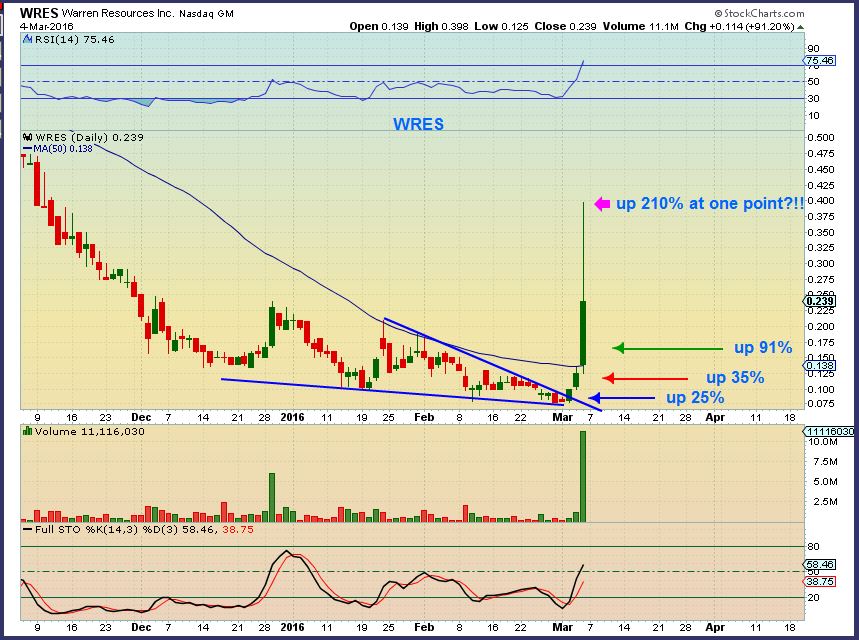
I didnt recommend this one, but I was watching it along with all my others in my list (I didnt buy it). Notice that it was up 25% ,then another 35%. Friday it jumped an additional 200% and dropped to “only” up 91% Friday alone.  Crazy tight wedge pattern after a steep sell off.
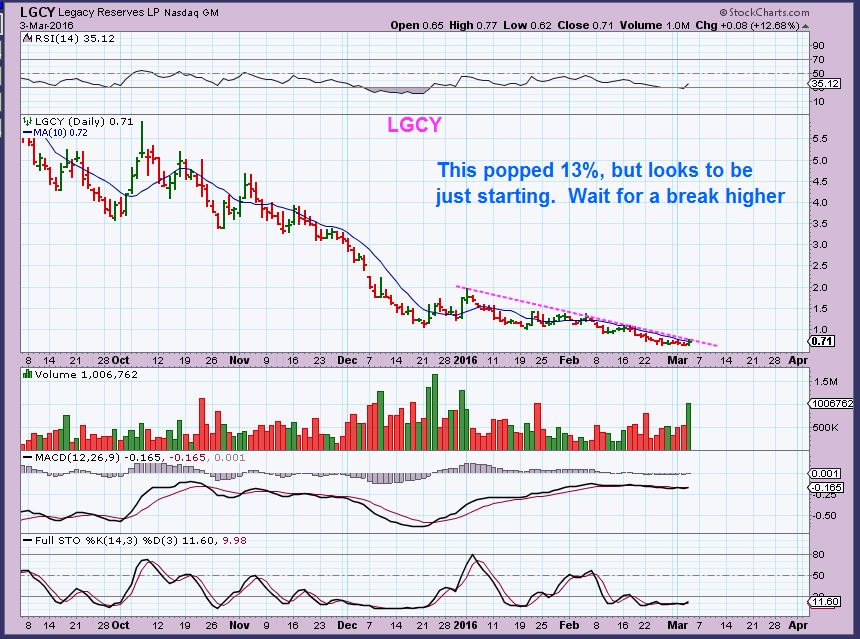
I pointed out the same tight pattern in LGCY in the friday report. You want to catch it before it explodes. It broke out Friday and I bought it. It hit $1.00 mid day, ended up 23% at $0.88 Friday. It may also just be starting.
.
**** So let me repeat For safety sake that some in this sector could come out with earnings and get clobbered. At the same time, Oil could recover and drag many of these up A LOT. Some may still be debt heavy and go bankrupt. That in mind, for now we are trading some great % pops. Some of these bases could be The Lows if Oil is in recovery mode.
.
Now lets look at the bigger picture like we did when we look at the potential for AKS, X, CENX, etc.
.
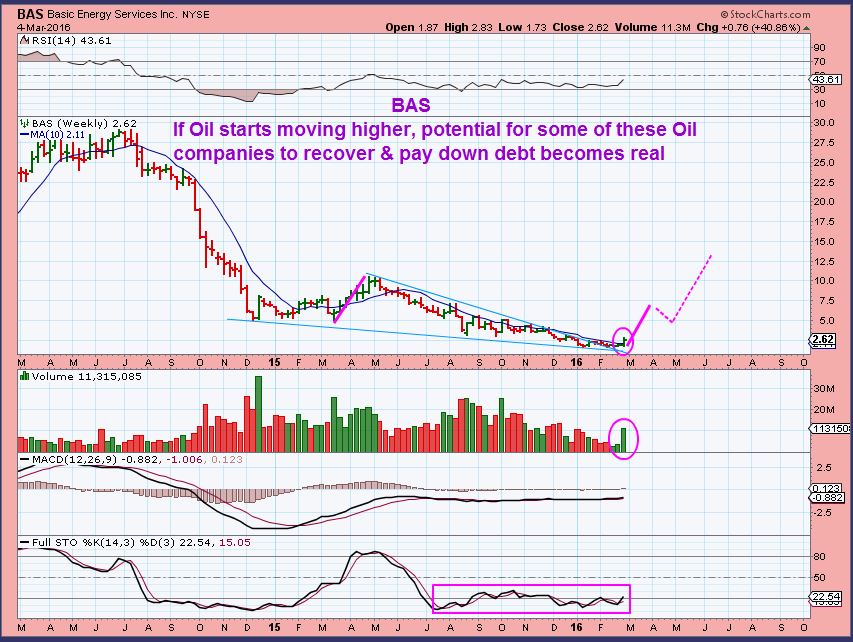
BAS – This is one that I mentioned I had entered earlier last week. It was a tight weekly pattern in this triangle. Now on a weekly chart, it looks like it is just getting going, doesn’t it? Thats a 1 week candle. Look at the run in March of 2015. It ran for 6 weeks. We now have bases at OIL $30. Higher Oil prices may lift these back up.
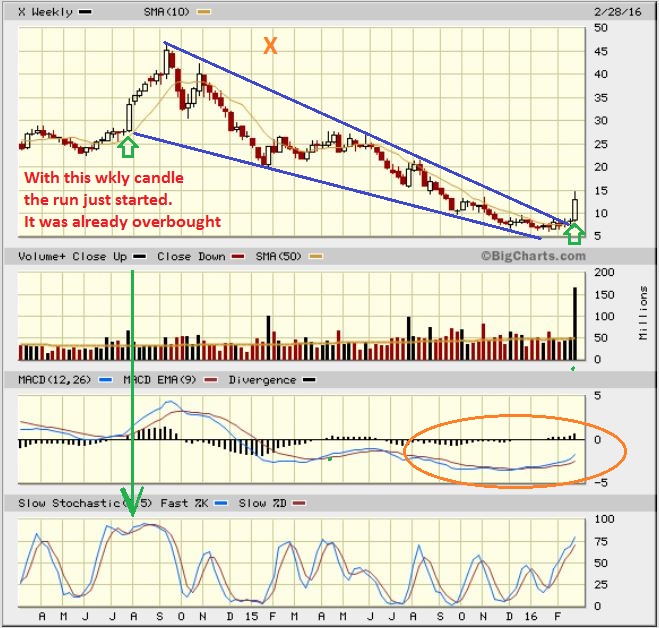
X– This has become quite extended on a daily chart.
Many commodity (steel / aluminum, materials, etc ) have. The weekly charts show the potential. In the summer of 2014 X popped like this and moved higher for several weeks too. That was when it was already overbought. We may see a pull back soon on a daily, but longer term these can run a lot higher.
.
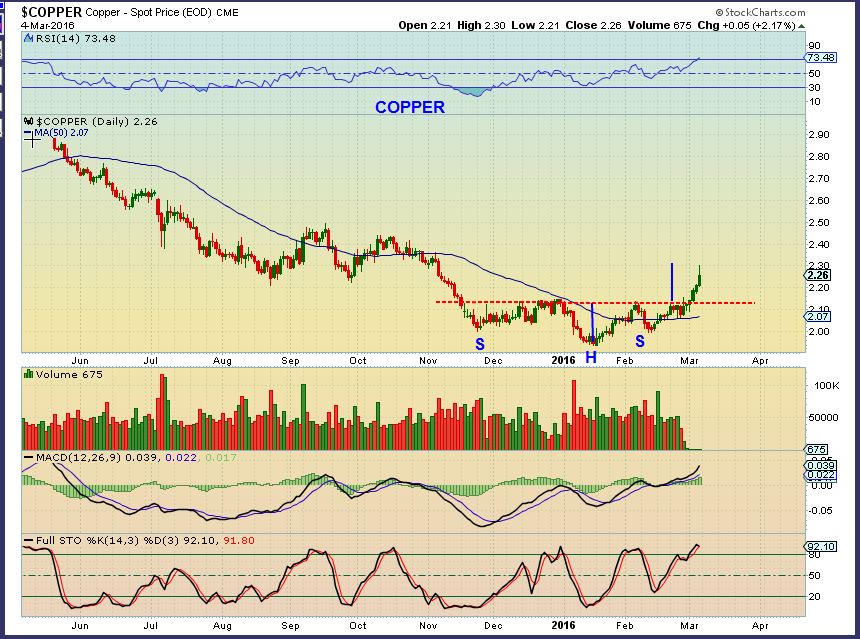
I expected a break out in COPPER, and posted this in the report that I wrote on Mar 1.
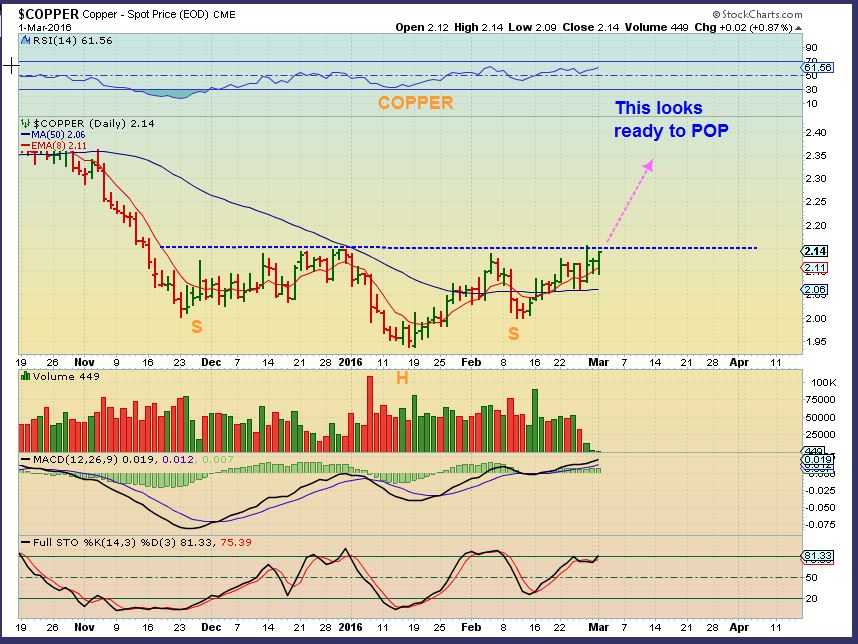
Copper – We broke out and reached a 1st target on Friday. This is bullish and I expect that even after a pull back, it can continue higher.
So lets look at FCX , a Copper / Gold stock.
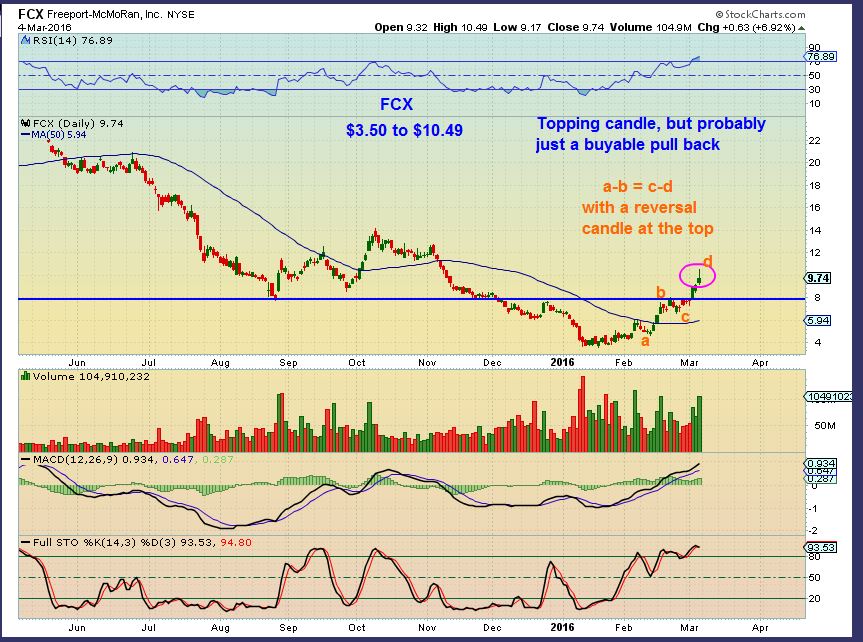
It just finished a HUGE a-b-c-d run. $4+ to $10 + ! Well done FCX. 
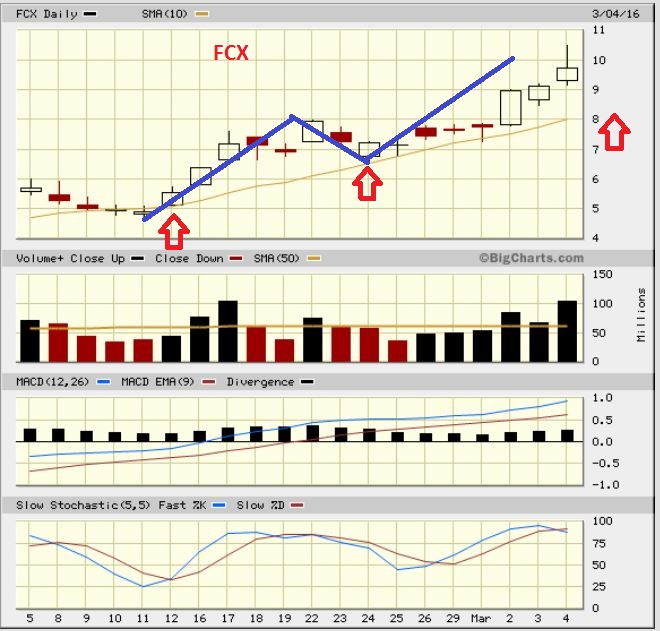
FCX – This really ran from $3.5 to $10.49. This could now drop to $8 or even $7.60 and it becomes a buy for a possible run to $14. So I do expect a pull back along the way. A possible buy opportunity.
.
So I do expect that we’d have to see some kind of pullback in many of these commodity stocks that have gone ballistic. I will show you how that ‘could’ ‘maybe’ ‘might’ unfold, but also show how difficult it is to actually predict at this point. THAT is why I do take some off the table on the way up, yet still let my winners run. I scale out for a future buy opportunity.
.
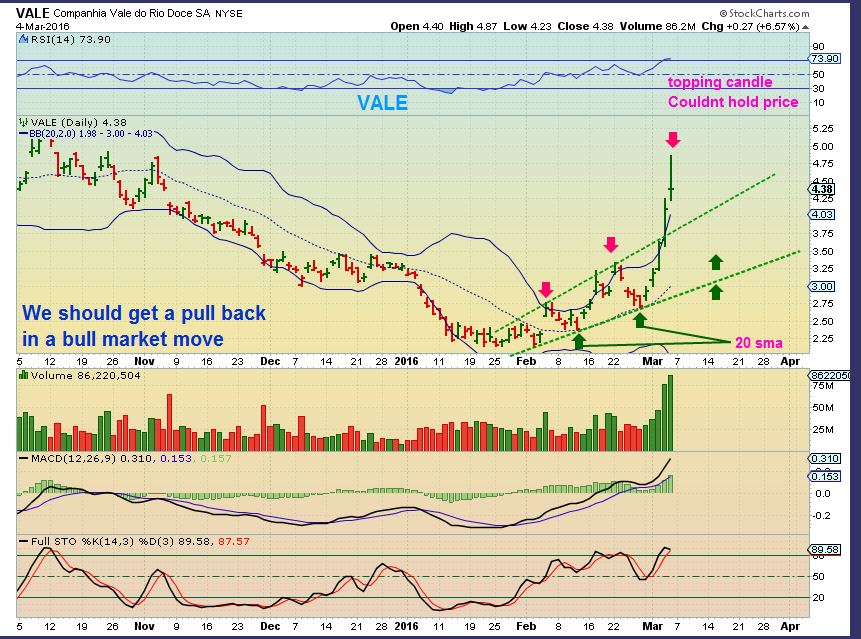
Let me show you how VALE could pull back in a few different ways. This is why it is difficult to answer, “Where do I buy it next?” .
.
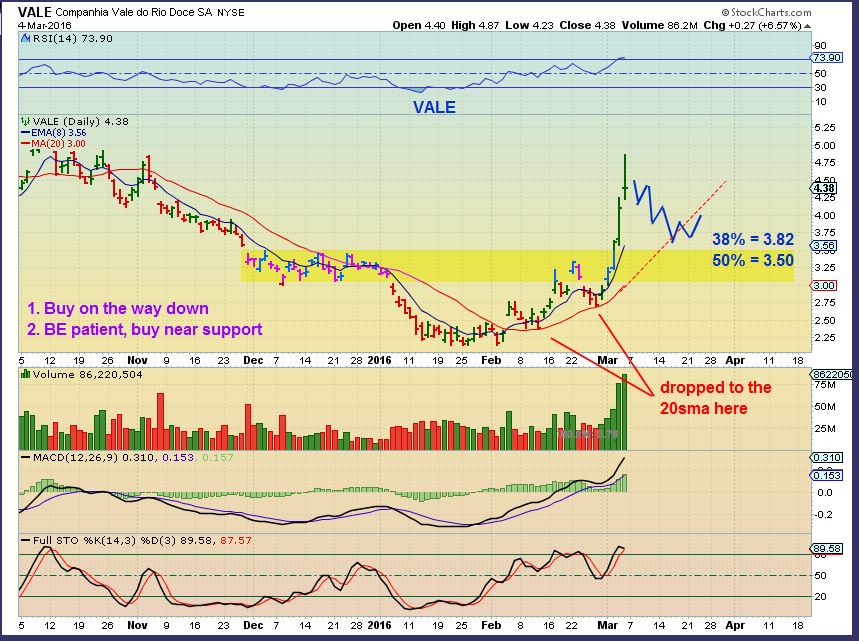
VALE – After being away all morning, I sold 1/2 of my position Friday afternoon. This CAN keep climbing, so I only sold a partial. The last 2 sell offs dropped to the 20sma ( Green arrows). So if this dropped to the 20sma or the lower bull horn green dotted line, thats deep, but healthy. A great buy opportunity down there for the patient trader. However…
Vale #1
.
VALE #2 – This would show a normal drop to the 38% or 50% move of this move higher. There is also support in that area, so patience may allow a great buy there. However…
.
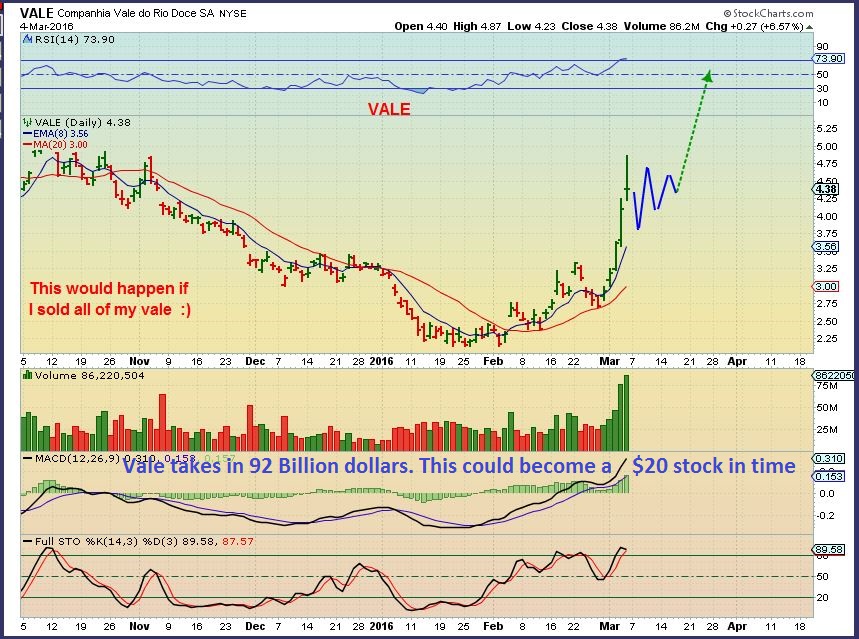
VALE #3- This shows that famous Flag pattern consolidation. The lowest point is on the first quick drop to maybe $3.75. The bounce and next drop becomes higher lows. Sadly, I may end up re-entering near the apex of the flag around $4.50, and that would be just a little below where I sold it.
That shows you that I cannot tell you NOW where the next buy is. I do get emails saying, “I missed the move in Vale or X , where can I get in?” May this help you to see why I cant answer that clearly yet. We must be patient and allow time & price to tell us where we will buy. It could be an educated guess now, but will be much clearer if I just watch the pullbacks unfold.
.
GOLD, SILVER, & MINERS
,
Yes, The COT went higher. I discussed last week why I wasn’t overly concerned then. I do use it as a warning signal, not a timing tool. It is warning that smart money is going short. Silvers COT actually improved.
.
GOLD – Even though this was a very bullish pop Friday, the selling at the end of the day shows selling was overwhelming and it couldn’t hold price. I still believe we will see higher price, but a pause here may come first. It may back test the flag and then run higher, as shown. Also Miners do look ready for a pullback.
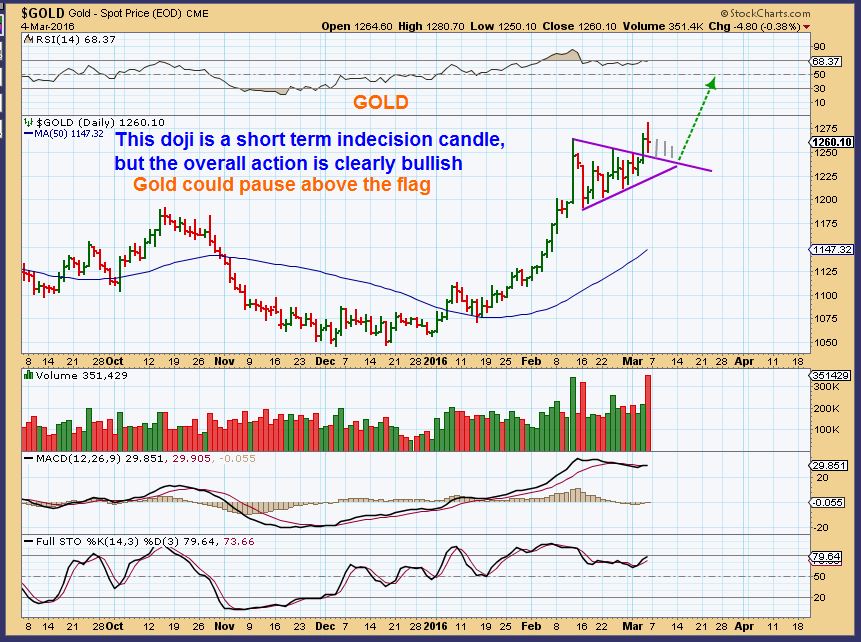
If Gold goes sideways as shown above , that could allow Miners to rest and drop for a bit. We’ll discus miners in a minute. I used this chart on Feb 23 to point out Golds potential if it just flags and this is a 1/2 way point.
.
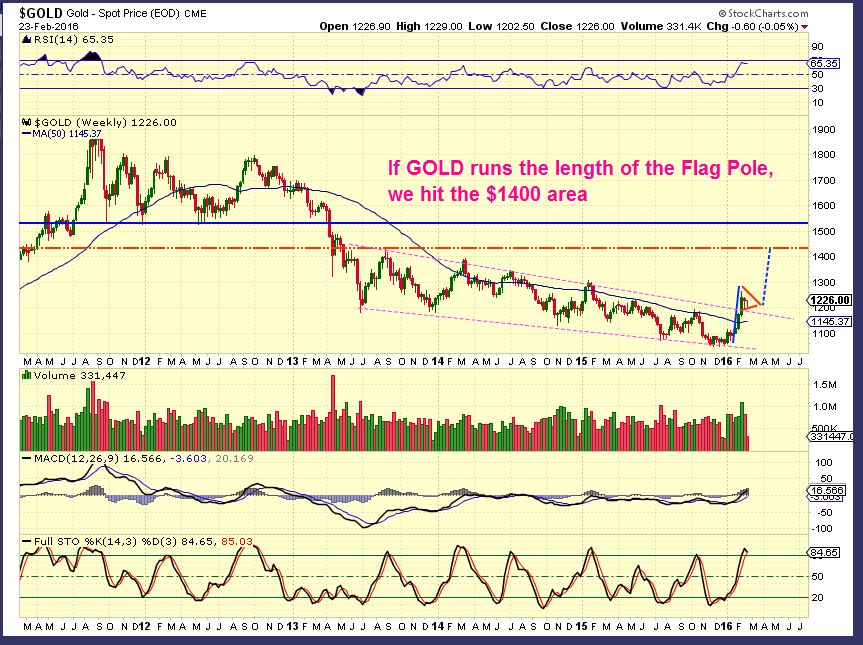
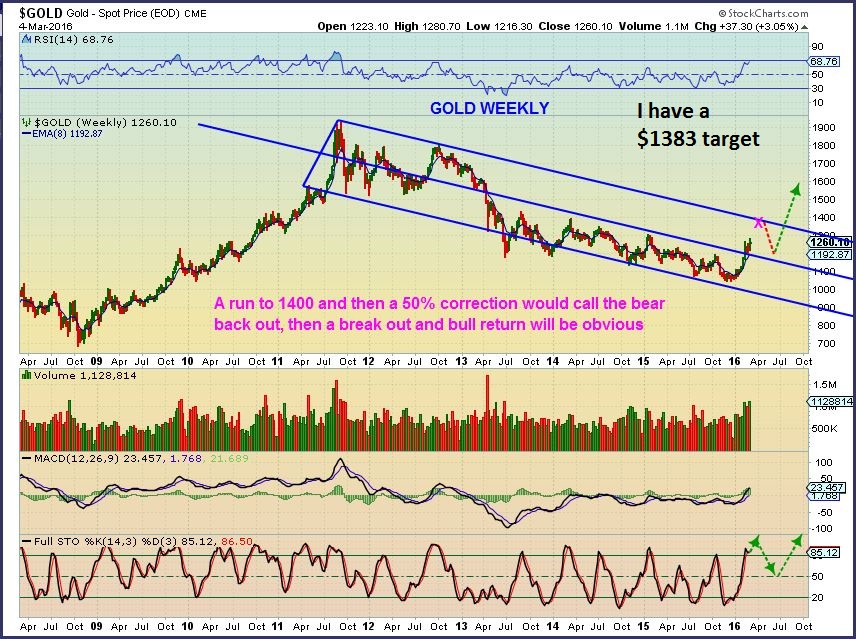
GOLD WKLY – In the long run, I still have a $1383 target if this holds up, and this chart agrees. Gold can drop to test the flag and make people nervous and still fulfill this goal. Note: In late 2011 & early 2012, Gold failed here and dropped back below the middle trend line.
.
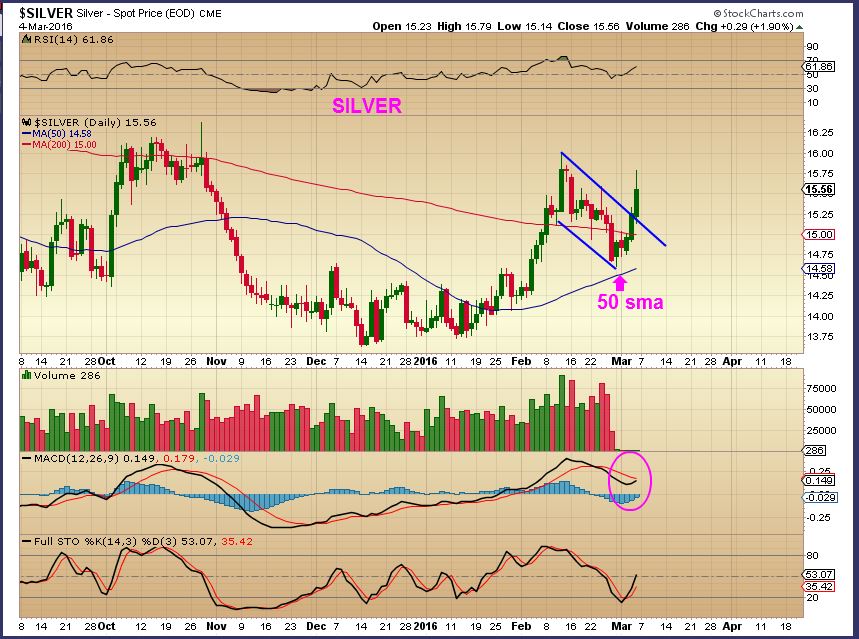
Silver- This looks good in several ways. The volume on this chart is wrong, but SLVs volume was good. The reversal is a sign of weakness, so it also could possibly drop further down. Maybe we see a test the 200sma break?
.
I mention the idea of Gold and Silver stalling mostly because the Miners showed weakness on a bullish break out day for Gold.
.
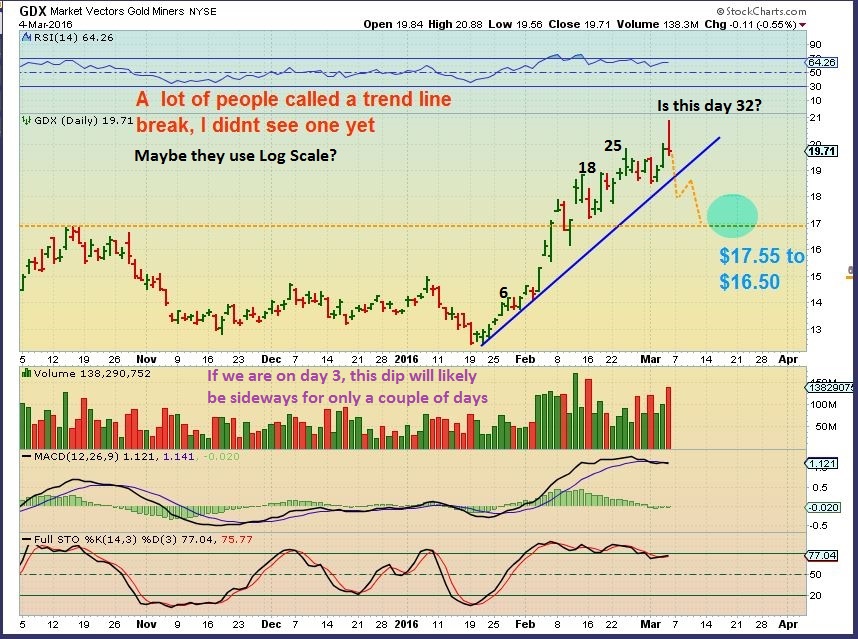
GDX – That is a topping candle, so how far will this pull back? We cant say for sure. Is this Day 32, with a new high on day 32? Thats very bullish. Or is it day 3? If so, we dont want to see a drop below the dcl 3 days ago. On my chart, I show a normal pull back in Technical Analyses, and if its day 32 we could be there on day 35? You know how quickly Miners can sell off and freak people out.
.
However Miners pullback here, I think they will be a buying opportunity for another run higher.
.
Watching things unfold, we will look for opportunity as it presents itself.
On Feb 18– GDX was at $18.90 – I gave 2 scenarios for a GDX pull back. These 2 scenarios are still on the table.
GDX hit 2o.88 Friday. That fits this one fairly well – a drop near $17.
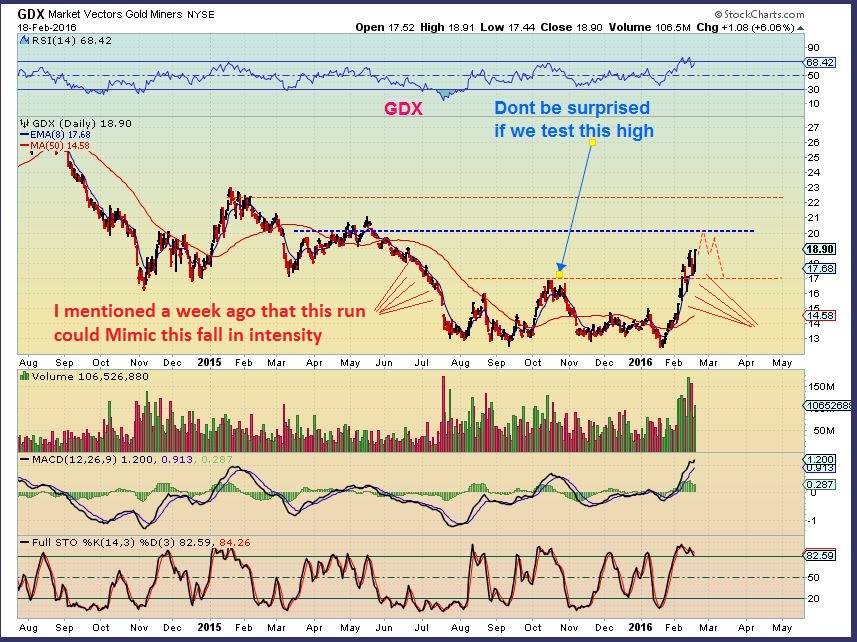
This was my other idea on Feb 18, a pop higher towards $22 and then a drop. It seems close too.
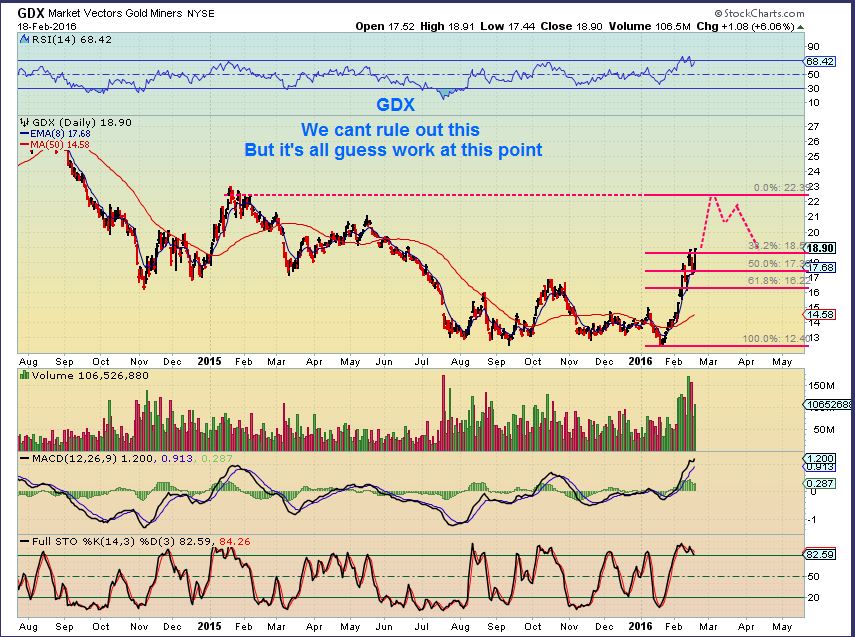
So lets watch things play out this week ( That was a reversal candle) and prepare for an entry if it presents itself.
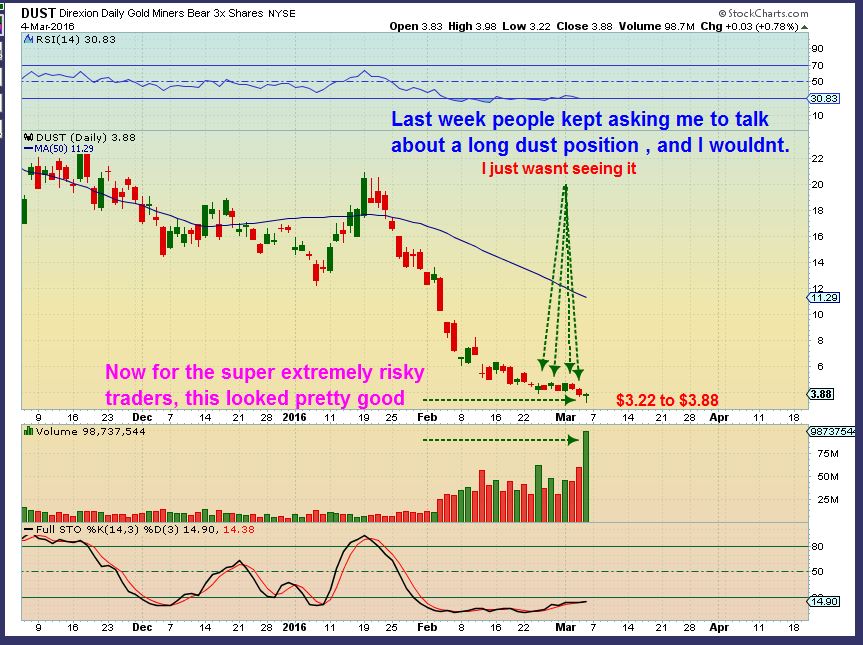
Some have asked me over the past 9 days about buying DUST. I just said, “Dont do it. I cant see it. It doesnt look low risk. You are shorting a raging bull.” I did NOT see any signs on the chart saying it would go higher or that GDX would drop. I also posted on one of my charts that some buying DUST too early would get chewed up in one of these rallies that we are in, even in a sideways move.
.
Well, that said, i am only going to mention this here. This looks Bullish short term. That is a high volume reversal at the lows. I am not going to recommend it. I am not going to guide anyone in or out of it. So its a trade for experienced traders, please trade it at your own risk. That reversal Friday was a low risk buy with a stop right under it. 🙂
.
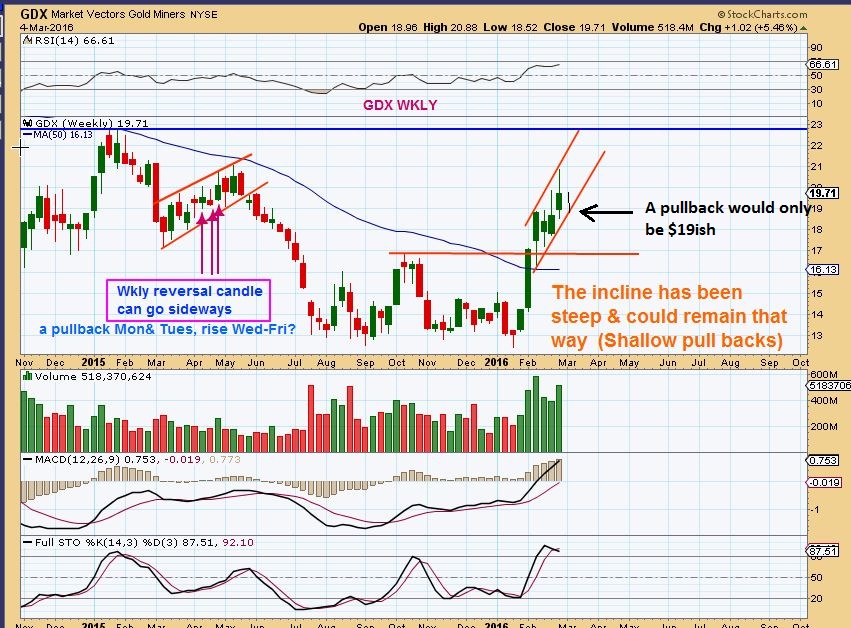
I looked at the GDX WKLY– If gold just goes sideways at the flag and then runs to $1300 or $1380, and Silver continues higher, then GDX on a weekly basis could just continue to climb inside of this tight column. Thats a GDX drop to only about $19. DUST buyers beware of that. It would make dust a short term trade, not buy & hold.
.
So That’s a wrap. What a tremendous run we have had in metal stocks like X, AKS, CENX, AA, VALE, FCX, STLD, etc. I’m watching them for pullback and possible entries. The Miners also have been little rocket ships, but I still recommended locking in some gains. I do not think that the run is completely done, and even if GDX pulls back, some individual miners may still move higher at that time. When I look at the weekly charts, they look like nice bases with good of upside potential. Also Cycle lows are due to produce these long term bottoms in the CRB, OIL, and Precious Metals. My thinking is that we are about to enter the next phase of the Gold / Miners Bull market, and commodities are going to join in. Oil may have found THE Bottom too.
.
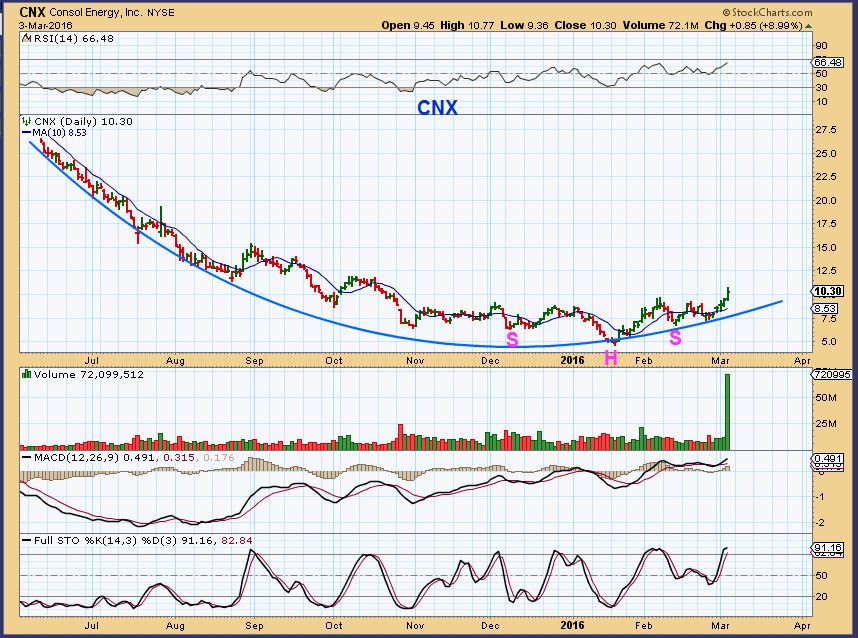
ENERGY STOCKS: Currently Energy stocks are now Popping from solid bases and I am going to continue to focus on that sector while it is ripe for the picking. Most of these are just quicker trades ( a few days maybe) at this point. Set ups like CNX that I pointed out in Fridays report may be longer term buy & hold, due to the steady base.
.
What of the Bigger picture with weekly charts of Miners and commodities? These are so beaten down, we will make a lot of money on the upswing if the lows are in and this continues to play out. If the Bull has returned, these stocks are set up go up 100%, 300%, even 1000% over the next several months, like they did in the past. Since Miners are finishing their 1st daily cycle, there could be a short pull back and a second run higher that is also very strong. I look forward to watching how things unfold going forward from here. Thanks for being here and I recommend reviewing the last 2 reports for Energy plays.
.
~ALEX
Mini -Lesson
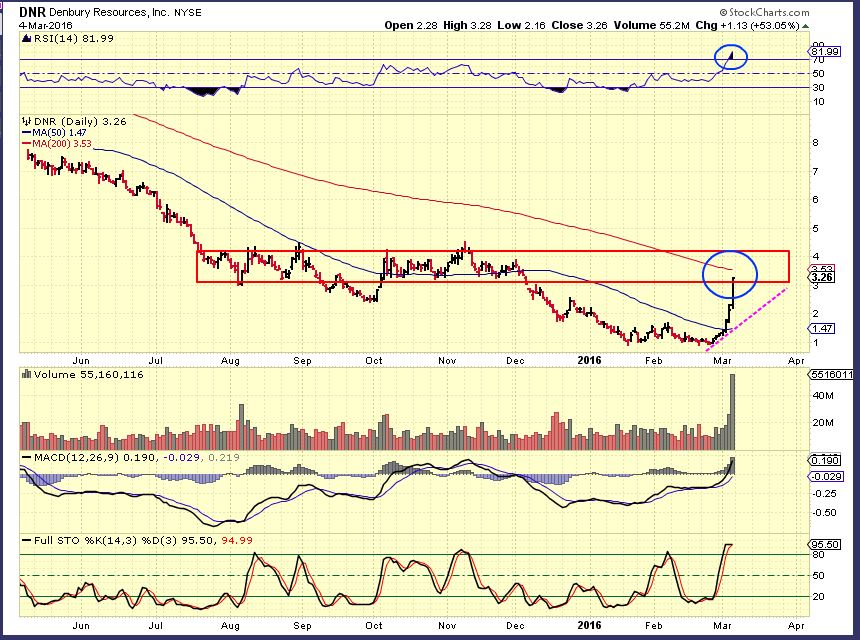
As a trader, I always mention looking for a place to sell that might be reasonable. Maria mentioned in the comments that she sold her DNR and I think it was a good idea. I wrote : That was a fantastic trade. As it is working its way through resistance ( And doing a nice job) it does near the 200sma and is in the extreme overbought zone. It could just go sideways and flag, but also may drop 50% or to the 50sma or trend line shown, so I think it was a great trade, and a great time to sell, even if it pops to the 200sma and then drops.
I just sold all of my SWC, but I may be early. Here is why:
I loved this set up and posted here about buying it under the 50sma , because SWC already released earnings and were doing good. Why did I sell? And why might I regret it? 🙂
.
SWC- I noticed the extremes that were former highs, and how it has struggled at the 200sma in the past. I saw the reversal starting Friday afternoon and sold, hoping to re-buy lower. Now looking at it, I know that it could just crawl along the 200sma and get back inside the channel , then run higher. Why do I think that?
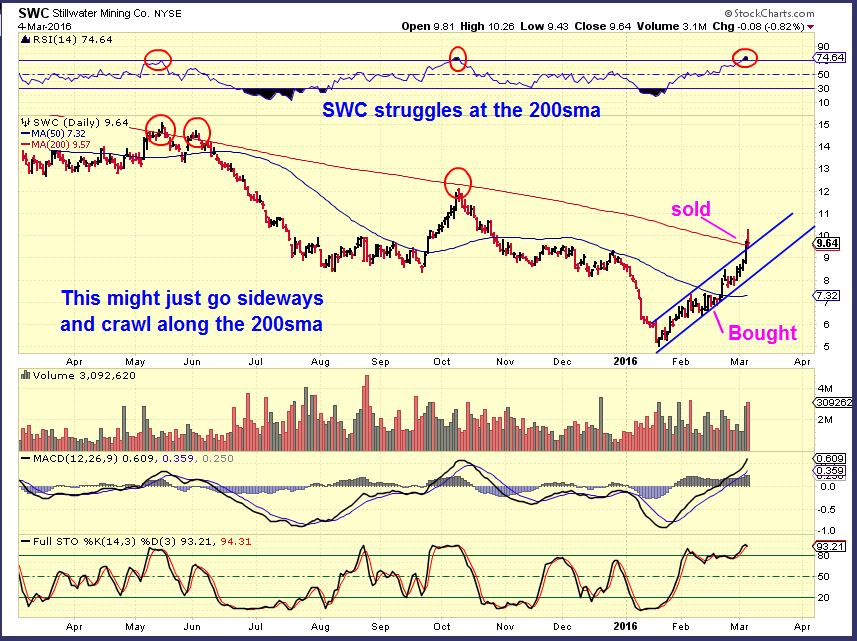
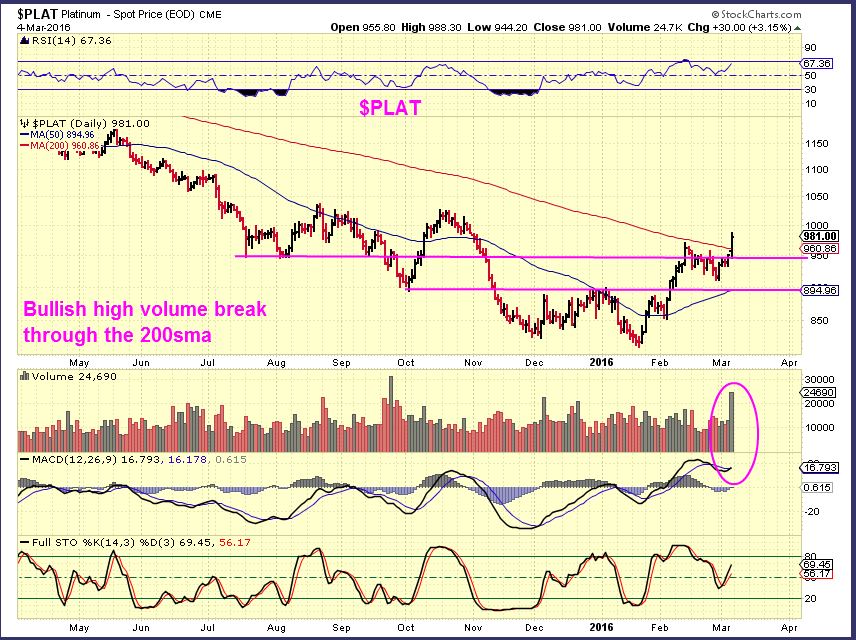
SWC – Is a Platinum and gold miner. PLATINUM just broke out Friday with conviction. I see a giant inverse H&S. This is also bullish for Gold I.M.H.O. I look forward to owning SWC again, I think it will return to the $20’s if this keeps up.
For traders: You may recall that I mentioned a week or so ago that some SHIPPERS perking up.
EGLE, SALT, SBLK, NM, SB, PRGN, TNK, SHIP, DRYS, DSX are some in that category. They are acting well , but are a bit risky.


Dear Alex, I signed up last week and I am thoroughly impressed by the depth and breadth of your research. I was not expecting such an extensive report. You mentioned TK at the end of your report. I have it and like it as a buy and hold long term, not only because of the chart, but fundamentals. Q4 earnings was on Feb 18; solid free cash flow, increasing net income and increasing dividend payments. I know some of your members are traders, I do that as well, but I thought I might share my ideas here for those who might want a buy and hold idea. Though please do due diligence first.
Thanks MsCrystal – for being here, for your kind words, and adding your thoughts and research . Much appreciated.
Your comment says ‘TK’. Just for others reading here, you are probably discussing TEEKAY TANKER, the shipper. Their earnings were released on FEB 18. So that was Ticker TNK
http://www.marketwatch.com/story/teekay-tankers-ltd-reports-fourth-quarter-and-annual-2015-results-2016-02-18-61734531?siteid=bigcharts&dist=bigcharts
Thanks again !
Good evening everyone!!! Any ideas on how to deal with SDRL??? I’m trying to figure out how the heck to proceed with it, but i can’t get a clear idea. Never thought it would take off like it did. Would have typically sold at 200/250 sma. But never imagined it’d make it there in 3 days. Weekly chart shows the price mark-up could be just getting started. A trailing stop of 10% might lock in gains, and shake me off before closing higher again. Anyone had this before?? In all honesty, this is the first time it happens to me. Give me some ideas…..
Hi Peter,
I love it when that happens 🙂 I have had it happen to me ( huge pop, but not always that big) and it plays out differently each time. Sometimes you get that huge pop and then it just drops back down, other times consolidates in a sideways up & down range before continuing higher. Other times it just keeps going higher in ridiculous fashion, and then falls apart later.
What I do ( And I hate to do it emotionally) if I have a large position, is I take 1/2 right away an let the rest ride , with a reasonable stop so that I keep profit on that 1/2 too. If it keeps shooting higher, I keep selling.
I’m not saying to do that, I dont know how big the position is, etc. That is just how I have handled it in the past. AT times you sell 1/2 and it goes higher and it hurts, but if you hang on to it all and ride it back down, it hurts worse.
Nice trade 🙂
Thanks Alex! It is a small position, but sitting already on almost 200% gain, so I would hate to give it all back, but it could as well keep going higher also. I’ll probably watch some today and see how it behaves, might sell some like you say, and let the rest ride. Or sell all and see how it behaves then. Energy should be taking a rest in the next few days, IMO, so I’ll be watching closely for a move back in. We’ll see. I’ll keep u posted.
This was just one idea from me…anyone else who can help Peter out with what they have done, please feel free to add to my thoughts.
I FORGOT TO PUT IN MY REPORT that 2 more sectors of energy are setting up properly. SOLARS and URANIUMS. Something to keep an eye on for Traders.
JKS, TSL, SOL, SCTY, FSLR
Uraniums like DNN ( a proper base) , URA (etf) , UEC, and I think URRE may pop today , unless any bad earnings or news comes out. It does have a reverse stock split in the works, to get price back over $1
SOL has earnings March 8.
Thanks, Good to know.
I haven’t been following the solar earnings, but I think I recall off the top of my mind hearing that FSLR did good, and SCTY had trouble, but SCTY chart looks to possibly be bottoming.
URRE has a flat bottom, trading between 0.25 and 0.22. Its at 0.22 now, I bought last week. A stop at 0.21 is safe. It looks like it wants to pop. Earnings are on the 17th. Some Uranium started poping like you said.
I like the look of that URRE Base Bill 🙂 ANd DNN just broke out , things are starting to look favorable in that area.
UEC announced a $10 million financing just before the open. Dropped below the 50 & 10 DMAs on pretty good volume. Pulled back to recent support at 0.85 where it’s bounced around for a week or so. Could be a great entry point.
Also, earnings will be out this Thursday after the close.
I posted a chart of LGCY in Fridays report, I love that chart, and I posted this in the comments when I got back from the dentist Friday ( refresh).
.
These were still looking early in their bases. That is what you want to look for if you are trading energy.
…who is Maria?
More importantly, How do you solve a problem like Maria?
giggle… i was watching that around the holidays and had to take a pic of the tv while that song was singing….
I went and saw this st the Fox Theatre in Atlanta last week. It
was wonderful.
LuckyDuck 😉
Wow, I dont know if that is correct, but I just checked LGCY pre-market and it is up 30% already?
I added Friday afternoon, but I wanted to add a bit more today, based on that chart in my report ( I will re-post it below)
.
LGCY broke out friday from that base.
.
yea… HK 2 … giggle
And NADL – But I only mentioned it in the comments, I never had it in a report.
Loved that base too.
Still riding that one from 1.68. Thanks for mentioning it and for everything you do!
Hey Pieter,
Nice move on that one! Nice trade ( I missed that one).
Not sure how big of a position it is, but if I own a stock up HUGE 3 days in a row, I take some off the table. I did it with BAS, VALE, MIners , etc.
…and your welcome, thanks for being here 🙂
Just an F.Y.I.-
I mentioned in the report that I sold 1/2 of my Vale Friday afternoon. There is good liquidity in Vale pre-market and it is up 8% so I sold another position ( now 3/4 of my position) at $4.74 pre-market.
I love this stock and it could go higher, but in my mind- the way that I look at things- the reversal Friday does show me that sellers were able to overwhelm buyers into the close, so I am going to lock in good profits and hope for a pull back below my selling price in the weeks to come..
Big drops in KEG and CLINE? Any thoughts CF? Both positive earnings
I show KEG up 36%, CLNE down 1%
I posted before the open. I was referring to their sell offs on Friday. Seemed odd with others moving higher so quickly.
PQ you mentioned Friday. Its still lagging, might be a good buy here. Any others that are lagging?
I just bought PQ at $0.58
I mentioned ARP as a lagger in a base. Popped this a.m. though
I thought PQ would take off today? Stalled
BBEP & LGCY did the same thing Friday, sold off from the highs, and I added to my position.
BBEP up over 70% today
Alex .. nice pointer to BBEP on friday… now up 70%.
thx 🙂
I assume & hope you’re saying that you bought it 🙂
Yeehaw… I bought both BBEP,LGCY, & ARP
i did!
im surprised no-one else is mentioning TPLM though.. since last wednesday, its so far maxxed at 350%!!
I forgot about that one, I used to own it!
And WRES 500%
its good to be here Alex … no way i would be buying this stuff unless i was subscribed to your reports..
THX S.O.G.
I know, they are cheap and beaten down and look very dangerous, but if il bottomed and commodities are taking off? They recover , especially if they already released earnings.
Also They move fast and they get hard to let go of, but I’ve been holding my energy for 3 or 4 days max after they really stretch out , sell and lock it in ( Or partial) and look for another trade. I may regret letting some of them go, but I’ve been burned in the past when they pull back.
You’ll make good enough money that way. 🙂
P.S. oops, I lied, I still own BAS and I may not let go yet.
yeah.. his pointer has definitely been up steady ….
Man! Had that one on my watchlist and didn’t pull thr trigger. Darn!
UGAZ !!!!!!
For anyone looking for an energy stock moving higher at a normal rate, not under $1 , but has a solid looking base ?
I mentioned CNX last week, so see 1 yr charts of
EMES & CNX
Bought PQ and LGCY late last week. Also one of my favorite gold stocks Claude Resources is getting bought out by Silver Standard. Boo. That’s my second one bought out on the last week.
I KNOW! That was such a solid company. My LSG got bought out by TAHO –
Go LGCY! I own PQ too, needs a little giddy up
Forgot about LSG. That makes three.
Looking at ARP on a 5 month chart, great volume coming in. I know its up 30% and impossible to want to add, but if you own it from last week, I would NOT sell it.
The earnings were good. It looks ready to really move higher.
yeah, its up so much from my entry I’m not wanting to add, but I am also wanting to add becuz I can see this doubling , the way these are moving out of their bases.
The way everything else has moved, I think it should. You bought PQ, its was already up off the lows? This looks like a lower risk to me.
Yes, I bought PQ today ( Not a huge position- I used my profits from SWC). I like the way it looks, but it is having a little struglle getting going. If you look at charts, they all did at first . BBEP LGCY last week,
Look at REN, every time it popped higher, it sold off – but eventually the sellers are gone. Short cover & buying takes hold.
I should check PQ earnings though ( Edit- released last week)
PQ the estimate was -0.16 a share it was actual -0.47 a share, so a surprise to the downside of almost 200%. BUT, many others are the same and still poping. Look at EXXI, it missed.
Yeah, BCEI took a dive, stopped me out and then took off like a rocket
BCEI looks like ARP a day later
There goes ARP, up 10% while we discussed it.
Wow- I left for an Hour and ARP exploded
URRE making a move? Baby steps, baby steps, carful!
hopefully so.
bought on your recommendation Bill .. so i’ll sue if it doesnt. 😛
Hey, URRE Looking better and better here 🙂
I like it
I sold 1/2 of my BAS Friday with about 50% gains. I guess that was a bit early. : )
Thats what you get for staring at a 2 month chart, and not the 1 year chart
Man – Breath taking
wow… sure is .. im not sure just how much more of this I can take… it’s exhausting….
*kidding of course 😉
I wondered where you went… was watching CRK , ignoring DNR & MDR ( Our other 2 that we sold) 😉
lol.. u had to mention that … didnt u… .lol lol
I refreshed expecting a gif of dynamite & Wylie coyote or something. Very disappointing 🙂
when’s the last time you saw such explosions…across the board like this…
i laughed when A said to just throw a dart to pick any..
thats basically what i did (with a bit of TA chucked in!)
lol…..
That dart on TPLM was a keeper 😉
… i was busy working still…
Oh man, I was all Maria today. I was supposed to be working this afternoon, but no. All I could do was stare at energy charts all day. Too bad I wasn’t able to post a bunch of funny gifs as well!
Teehee… howd it feel wearing a skin tight leather suit and 3″ heels? Meowww…
besides.. make up your mind chartfreak… .. one minute it’s “…… if u dont refresh u wont see them… where’s the ignore button… next minute im being scolded for not using them ….
geeesh … #WOMEN – i swear….
*Men – oops
…
so… mindblowing for you .. aye.. hmmmmmm… ;o)
when’s the last time you saw such explosions…across the board…well mostly…
Look at EGLE & DCIX (Shipper) and NM & SBLK . DSX, TK & TOO. HHHMMMMM
I was looking at ARP at $1.10 and thought, I should add a small amt, good volume today.
Then BOOOM…it was gone
TK is a keeper. I mentioned in response to a blog post where you listed TNK so I may have caused confusion– I think it has a lot of upside — and as I mentioned in my earlier post, solid ER, dividends. It doesn’t have the mind-blowing performance of these oil moves. It’s “only” up 7% today 🙂
I agree, I think it does look good and the shippers are starting to move quickly. It may have the mnd-blowing move soon 🙂
look at EGLE today
Brilliant 🙂
Good afternoon, Alex –
Have you looked at SSRI lately? For some reason it left the party Friday. However it did get 30cent-ish close to your target, so maybe it’s just time for a rest. I’m traveling for a couple of weeks and only hit the computer early and late, and just now found the follow thru to the downside
I believe it is because they were buying Claude resources for 253 million.
The buyers often drop , the one being bought often pops. It’s a bummer when it happens, it really stalls the progress, even though they just bought a great company.
Thanks so much for the info – I bought it for the long-term and will probably keep it depending on how it acts
I was tempted to sell BAS today after 3 good up days, then I saw EPE and thought maybe I should wait
a lot seem to be targeting the 200 daily sma.. TPLM, REXX, WTI
….WRES, REN, SDRL, CQP pierced and fell back.
DNR, BBG, EPE now above the 200.
think many of the others you’ve mentioned recently will get there too?
It is a good target.
Some may struggle at that point and still work their way through it later.
i was looking at SDRL,, it’s putting up a fight. CQP is fighting, but the fact that some got through might be a good sign ( as you said DNR, BBG, EPE .
Check out TGC with the 200sma
wow.. does your chart have that spike above the 200 last september, or is it an anomaly of my chart?
im seeing a high of 0.58
Alex, a couple of ?s from one who is new and really wants to learn more about when to sell— when buying off these long bases that bring double and triple digit returns in a few days, I know it’s wise to bag some gains right off the bat. But looking at the 1yr and even longer charts, I am tempted to dig into the fundamentals of these picks and just buy and hold for the long haul. Wise or not?
It depends on whether or not these are THE lows or just lows. I think OIL may have bottomed and commodities too, so buying and holding could work, IF, you can take the draw down.
If you lok at my charts of VALE in the report ( 3 of them). That is why I put them there. These could pull back in many ways, and lose 50% of recent gains and still be fine, but it hurts riding it out.
I have done it. It also hurts selling early and watching the stock you sold move up another 50%. SO I sell a partial and look for signs of strength and weakness. Sometimes it’s a matter of experience.
PS these are the stocks I have that are all up significantly in the short term but could go exponentially over the long term if oil holds (hopefully) EXXI MPOY CRK KEG SN BBG HK EOX NADL CHK GDPM
Lesson to everyone. I lost track of my stocks this afternoon. REN sold off in advance of earnings after hours. I actually did some work today and forgot to check. Should have had a stop. Know when earnings come out. Hopefully earnings won’t matter and I get a bounce back. REN come on
Good Luck, Bill. I know that you have had more than enough good trades recently to make up for it. I am in a few names – BAS, WPX, ERF. All of these have reported earnings for this quarter in case others are wondering.
Looks like it got a little pop in the late after hrs. I see it up 6% from the closing price.
Earlier today (before BAS blew up) I was ‘upset’ b/c my energy plays were only up ~ 10% instead of 60 or 70. Upset about +10%. HA! Now, that is some perspective, huh?
Still holding BAS though selling some today would have been a good move. I wrote some covered calls hoping to lock in at this level if we move back down over the next few days. Crude has had a solid move, wouldn’t be surprised if it moved back down a bit to reset.
I did buy a little bit (seriously small here people) TZA. Not intended as an outright short, but more of a downside protection (hedge) for some of my other positions. Still holding NG (suxs!) and EXK in miner land.
Anything out there still in the buy zone? Looks like most of the energy names have at least made their initial move. ERF has been slow, seems like I could add to that ones. Not going to chase the explosive 3 day moves at this point.
I have had my sights on UNG for a long time and the volume today was just massive. I bought at $5.88 and $6.02. I have tight stops. Let’s see….
HEY ALL- The website has a glitch, it wont allow me to upload my charts. I’ll have to write the report in the A.M.
That may push the release out closer to the opening bell. I will try to get it fixed and work quickly.
Less talk, more charts 🙂 Thx for your patience
UPDATE – I AM ABLE TO WRITE THE REPORT, BUT STILL UNABLE TO UPLOAD THE CHARTS. SUPPORT IS WORKING ON THE ISSUE, AND I HOPE TO RELEASE THE REPORT BEFORE THE OPENING BELL. SORRY FOR THE INCONVENIENCE.
Maria, I know, my caps lock is stuck on. 😉
😀
I still had to upload the charts. I’m trying to use word, but its giving me a hassle with charts too
OK, CHARTS ARE LOADING, I may break the report up into 2 parts . Be with you all soon.
The Report IS finished