
TRAPPED
We were not long the markets over the weekend, but if you woke up Monday and you were? The above picture is a perfect example of what that probably felt like. Dow futures were down hundreds of points and there was no escaping the bear claws. We expected a drop, but I was very surprised at just how fast and deep things unraveled.
.
There will be a bounce, notice on the left side of this chart that even in Bear market sell offs, there are bear market rallies. Pretty big ones. We want to watch how that unfolds, as mentioned in the weekend report.
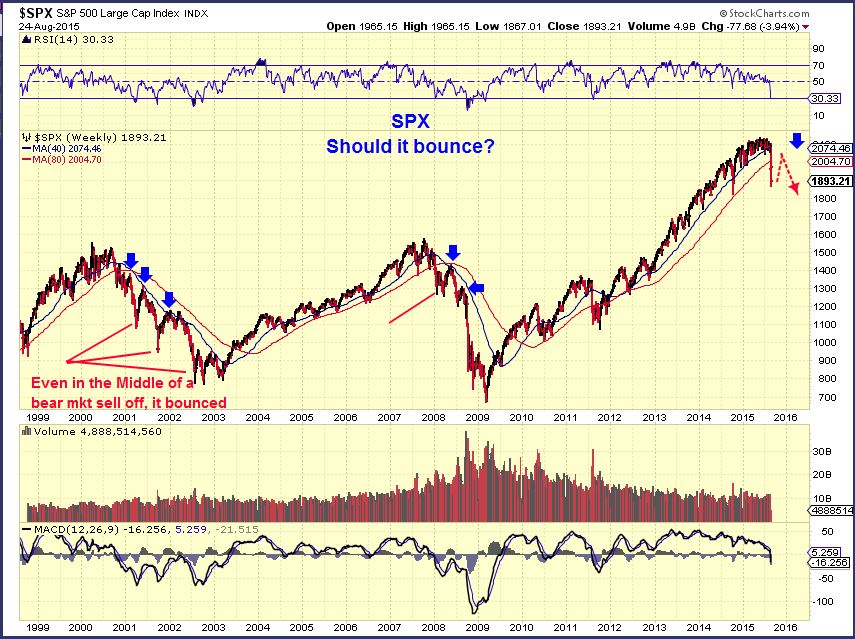
Reminder of a possible longer term target
I’m not going to cover all of the carnage (DJIA, NASDAQ, ETC), I expect a bounce. I am not playing it long at this point, but there may be some good set ups for short term trades.
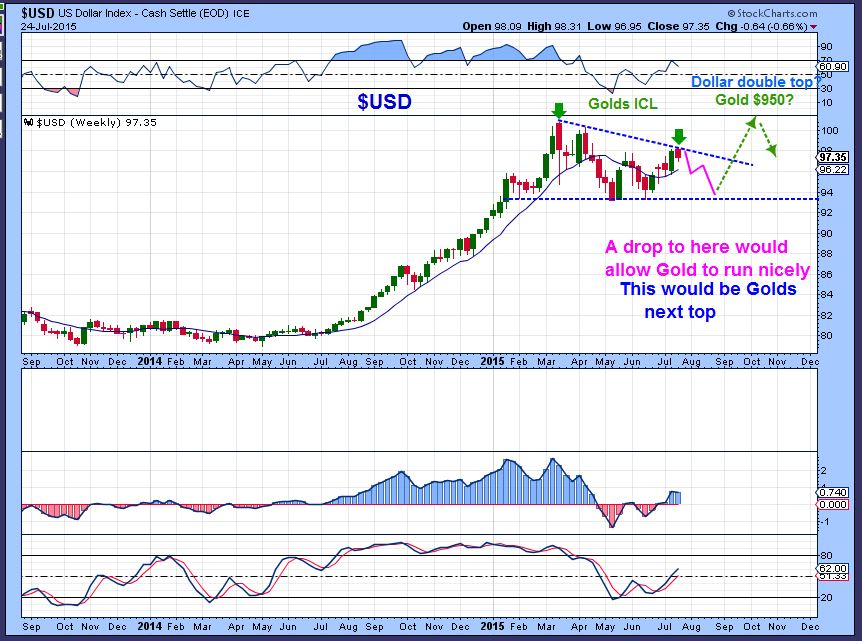
In July I showed that I expected a drop in the USD to the lower support line.
USD – Wow, that was fast!
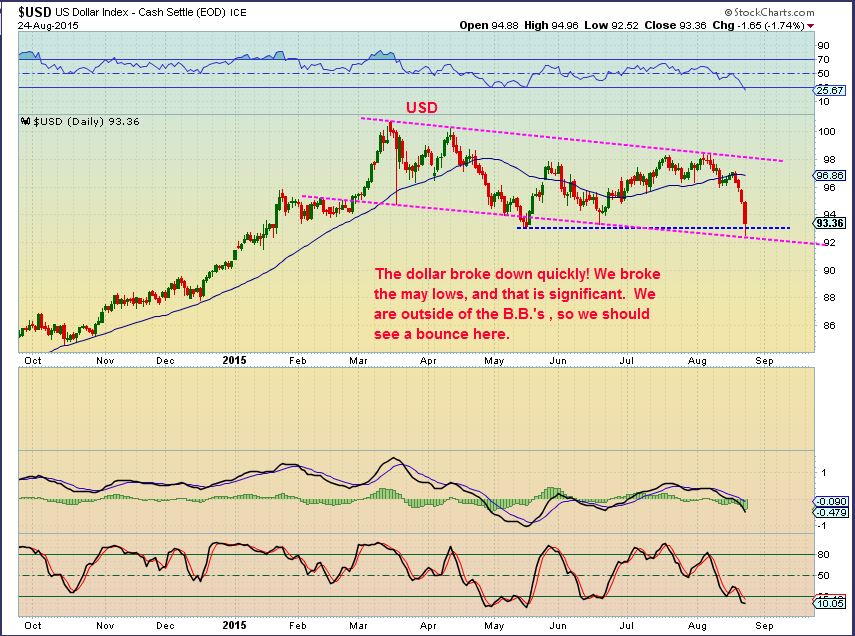
I was disappointed to see the dollar drop so rapidly Monday and Gold, Silver, and Miners not rocket higher, at least for one more day! Now with the Dollar due to bounce , Gold is due for a daily cycle low. What about Silver & Miners? More on that shortly .
WTIC – It really looks like OIL wants to test the 2009 lows. We do see divergences on the weekly chart. I expect a nice rally when this selling is finished and some energy stocks are starting to perk up a bit early. See WG, REXX, CRK, QTWW (not oil, but energy) , etc

I want to move on to
GOLD, SILVER, MINERS
Did I love the action today ? No. Did I personally lose money? YES!! I expect to lose some money on the way down into a Daily Cycle Low, but when Gold is making new highs, and I am giving back some very good gains, it is frustrating.
All we can do is look things over and decide how we want to play what we are being dealt now. Some were buying the opportunity for lower prices, others were selling to watch from the sidelines. Both choices were perfectly acceptable. Let me show you some “Stuff” that I’ve been looking at.
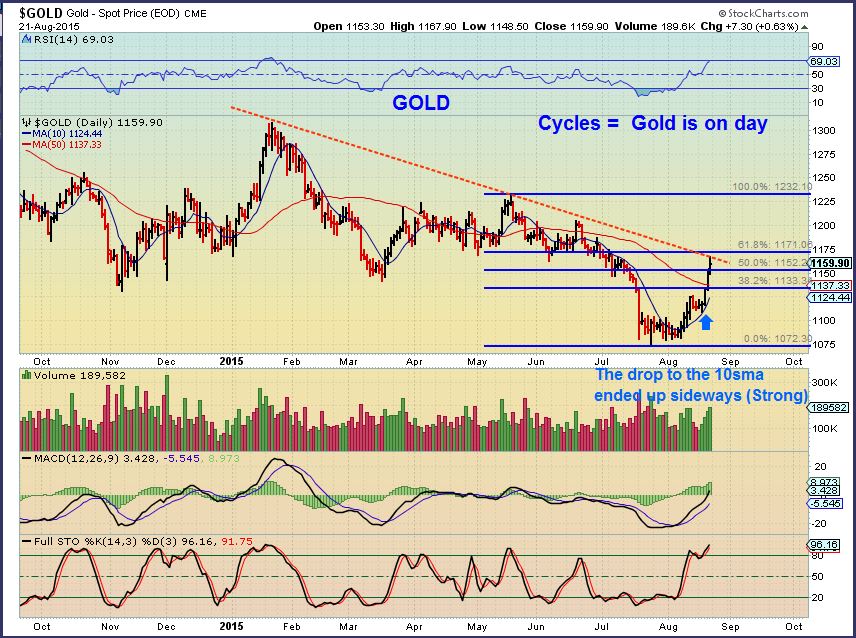
GOLD – Gold acted the way it should at this point. (I just noticed my count is wrong , day 2 is really day 1 and each day after is one less. We are on day 21 , Sorry).

2 reminder charts from the weekend. Gold can simply drop to the $1130 area and find its support and DCL.
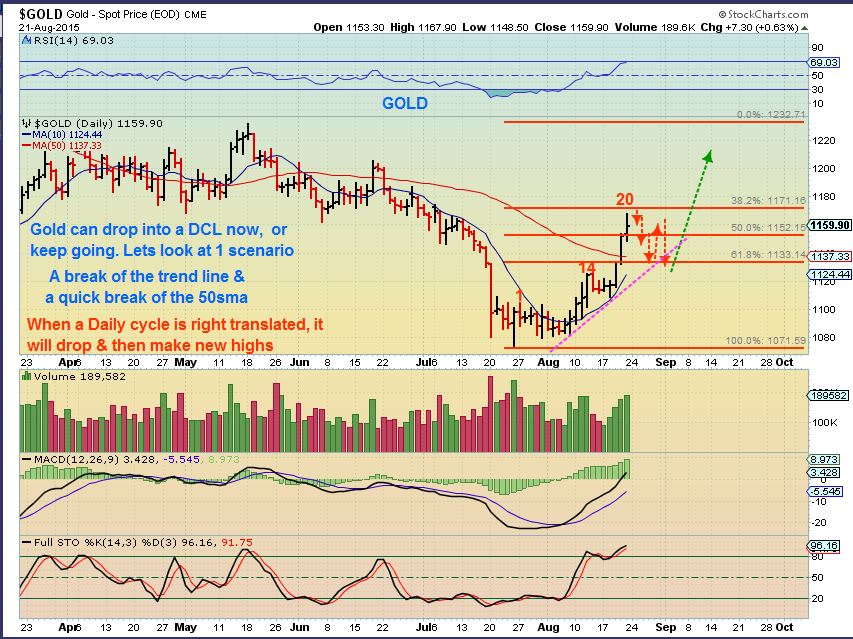
Gold was at resistance and the fib 61.8% bounce number, so I understand why it didnt just burst higher today, but I still think that it should have with that Dollar plunge.
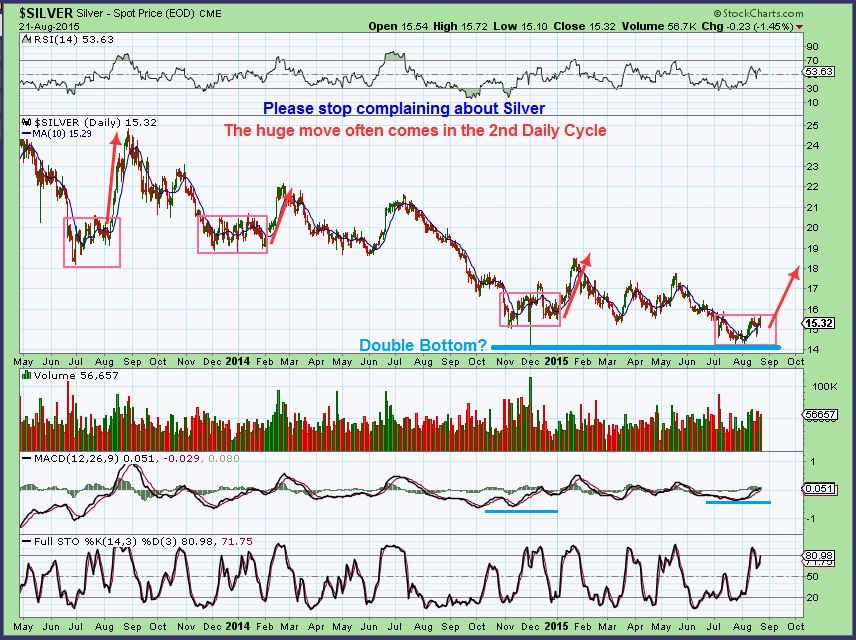
I used this silver chart this weekend to show how silver acts in the first daily cycle. YES, I HATE IT TOO. Silver bottoms out often during the 1st daily cycle, and really moves in the 2nd daily cycle.
.
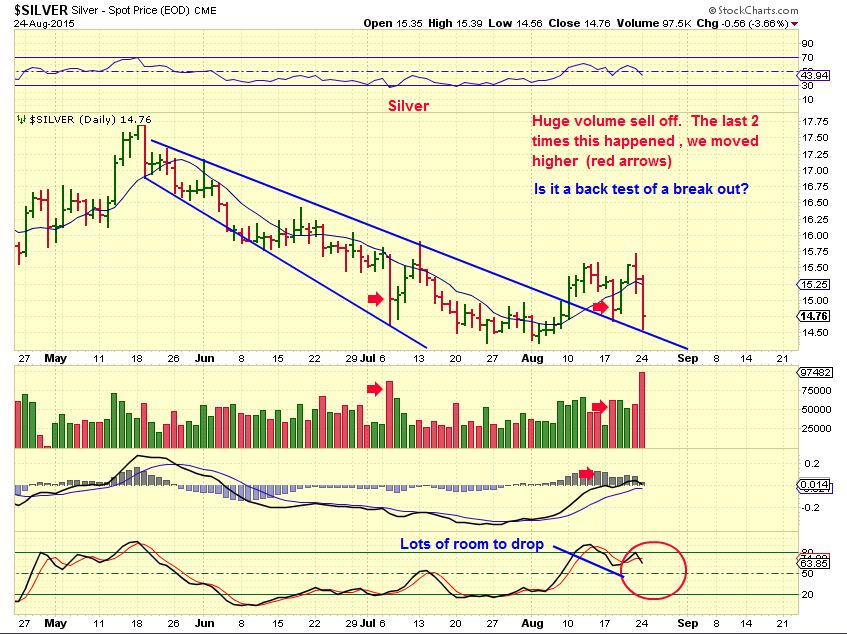
Silver got dropped today. I want to tell you this, silver looks horrible at the lows in every case in the chart above. Today was high volume and looks ugly too . I confess that when I draw this chart, it is with a bit of bullish Bias, just knowing how it acts near lows. If this breaks down, it may get ugly. Stay alert. Nothing says that we cant ride that blue line down too.
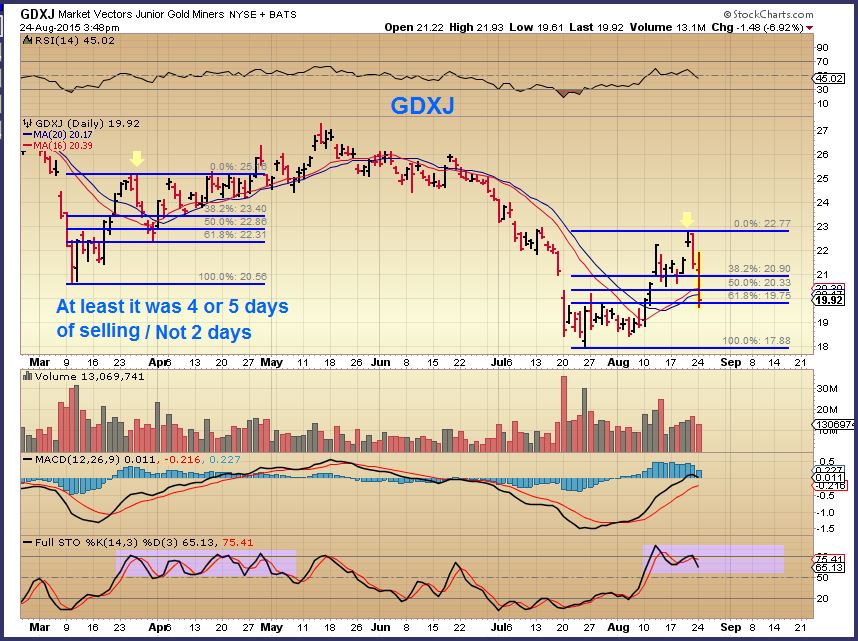
EVERYONE IS TALKING ABOUT THE MINERS. Disappointing? YES! This was a strong run off of the lows. The dollar crashed and with Gold at highs and our Miners took a nose dive? UGH. All I can do is look at where we are and possibilities.
GDXJ TODAY – We dropped fast , but it looks similar to the March drop. From the lows to the highs, we then fell 61.8% (yellow arrows). It took 5 days in March, this drop only took 2 days. Not ideal. SO a sideways move while GOLD dips into a DCL would be 1 thought.
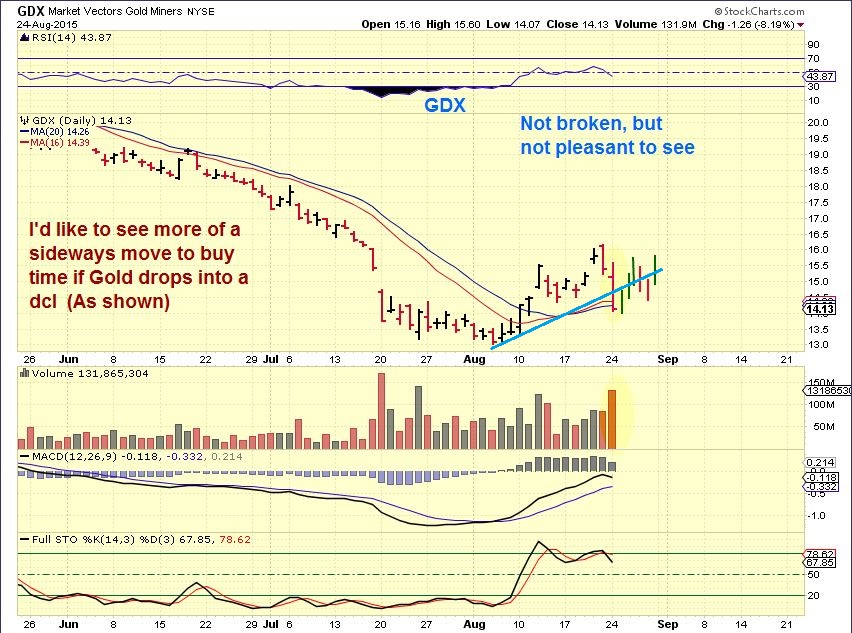
GDX – We have a trendline break and a break of the 10sma, so GDX seems to be falling into a dcl. Even though it made a lower low in August, it MIGHT be on the same count as Gold and GDXJ. They bottomed on July 26. I drew a sideways consolidation as a ‘hope’ , but it might just stumble and fall like NOV 2014.
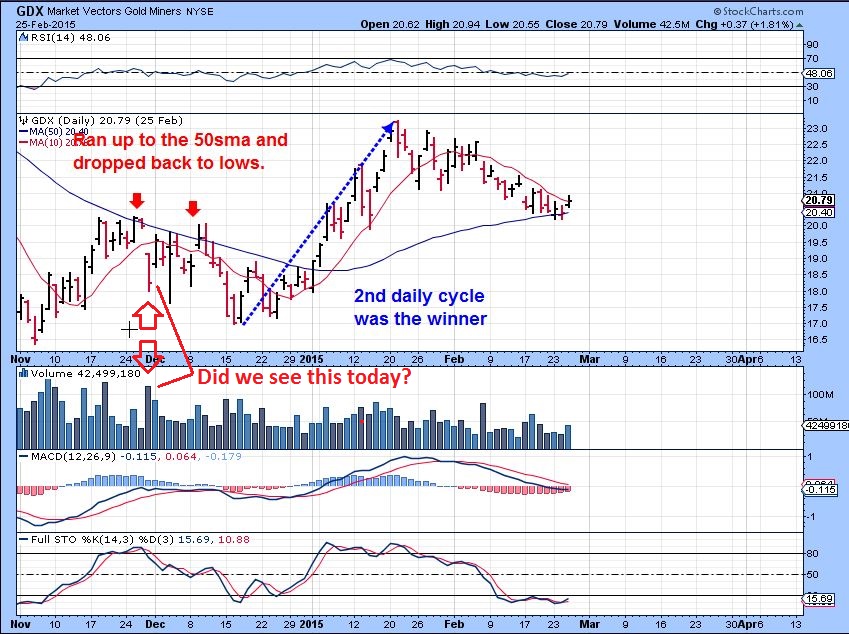
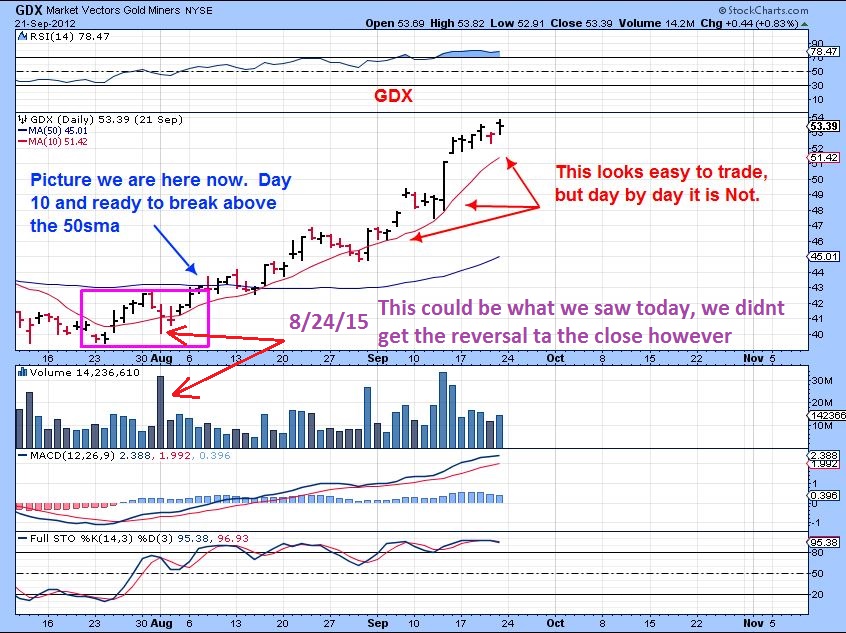
Now I want to show you 3 charts of GDX lows ( ICL) where price went up and dropped sharply like we see now. At least it helps to see how things played out then.
GDX 2008 – THE Bear Mkt Lows, dipped back down to the bottom. I said a sideways move now would be nice based on this double drop in 2008.

GOLD Nov 2014 – Who can forget this dip back to the lows? Frustrating! Notice the High Volume plunge that came out of nowhere ( 1st red arrow). It then bounced higher, and dropped back down again. THAT could be considered a sideways move too. As frustrating as today was.
July 2012- GDX went sideways along the bottom like GDX just did. It then popped higher to the 50sma and quickly dropped right back down. High volume drop like we had today. The chart should say that we didn’t get the reversal at the close. ( Typo)
So we have to see how this plays out, but if if if Miners are leading and we just break down, then honor stops. We have to accept it if it is not acting correctly.
Let me show you 2 more charts. The purpose of this is to point out that at the Nov ICL and even the March ICL, some Miners that make up a big part of GDX really bottomed in November and came all the way back down in Dec. THEN when everyone gave up, they rocketed higher. The 2nd daily cycle may be the one to profit from.
GG – BOGUS 1st daily cycle, back to the lows. It does happen.
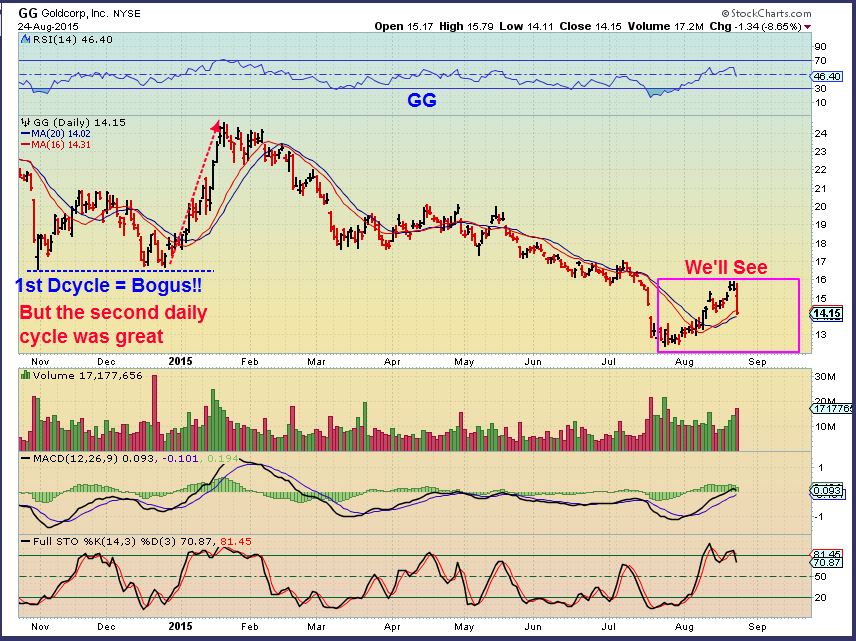
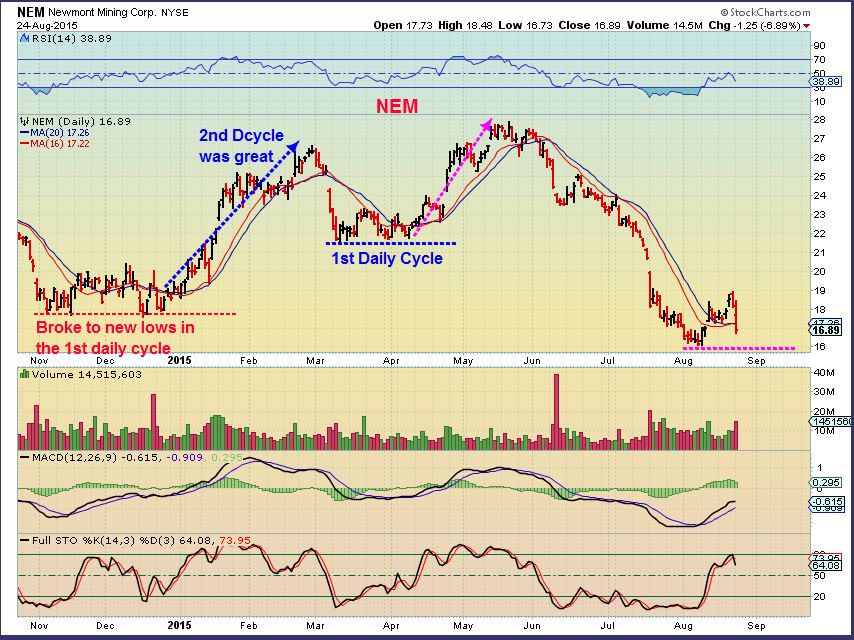
NEM – dropped all the way back to the Nov lows (Even broke them) and rocketed higher in Dec-Feb. March lows were also 1 month at the lows, then Rocketed higher! It can happen.
SO I wanted to dig in and see if we have any reason for Hope here with our Miners? Yes we do, but it has to be considered 50/50 in my book. These markets are all over the place right now and I was a little let down with the selling in Miners with gold near highs. That being the case, anything can happen and we must set and honor stops. We can always get back in if a dcl forms and we start the 2nd daily cycles move higher. They move well and we can make money when its a little clearer how these miners want to act. I still hold positions, but I have given back some of my very nice gains. I dont see any nice set ups to buy right now after such a strong drop, so we’ll see if any form as this move down finishes. Best wishes, breath deep, and try to remain emotionless. 🙂


Yes… it’s disappointed Alex, but…… lots of hope, it will recover very soon !!!!
Thank-you.
Okay CF, so it looks like we could see another double bottom in GDX. Which would wipe out all our gains. A retest of $13.01 is over a $1 a share away. With gold getting ready to move lower, why not sell everything at the open and buy lower next week? It almost seems certain that will happen. I guess everyone has to set their own course based on beliefs. Refresh for the current SHARK pattern in GDX. Should go to either red circle.
I see that as completely inevitable
word
Which one?
Gold down, NUGT up? Whaaaaat!
Of course you can sell everything and get in at your shark bottom.
Too late, already at 88.6% for NUGT. GDX will follow. Quick.
What is 88.6% (The drop from the top?)
With NUGT it’s the Fib retracement from the low on 8-5-15
Was going to lighten up on GDX with bounce today but price moved too fast for me. Very frustrating. Wish I had set a limit order!
Excellent report Alex.
Thank You Ken,
Its funny how we look back at prior lows and you hear “I would have easily bought and held that and made great gains”.
Then in real time , its like standing in the cold without a jacket
Lol !!! So true.
It’s never easy that’s for sure!
FWIW:
I have committed that Gold hit its ICL in late July. With that commitment I feel Miners will follow especially in its second daily cycle.
I am even prepared if, God forbid, GDX makes a stop run below 13.01.
I’m getting spanked on the miners I doubled up on Friday – but I agree with you, Ken, that until proven otherwise it appears Gold’s ICL is in place. Sometime today, I’m increasing my GDX & GDXJ by a third – maybe very shortly now that the 15min RSI is waking up a little bit and the oversold MACD looks ready to cross its average. EDIT: I need to cool my jets and let some more time pass to see how this daily cycle plays out – there’s no need to be in a hurry!
Agree Cal.
“They” are not making it easy that’s for sure but ………
The thing that bothers me is we still have lower highs in GOLD. Still in a downtrend. Buying and holding for a recovery that may not be forthcoming soon?
No , buying for a 2nd daily cycle , since Gold is right translared and in the past the miners have excelled at the 2nd daily cycle. Then we sell ( maybe try dust into that dcl ) and see if a 3rd daily cycle is a break out or break down.
Step by step…not for a recovery mode yet. 🙂
I think we are all in long here, based on all the talk of ICL. I for one am heavily invested in miners. I didn’t see the quick demise of the miners that we had this week and last. I’m prepared to ride this out to 13.01 but I hope we don’t get a lower low. If we get down to 13.01 I’ll buy more and go all in with a tight stop. wishing everyone good luck.
Agree Bill……especially if Gold is near its dcl.
Same plan here. I had intended to add at 10 and/or 20 SMA but it sliced through them with such vengeance that I literally didn’t have a chance (thank goodness). Also wasn’t into buying with DOW down 1,000 points, the volatility created an uninviting environment. I plan to add at double bottom; after today I don’t see anyway that it doesn’t retest that.
Other thoughts – the weakness in daily cycle 1 is a bad sign. The other issue – miners/gold versus equity markets – same old, same old. When stocks get clobbered, miners go down b/c they are equities. When equities recover, miners still go down. No change in character. Strong evidence to me that the bear lives on. So, we are playing for a 2nd daily cycle top and then I’d get the heck out of the way. If I end up being wrong, I’d much rather add at a higher price then follow the final gold drop. Much.
Hi Ken. Just trying to learn here but in your chart above could your abc points be sub waves 3,4 and 5 instead, which would then make the first minor impulse wave up complete and allow for a correction up to but not exceeding the complete depth of that potentially first larger wave 1 up, if of course that is what it is and I’ve understood that correctly. That would likely point to a bit more backing and filling yet short term to complete a corrective wave 2 before a more powerful wave 3 gets underway, which would potentially fit quite neatly with Alex’s expectations for a 2nd daily cycle once this first one has put in it’s low?
That is where I am. double bottom, (hopefully) stronger 2nd cycle.
Hopefully!! 🙂
Chris.. it is still a possibility that $GOLD main wave 1 hasn’t completed its 5 waves yet.
this correction at the moment could be a 4 (dunno how deep it might go, with possible double zigzags etc)
see this EW….
oops.. spot the deliberate mistake in the previous..
Wow! Very impressive and detailed analysis there SofG. Hopefully…and I hate using that word as ‘hope’ should not form any part of a trading strategy…but I do hope we are genuinely seeing important lows now in the whole PM arena. Just watching silver carefully right now which is sorely testing it’s prior low. That could be a VERY deep retracement as Alex has pointed out happened on prior occasions. But if it actually breaks the prior lows I’m not quite sure where that will leave us, especially with gold looking so much stronger! Maybe some kind of false break down on silver but would have no idea what the counts might be on silver then! But great analysis of yours and thanks for sharing.
2 days ago the Gold Silver Ratio hit a trendline that i had in place for a few years.
It was a line running from a peak in 2008, parallel with a line between the lows of 1998 & 2011.
Call it a target if you like, but it hit, and is now falling back away from it
I like the look of that! Amongst other things I’ve started accumulating physcial silver bullion through BullionVault.com as an alternative to holding cash in bank accounts, which longer term I have certain fears about! So if I’m undersanding this ratio chart correctly a nice reversal here would be a positive for silver and especially if gold was still rising in price as well!? Thanks again for sharing. Greatly appreciated. On this general subject I’m tracking USDCAD as from what I can see if gold/silver do well then in broad terms the CAD will tend to strengthen also. Currently CAD is in a major downtrend against USD but I am seeing a possible wave count where a major 5 wave move may be ending or close to ending which would suggest a major correction for the USDvCAD if not more. That would potentially create a nice tailwind or certainly remove a headwind for gold/silver as well. This 4 hour chart is still very much a ‘work in progress’ and nowhere near your standards of EW analysis but seeing some nice divergences on MACD and RSI on the daily charts, which potentially adds credence to this scenario and suggest we may be at or very close to a bullish turn for CAD.
Im stacked to the eyeballs in physical silver too… you are not alone there 🙂
When GS ratio falls, it is generally bullish for the PMs, with silver leading.
Well as much as I hate using the word, here’s ‘hoping’ that ratio starts dropping like a brick!! I’ve just seen silver slip below the July lows on a price spike. Goodness knows where that leaves counts now!! Maybe just running stops, which must be lined up there. Also I am VERY bearish on equity markets longer term but after a bit more messing around this week I can see potential for a bit of a bear rally after the recent plunges. Hard to see that being especially positive for gold/silver in the very short term so I suspect our ‘nerve’ will be tested a bit more yet!!
‘hopefully’ no more than just a double bottom retest of last years low ($14.12)
I ‘hope’ so also!! But looking back that was an amazing spike low that ended up as a very bullish daily looking candle!! This looks a little different..at least so far!! If these levels really crack I may consider trying to hedge my bullion positions in some way in the short term as I have absolutely no intention of letting those go..at least not any time soon. Those are my LT insurance for when the game is finally up with QE and the fiat currencies!! Just finished reading a book called The Big Reset by Willem Middelkoop, a Dutch economist. Found it a fascinating read and it filled in some many blanks for me but also just confirmed many things I’ve believed about the current monetary system but couldn’t explain very well. This book does a fantastic job of that and will certainly confirm your reasons for holding gold/silver bullion in the longer term.
There is a non-leveraged (x1) inverse silver short ETF, running on the London Exchange, i believe.
Check out SSIL..
http://bigcharts.marketwatch.com/interchart/interchart.asp?symb=UK%3ASSIL&insttype=Fund&time=8&freq=1
Thanks. Added that to my watch list. I note it’s only a USD quote and have checked their web site and definitely no GBP quote, so a bit of FX is involved but very doable. Amongst others, I have accounts at IG Index for both stocks and spread betting. You can spread bet on the silver price with very close bid/offer spread. Also you bet on the $ price movment but X £’s per point so no FX to worry about. I’ve calculated that you need to bet approx £6.50 per point to hedge every £10,000 worth of silver so that is another option I have as well. You also have the added advantage of being able to trade the silver price pretty much 24/7 with IG which can be useful once the LSE closes and the ETF would no longer be trading. But ‘hopefully’ no hedges will be required!!!
Looks like you’ve got everything covered there then.. in case of emergency, break glass
‘Hopefully’ NO breaking glass needed!! Lol And see Alex’s latest post has jsut appeared. 🙂 Happy reading!!
i think a spike back is in order when the stop run is done.
distance of price from some MAs is now stretched to extremes
Would agree with that. Not very convincing but I have a trend line linking 11 Mar low and 24 Jul low which extends to around 1410 today. I’d hate to see it go below that and even more so, STAY below that TL!!
hit your trendline on the button… (and at $14.1281) maybe reversing now??
I…errrr..’hope’ so!!! Lol
nice job..
GDX crossing its VWAP.
LeChiffre…. what means VWAP ???
used by Instituational traders to buy or sell. Really important intraday. (works on 5 min or less only)
DEFINITION of ‘Volume Weighted Average Price – VWAP’ A trading benchmark used especially in pension plans. VWAP
is calculated by adding up the dollars traded for every transaction
(price multiplied by number of shares traded) and then dividing by the
total shares traded for the day.
THANKS LeChiffre !!!
You’re so welcome. You can plug it in stockcharts if you have it. or TOS (not all platform have it)
I used to use VWAP and even on daily chart , price often extends above or drops below, but it always returns to VWAP sooner or later.
Good explanation here Guert
https://www.youtube.com/watch?v=GoxkQRUyD5E
This helps Conrad !!
Many thanks.
My jacket has a parachute 🙂
what do you think about this chart guys? XLE at multi year support, breaking above on weekly… could be morning star on weekly. it goes well with oil bottoming
I think we are close
As much as I want to jump in Energy with a daily swing buy …… USO just filled the gap from last Friday so …… I am hesitating here, I need more I want more more proof just more! 🙂
I also want more from oil.
I love all the dividends! 😉
Seeing the chat on oil I’m as keen as anyyone to try and get in somehwere near the lows. However, I’m just starting to see WTI breaking down again on my 1 hour chart after another typical bear rally to the 80 period ema. For my money this keeps it flat out bearish as I write and would have to consider oil a very short term short at this point if anything with a stop loss just below 40. 1 hour MACD rolling over again RSI back below 50. I can’t see anything remotely positive here yet as much as I would like to.
Looking at GDX or GDXJ and using the GOLD cycle count, you can easily see how today could form a swing tomorrow with higher prices, but it also could just be a bounce & drop again like it did in November.
Some miners actually turning green at this point, and a few are Silver miners. ASM, EXK, AXU, AG, SSRI, SVLC – NG, TRQ- (But can it hold into the close?)
might not be the day
I dont really think it is. GOLD still has some work to do I.M.O.
guys… are you saying you still have something along these lines?? that we are currently in correction – which can go 13.01 – before reversing…but i have a sneaky suspicion it comes down to test that breakout of the triangle/ending diagonal)
.. https://www.tradingview.com/x/ckkUzOmg/
That does look like a bear flag on your chart. ( I’ll let Ken and the others answer your E.W. test of the triangle break out question, seems possible though).
Very plausible Maria………but if we get that low I think a stop run below 13.01 will be had.
I added a very small tad at the close today in case we gap up tomorrow morning if not I am going to wait for that stop run.
SOG and you have the right count imo working on 2 down……we were waiting for this 2nd wave down if I remember correctly……were Here. 🙂
oh good .. thx Ken! ive been a bit distracted of late w/ home&work .. been missssn this forum ;o)
and a GREEEEEEEN crazy day…
I/We were wondering where ya been at. 🙂 Hope all is well.
I work at a University…this is opening of school, convocation, welcome receptions, etc. verrry busy time..I am also getting my son ready/off to college at well..so lots of action going down in Marias lair … ;o)
ahhh I see.
Will you then become an Empty Nester ? Or is this your first born ? Yikes I should stop asking questions b4 I stick my foot in my mouth. 😉
my aren’t we the curious one … ;o)
giggle..yes.. empty nester……… woop … oops – did i just say that out loud? ;o)
Yea my wife always says I ask too many questions lol watta yea going to do? 🙂
It is a Woop ! It’s great ! It’s like getting your first car with all that new found freedom 🙂
he he … yes…I’ve been purposefully/methodically skimming profits & placing them in Maria’s Travel Jar (MTJ) … ;o) YOU HEAR THAT MINERS… get a load off .. MTJ awaits….;o)
LOL !!!
Have a good evening Maria.
Pop on in tomorrow when you can. 🙂
🙂 u2
I love that band….(huh) ?
🙂
Good night all!
( If you want to see anything semi-encouraging, the GDX 5 minute chart into the close was better than a flush out bottom 🙂
Stopped out of AUY in AM. Did not add to GDX Sep monthlies as planned, waiting for double bottom. Still own starter position in FSM but it is now well under water. No position in GLD. Waiting DCL confirmation (and hopefully some general market stability) before making any additional trades.
3 levels for the DCL
Breaking the trend line and heading to 1122
Morning thoughts pre-market: SPY double bottom at 1867? Short-term, I think could be A of A-B-C correction equiv to a primary wave 4.
SLV set to gap down, this should be a new bear market low for silver this morning. Does that invalidate the ICL (stop run always a high prob here)? Also notice dollar index lower than 24 Jul so on a $$ weighted basis silver is actually much lower. Gold now also dropping into DCL which GDX started next week. Alex let us know when you see that low, for now I plan on jumping in When I see ~13 hit. Grabbed DUST yest as hedge (ext. small position as DCL seems near).