
Are You Ready?
Are you ready to make a leap of faith? A buying opportunity is fast approaching in MINERS, whether it looks like they are crashing down or not. Let me show you what I am seeing.
In July I showed that I expected a drop in the USD to the lower support line. This would cause a rally in Gold.
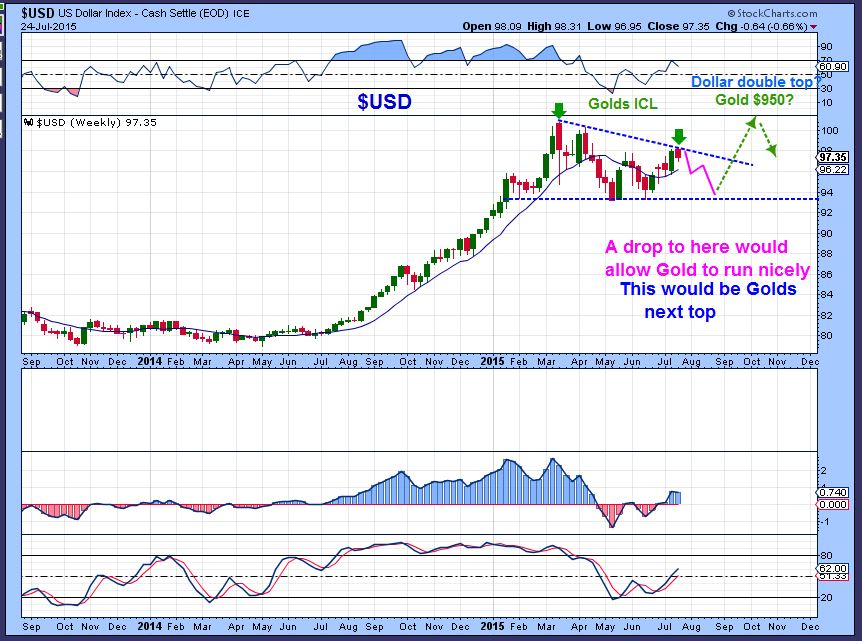
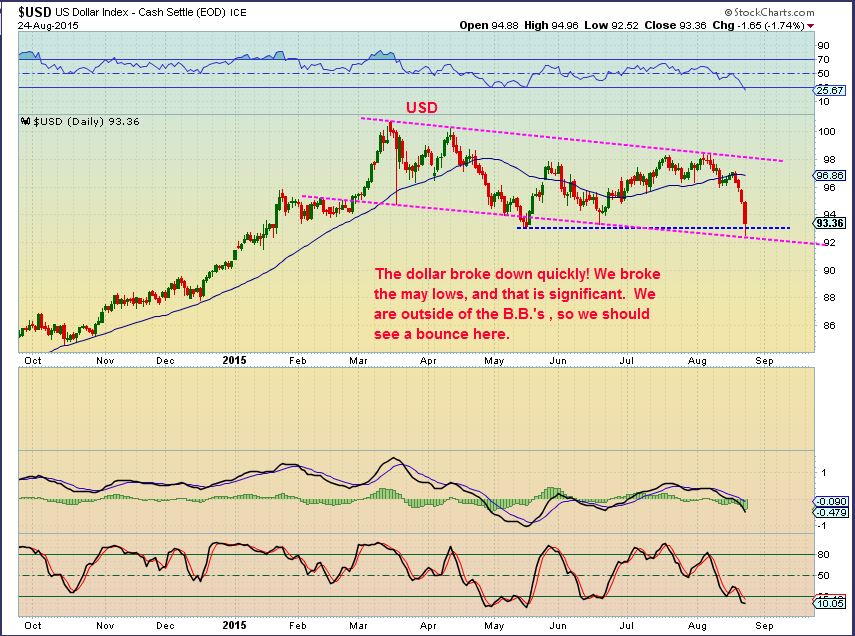
USD – We just had out drop in the Dollar as shown in this chart. Gold and Miners did put in a nice rally. Today the dollar is bouncing ( Up over 1.10 to 94.62) and Gold is pulling back.
I expect a second leg up in the precious metals to be greater than the first. Lets review …
GOLD, SILVER, MINERS
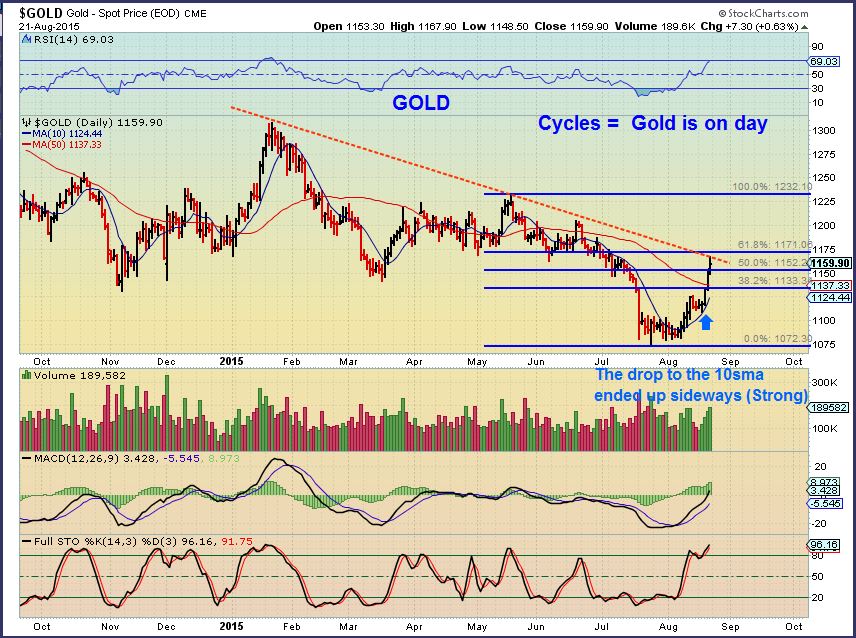
GOLD – Gold acted the way it should at this point. It rallied about $100 as the dollar dropped. Now the dollar is bouncing and we see Gold pulling back. This is normal activity
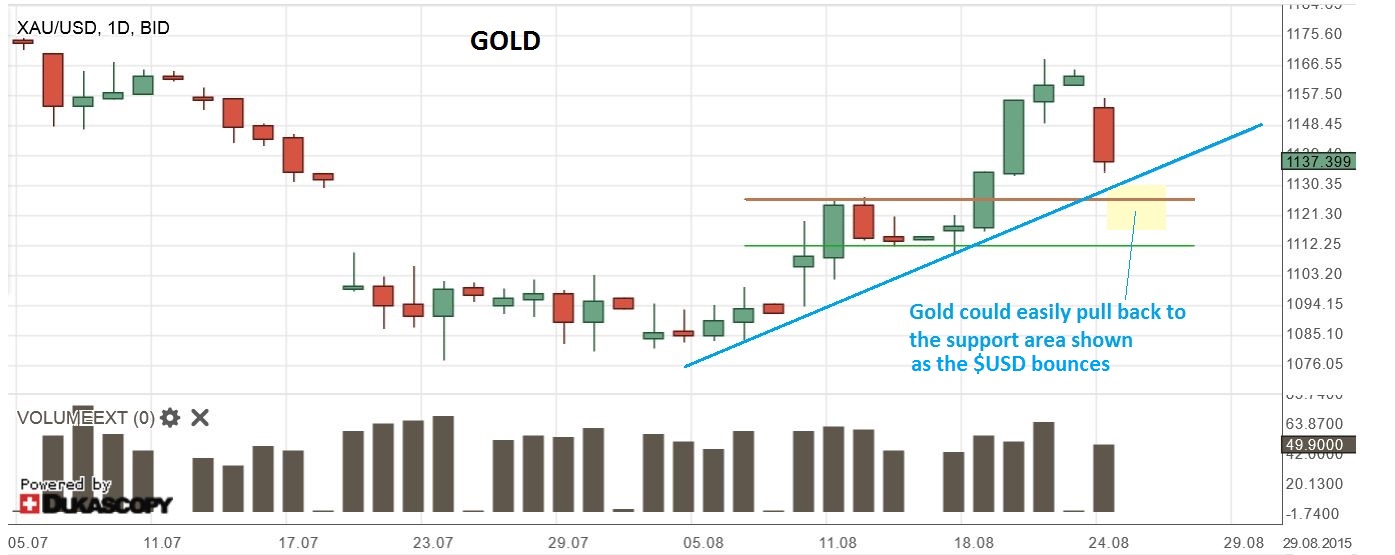
I expected this drop . Here are 2 reminder charts from the weekend premium report. Gold can simply drop to the $1130 area and find its support and form a Daily Cycle low (DCL) . It should then rise to new highs.
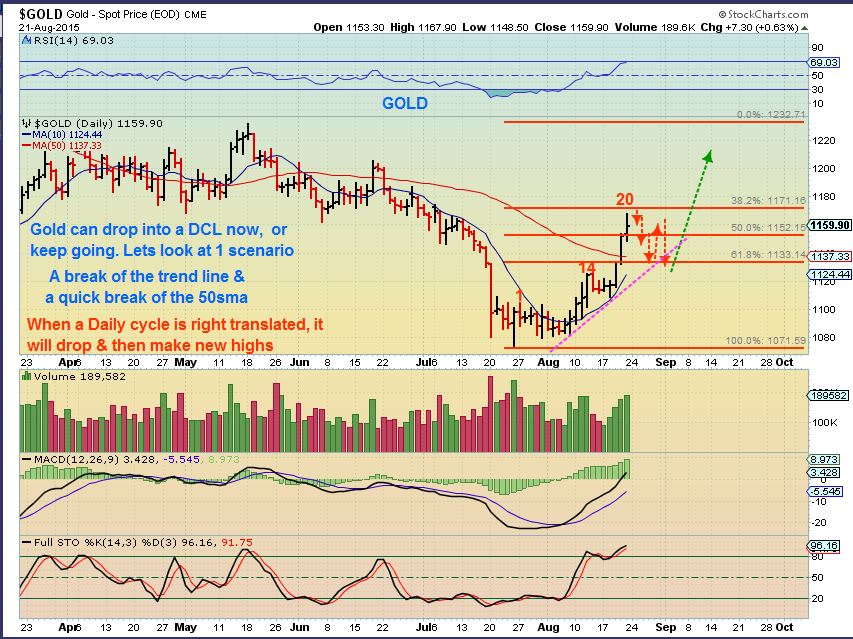
Gold was at resistance and the fib 61.8% number, so I understand why it didn’t just burst higher Monday. Pullback to $1133 is very normal. See fib lines.
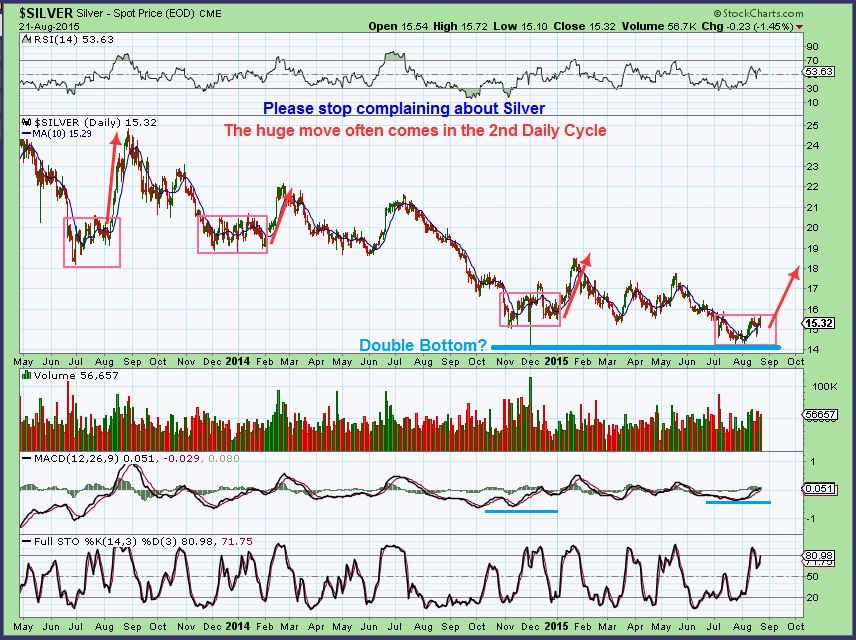
I used this silver chart this weekend to show how silver acts in the first daily cycle, not always participating in GOLDs initial rally until the 2nd leg higher. Then it explodes! Are you ready?
.
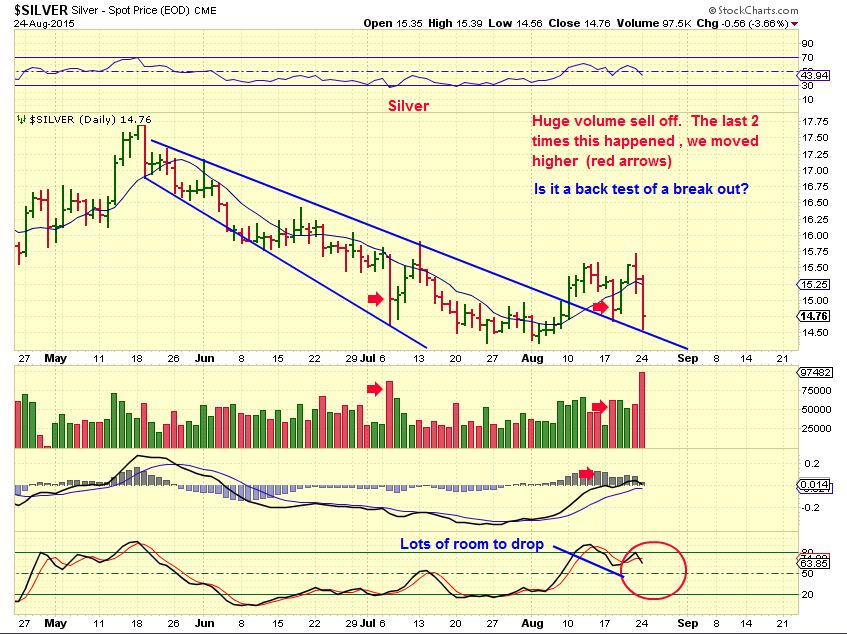
Silver got dropped Monday. Silver looks horrible at the lows in every case in the chart above, right? Monday was high volume and looks ugly too . I confess that when I draw this chart, it is with a bit of bullish Bias, just knowing how it acts near lows. Silver can still go lower along that blue trend line.
EVERYONE IS TALKING ABOUT THE MINERS. Disappointing? YES! We bought the strong run off of the lows. The dollar crashed and with Gold at highs and our Miners took a nose dive? I didnt sell the top, just in case the pull back was more of a sideways move. I have sold some since then, but I am looking to re-enter very soon.
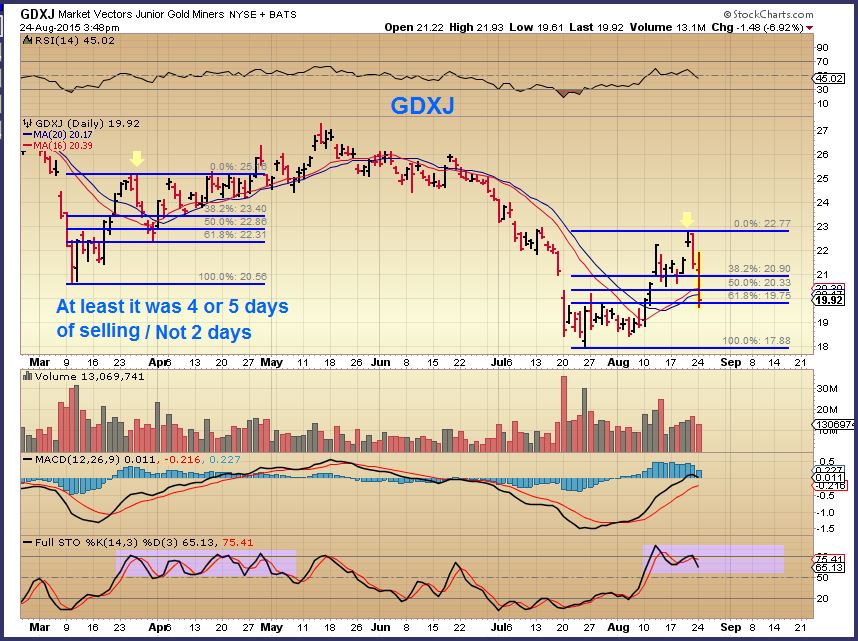
GDXJ Monday – We dropped fast , but it looks similar to the March drop. From the lows to the highs, we then fell 61.8% (yellow arrows). As Gold pulls back, I dont expect the lows in GDX / GDXJ to be broken, but if they are, it is likely just a stop run.
Now I want to show you 3 charts of GDX lows ( ICL) where price went up and dropped sharply like we see now. At least it helps to see how things played out then.
GDX 2008 – THE Bear Mkt Lows of October. Notice how price dipped back down to the bottom in Nov. Is that what we are seeing now in GDX, before the next move higher?

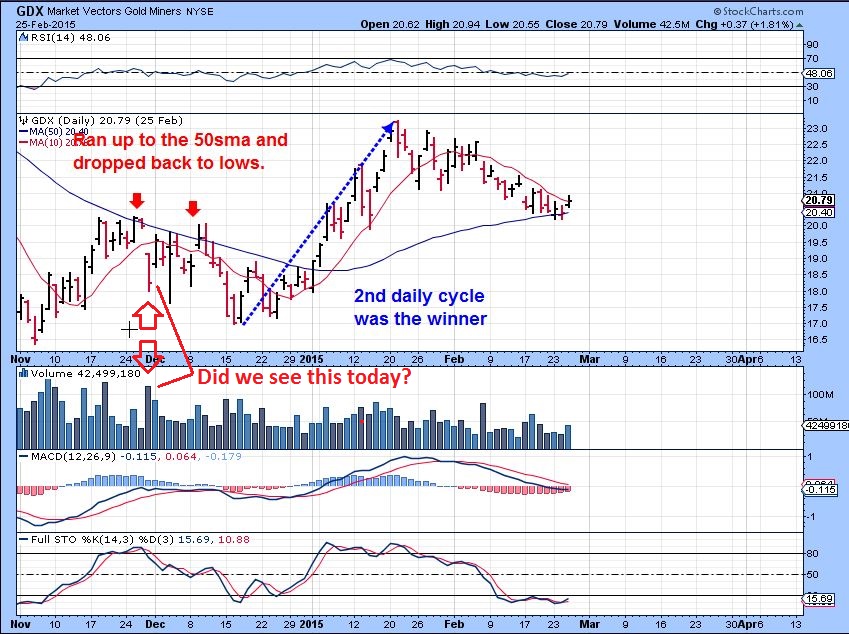
GDX Nov 2014 – Who can forget this dip back to the lows? Frustrating! Notice the High Volume plunge that came out of nowhere ( 1st red arrow). It then bounced higher, and dropped back down again. THAT could be what we are seeing now too, right before a strong 2nd move higher.
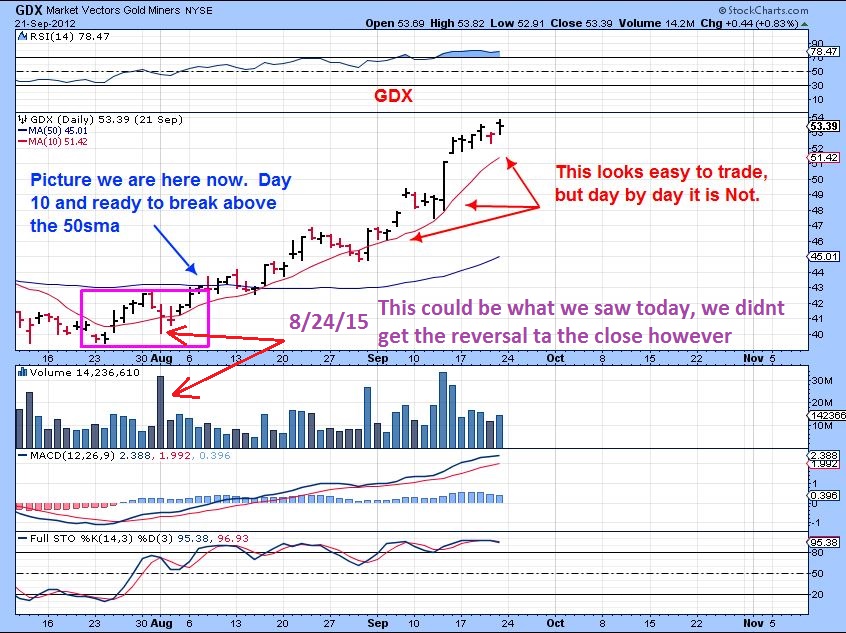
July 2012- GDX went sideways along the bottom like GDX just did. It also popped higher to the 50sma and quickly dropped right back down. See the high volume drop like we had Monday (red arrows) . The chart should say that we didn’t get the reversal at the close. ( Typo)
Let me show you 2 more important charts.
The purpose of this is to point out that at the Nov Lows and even the March Lows, some Miners that make up a big part of GDX bottomed, rallied , and gave it all up just like we see now. THEN when everyone gave up, they rocketed higher. The 2nd daily cycle can be very profitable.
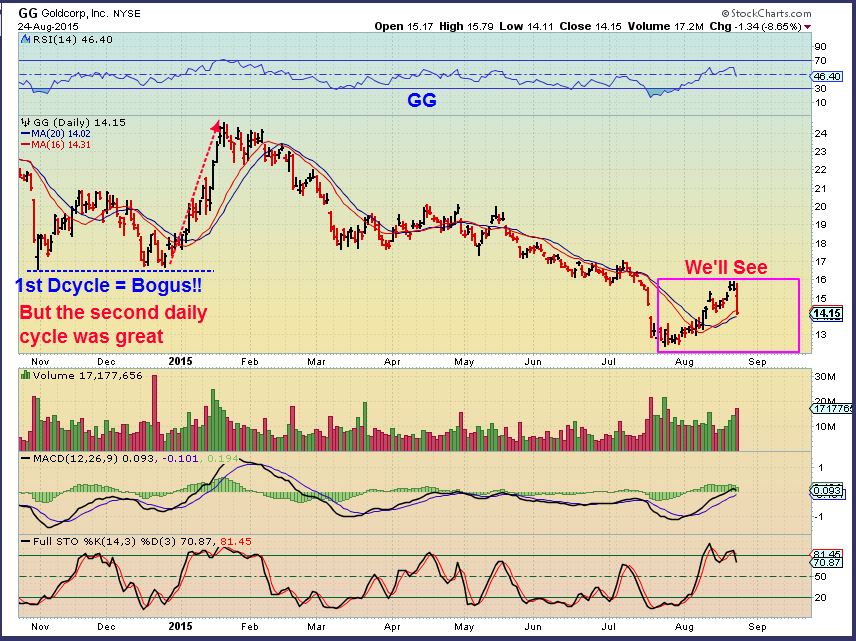
GG – Last November – December. BOGUS 1st daily cycle! GG rallied and then gave it all up. Notice that the next run higher was great.
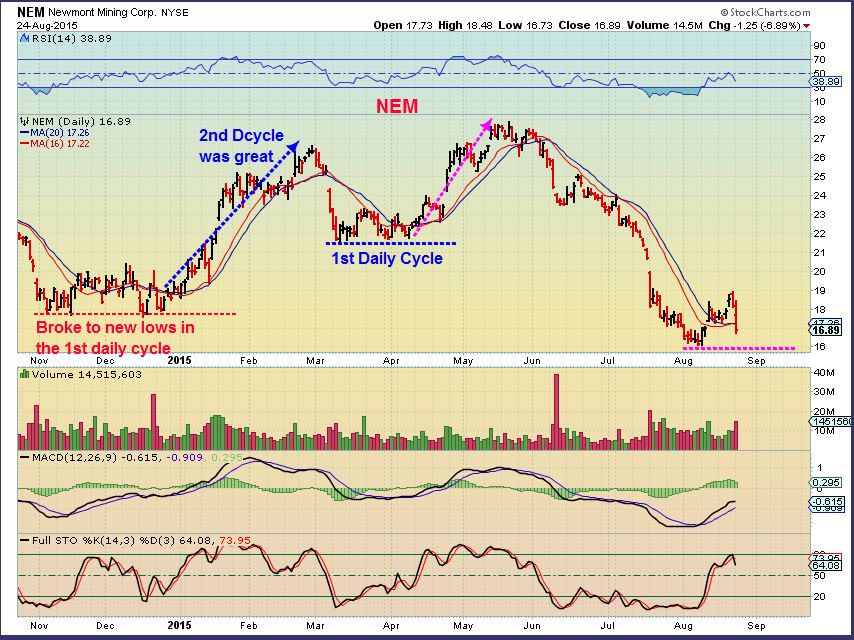
NEM – It also Rallied in Nov. and then dropped all the way back in december (It even broke them). Next NEM rocketed higher in Dec-Feb. At the March lows, NEM also lingered 1 month at the lows, then Rocketed higher! I expect that again.
SO I wanted to highlight the reason for Hope here with our Miners. The second daily cycle is coming and in the past it was a great time to make great %-Gains with the miners. We can make good money when its a little clearer that these miners have finally bottomed on their pullback. Here at Chartfreak, I’ve been monitoring this closely in the premium reports. For a small monthly price, you can join us . If not, I will still be posting here from time to time with public updates. You can sign up for free email alerts, so you will know when I do.
Best wishes and thanks for being here. 🙂


thx for your analysis. I believe today’s gold, miner, and silver price action are close to finish wave II pull back, metal final low should happen in 2016.
Its very possible that after briefly rallying here, Gold sentiment gets better and then a final drop to bear market lows occur in that time frame. Thanks David
gdx test new low, but gdxj and hui is not yet. Gold shows relative strong. next few days will be critical for gold’s price direction. hopefully it is last drop, and then gold price show new up move.
Its day 2 of the USD rally, why would gold stop here and reverse higher?
Hi Bill,
I dont remember saying that Gold would stop here & reverse higher in the report, but that it might find support in the areas shown. My first Gold chart shows support lower. My second Gold chart shows it chopping around lower.
Also the USD & Gold do not always correlate day to day moves. I expect the dollar to ‘bounce’ for maybe a week, but Gold can drop, go sideways, bounce around near the 50 sma while that happens. I dont believe that the dollar has to go straight up day after day , or that Gold has to drop straight down day after day.
Thanks for helping me to clarify that for other readers.
I thought you were looking for a 38.2% retrace down to 1133. We are at 1138 right now.
Oh, I see
Yes, thats possible and the 50sma is at $1136, but also another step lower (50%) is a support area from the run higher with more support.
Refresh to see the chart that I attached here
Lets hope the miners don’t go down much when/if gold goes to 1106. If they do, I’ll buy more to dollar cost average.
I am hoping (hoping…that never works by the way ) that Gold goes to the 50% area $1120 max.
And Miners will do more of a sideways chop , rather than a stop run at the lows.