
Leaders And Laggers
I believe that today the Beige book is released and Janet Yellen speaks. Will that change current conditions in the market? We’ll see, but right now in a sector that sold off to new lows, we are seeing leaders emerge. We’ll discuss that after a brief review of the markets.
.
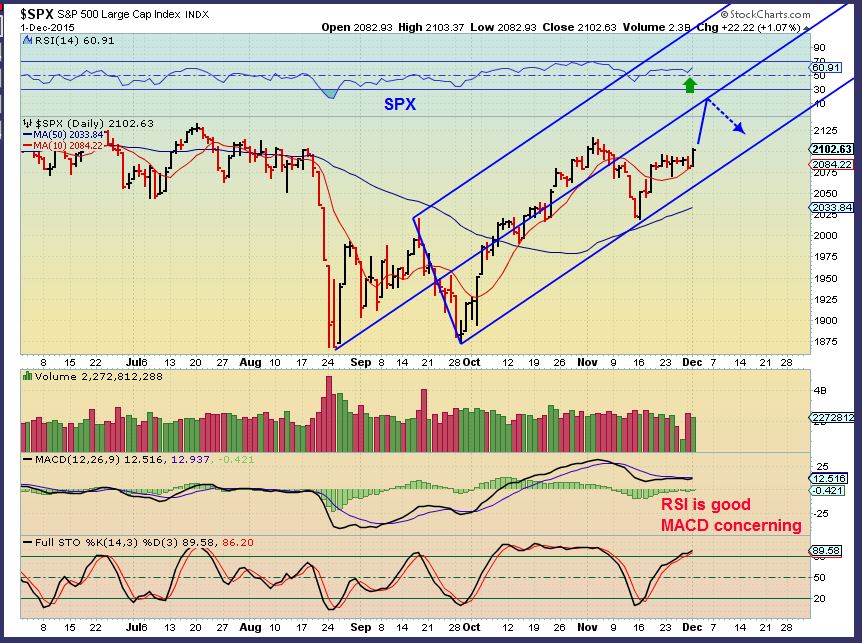
SPX – I’m noticing a weak MACD ,but the RSI looks good. I still think that the markets can break to new highs, but being the 3rd daily cycle I also think that the upside may be capped a bit for now. Notice how the 10sma held the decline.
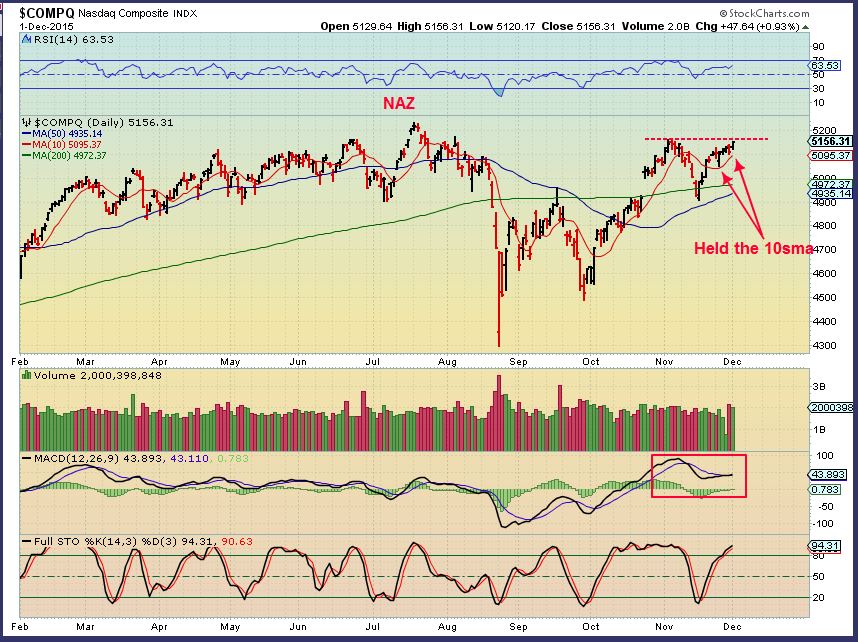
The NASDAQ also held the 10sma, is ushing for new highs, but is losing momentum too.
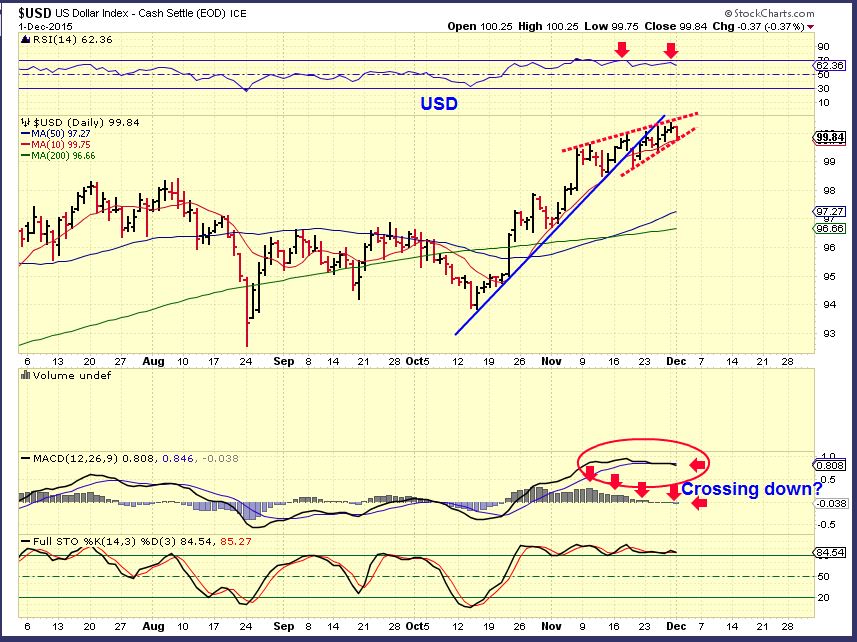
Pre-market, the dollar is rising to over 100 again. So far it does look like the pullback that I am expecting will still be happening. A drop here will be helpful for Precious Metals. Yellen speaks at 12:45 Eatern time today. Her words can cause a break out or a break down.
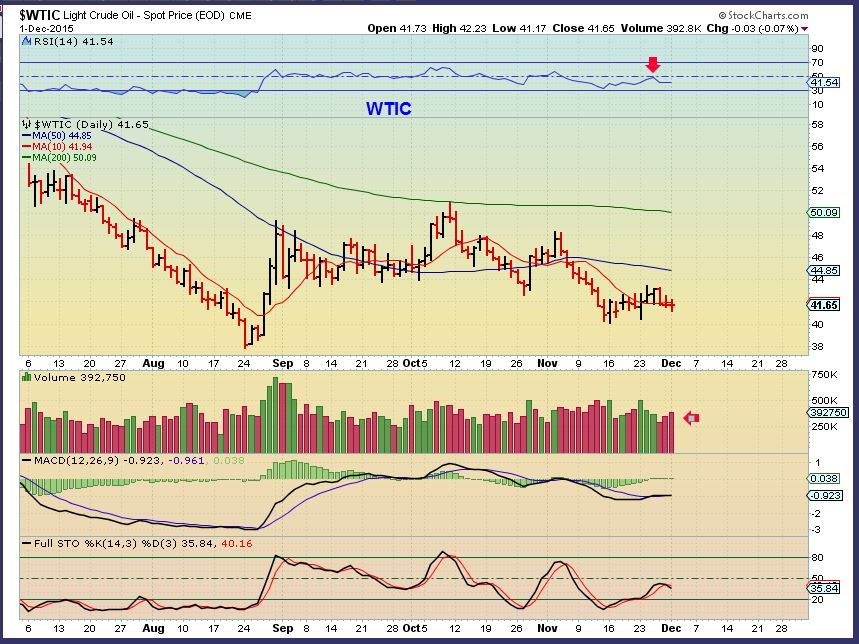
WTIC – Much of the same. Bounce / drop, bounce / drop , bounce / drop.
GOLD SILVER & MINERS
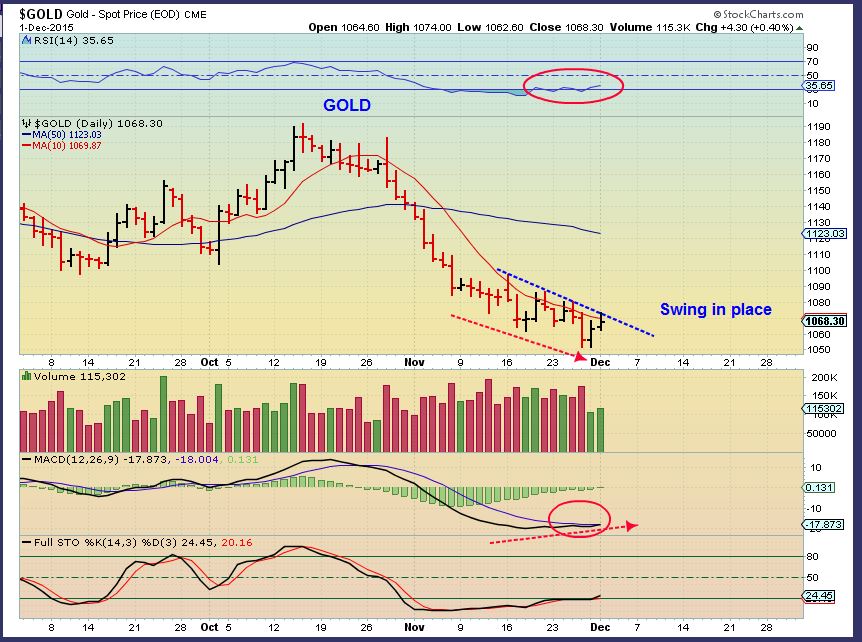
GOLD – The Gold chart is improving in areas and is also very late in the daily cycle. $1051.60 are the lows currently. The COT is quite bullish, and a swing low is likely in place as of yesterday, but needs confirmation. That starts with a close above the 10sma. Miners are the leaders in this sector. Gold is selling off pre-market.
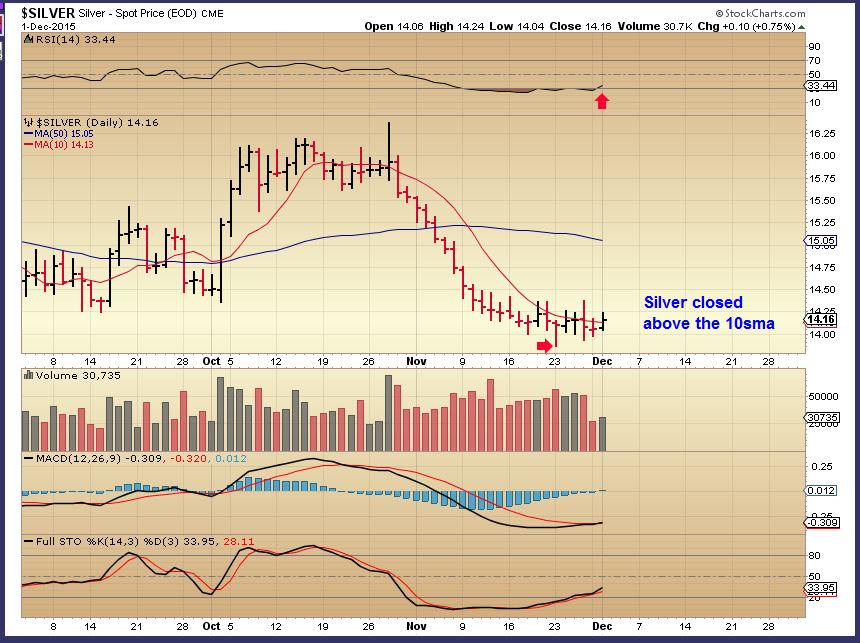
SILVER – Bottoming? MACD slowly crossing upward. Silver is selling off Pre-Market, back below the 10sma.
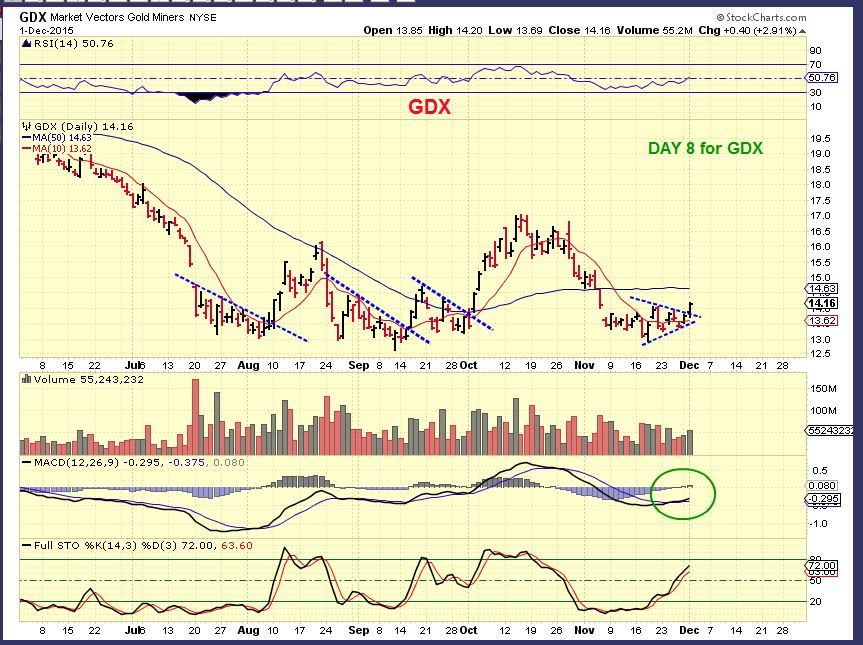
GDX – The Miners showed follow through higher after closing above the 10sma, despite Golds lackluster activity. They took the lead and they are on day 8. GDX never broke below the Sept 11 lows. I want to point out something semi-bullish that in past experience has caught my eye, not only in this sector, but in many stocks.
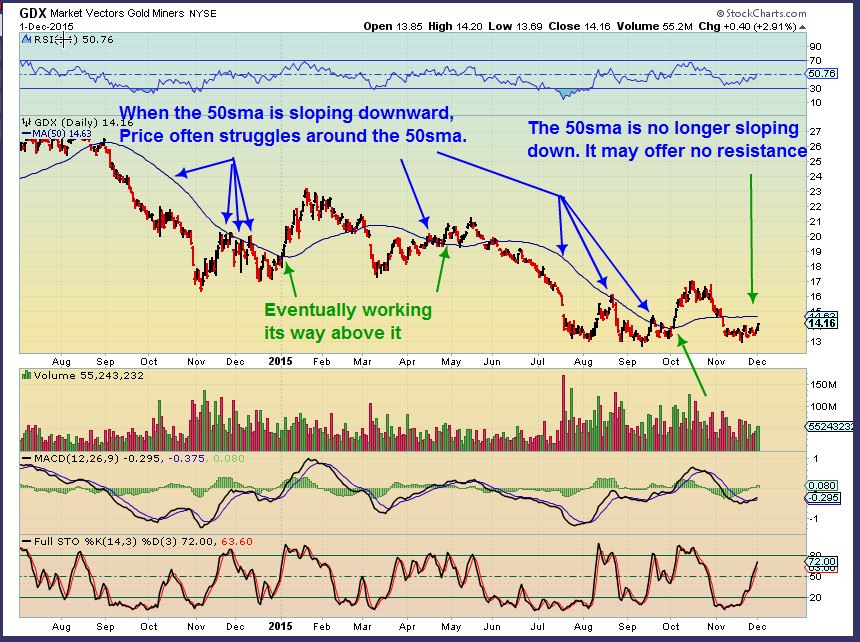
Look at this chart of GDX . In the past in GDX and with many different stocks, I have noticed that after selling off, the 50sma sloping downward can act as resistance. A sideways chop eventually allows price to break through and run in a 2nd daily cycle. The recent price action in GDX has kept the 50sma from sloping downward – so it might not offer resistance at this time. If we are at an ICL, we may break the 50sma in the first daily cycle and become right translated. That could mean that GDX may run very well.
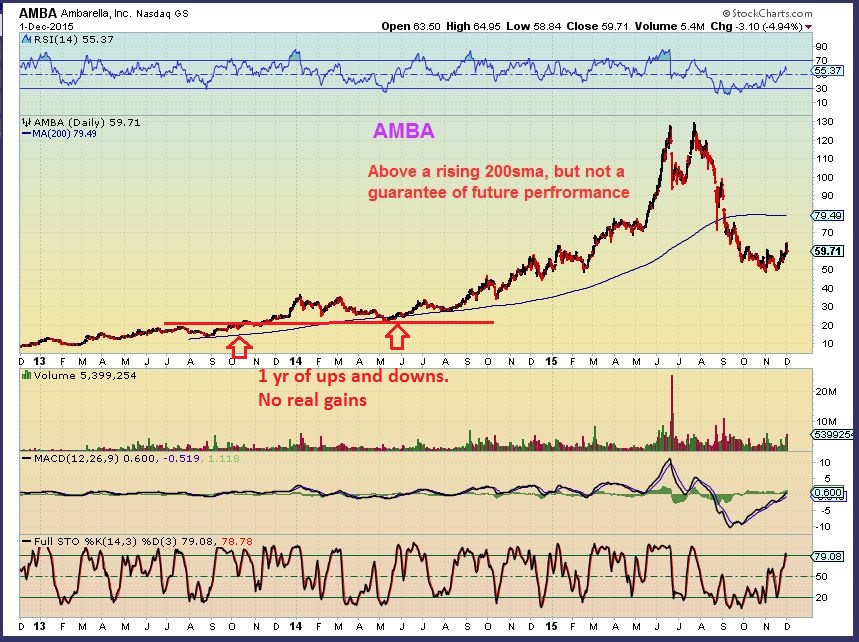
Let me show you an example of that in the middle of a bullish run in AMBA. The downward sloping 50sma offers resistance.When it was flattening, it was overtaken and became support as it sloped upward. That is in a bullish run.
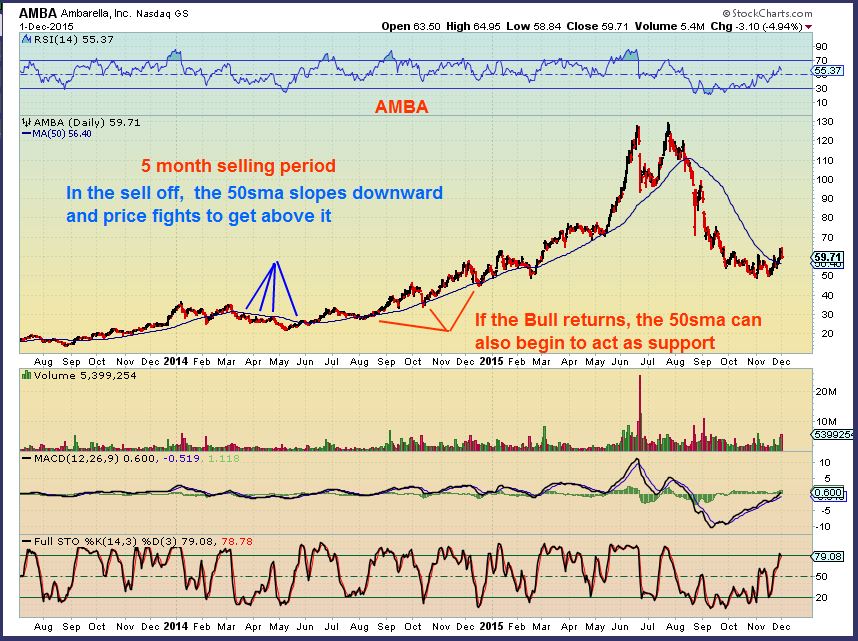
I am NOT saying that this automatically starts the bull market in miners again, GDX can break above, run higher and fail later. It has done this before. I am pointing out that this is how bull markets can re-emerge however. SO I will be watching price action as it approaches the 50sma and if it gets above, will it act as support on the way back? With higher lows in GDX since Sept 11 (and several miners have higher lows), you MIGHT be seeing the start of an uptrend. ‘Might’, ‘Maybe’ , ‘Possibly’ …lets not get too excited. 🙂
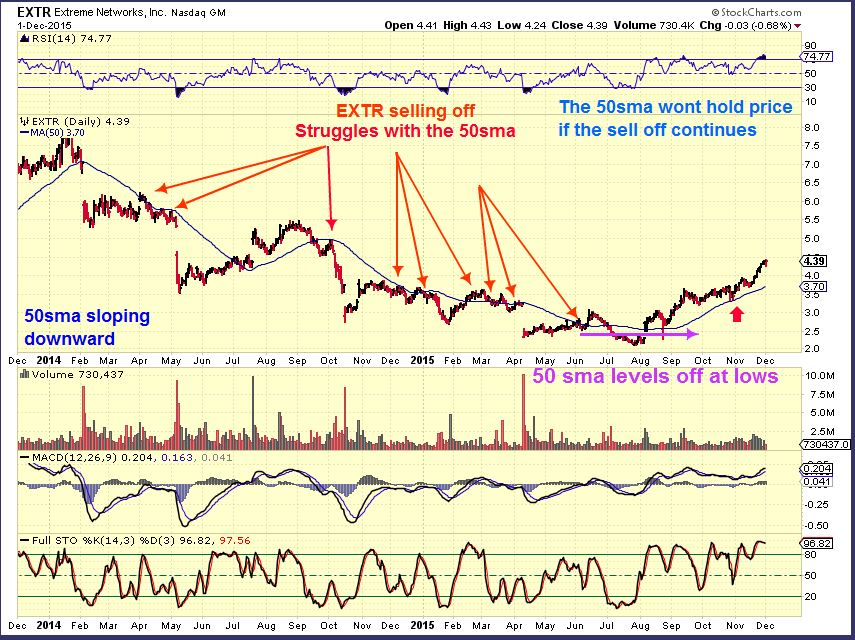
EXTR – This sell off saw the 50sma sloping downward as resistance too. Brief breaks above failed. Price struggled around the 50sma, and the sell off continued. Then notice that as price sold off June through August, the 50sma flattened at the lows and is now rising and acting as support. The sell off started an uptrend now.
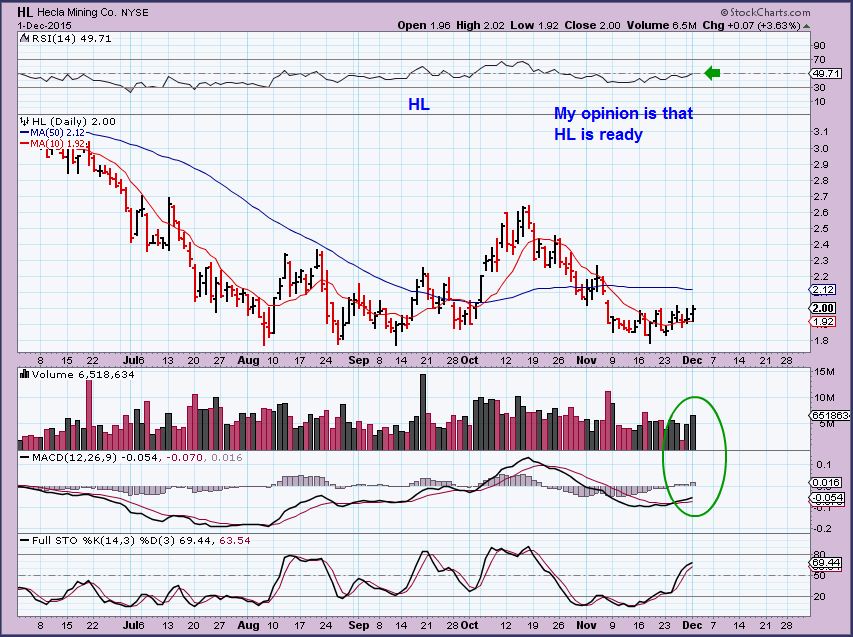
HL – With a rather steep sell off October & November, the 50sma is leveling off. I’ll be watching for resistance or break through. Has this sideways move at the lows built steam for a break through and run?
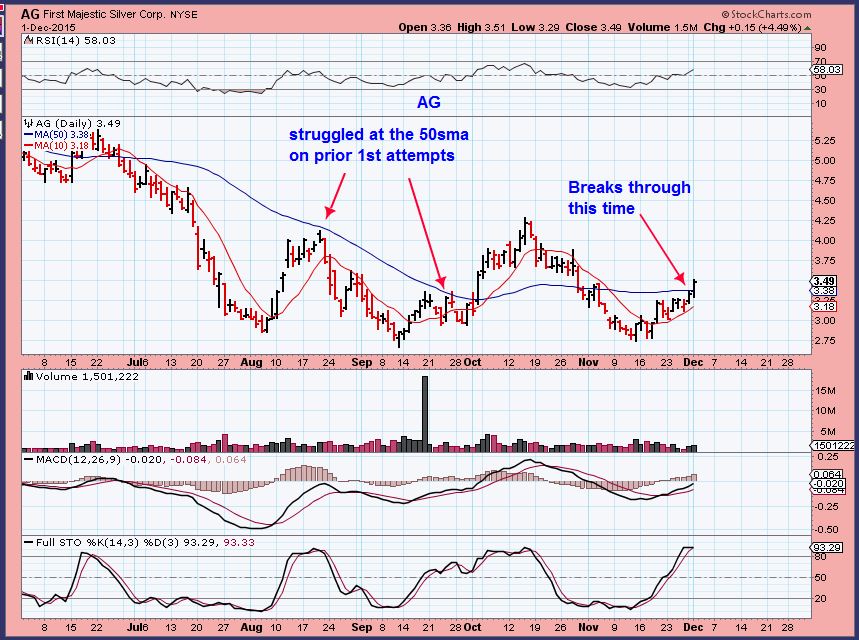
AG – Struggled at the 50sma as it sloped downward this summer, but just broke through the level 50sma easily. volume wasnt even that big and it sliced right through it. Let see if it has follow through. ( Gold & Silver are currently down).
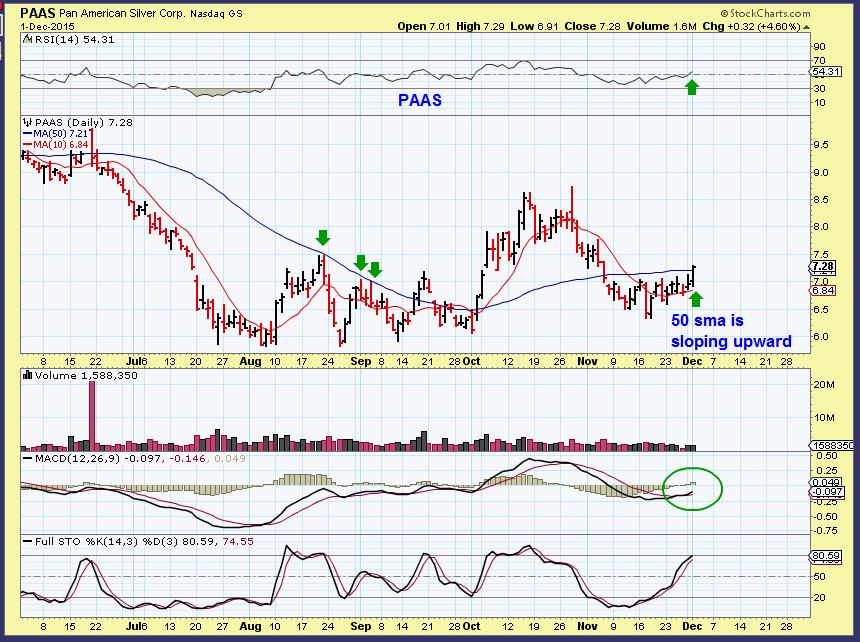
PAAS – struggled at the 50sma as it sloped downward this summer. The 50sma flattens out and is now rising.
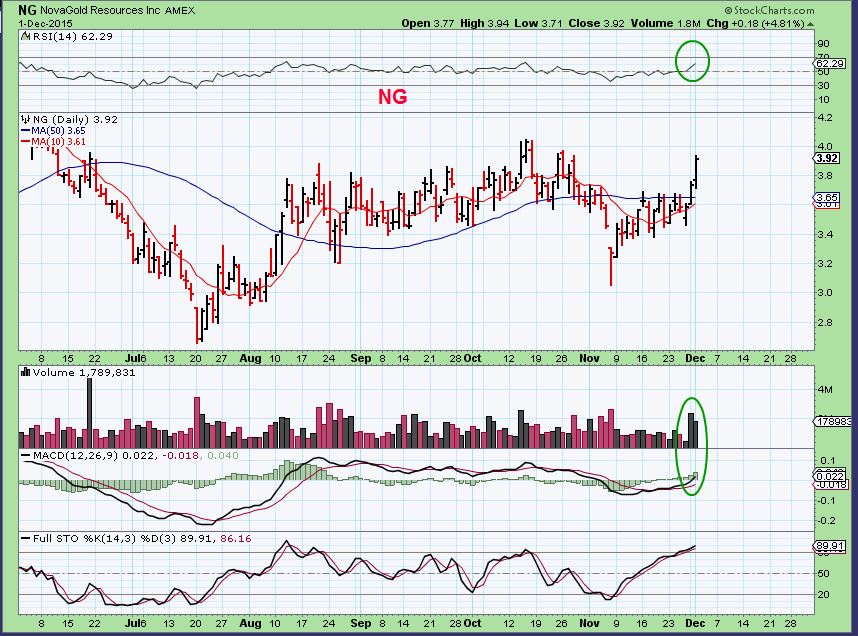
NG – Nova gold lost its 50sma briefly, but regained it right after Gold broke to new lows last Friday.
SO basically I just wanted to show a couple of interesting and slightly bullish developments in Miners, without getting overly bullish.
1. GDX held the Sept 11 lows. Higher lows.
2. The 50sma is flattening out and this MIGHT cause it to offer less resistance on a move higher.
3. Gold broke to new lows and Miners held up as though they were being accumulated. The COT for Gold is strongly bullish, so upside seems more likely than further break down. Ig Gold breaks down after Fed Yellen speaks, I tend to think it will be a quick flash sell off and recovery.
Today the FED Speaks, so anything can happen. She can stall further progress, or she may ignite the fuse. I have been accumulating Miners at these lows.
I am going to release this report at 8:15a.m. Eastern for the sake of time, but I want to add to it after that. Please check back later for additional information and charts. I will post in the comments section below when I am finished. Thanks!
~ALEX
I am adding some charts here for the sake of a comment make recently. It was mentioned that for some, it is desirable to buy Stocks above a rising 200sma, because they’re proven bullish. We will feature some here. Yes, these obviously have been performing well for a longer time, but the misconception is that they just go straight up all of the time. Also are they really easy to just buy & hold? NO. Their bases can last a year or more sideways too (just like Energy stocks and some miners are doing now). At times you will buy & hold for a yr and break even or even lose. With that in mind…
First I will show the chart that points out that these stocks are not infallible, they can fail too. I say this to help the reader understand that Trading is always a matter of using stops. Nothing is a guarantee.
.
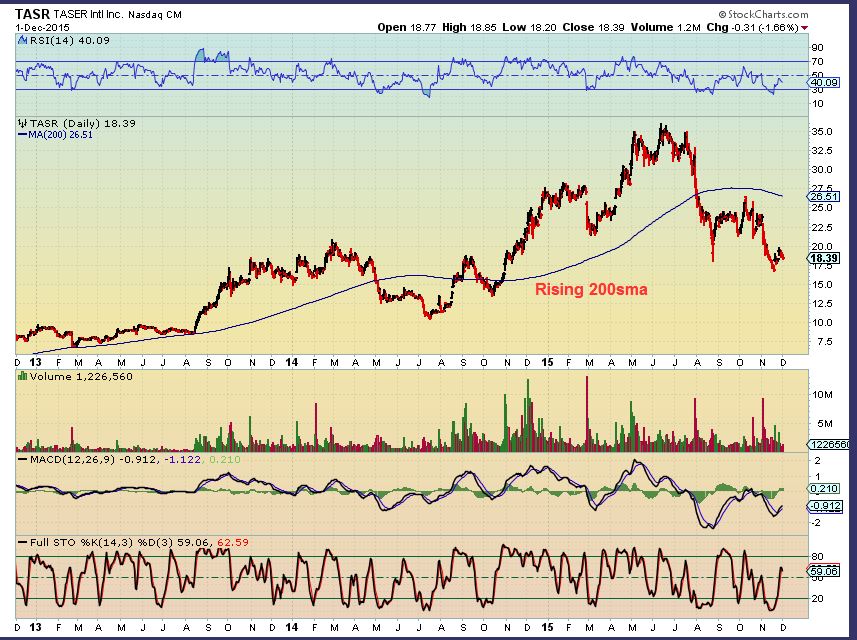
NOTE: TASR, AMBA, YOKU, YELP, QIHU, EXTR , and more (even AAPL) were all above a rising 200sma, well loved stocks, but failed in time. Certainly not a guarantee of future performance or a smooth ride.
Notice TASR – Above the rising 200sma. Was this an easy ride? No, but great gains over 2 yrs of buy & hold from $8 to $35.
AMBA – $20 to $130 if you bought it in 2013 …great gains. Please note that 2013 to 2014 the 1 yr gains were minimal and the stock went up & down a lot ( Like energy now?). There were $10 drops all along the way up at the end of 2014, until it went parabolic. Tough to hold in real time. You can now watch to see if it re-gains the 200sma.
SO lets look at healthy stocks above the 200sma.
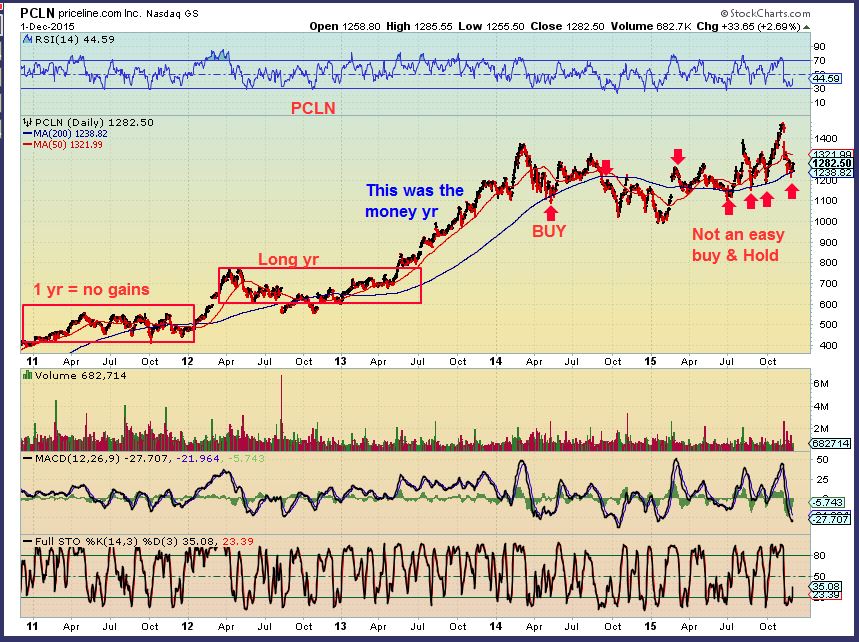
PCLN – Not an easy BUY & Hold. Why? long bases need patience. The price has tripled in 5 yrs, but most of the money was made in 2013. Some years were no gain at all. The last 2 years were no gain, but it sits above the rising 200sma now.
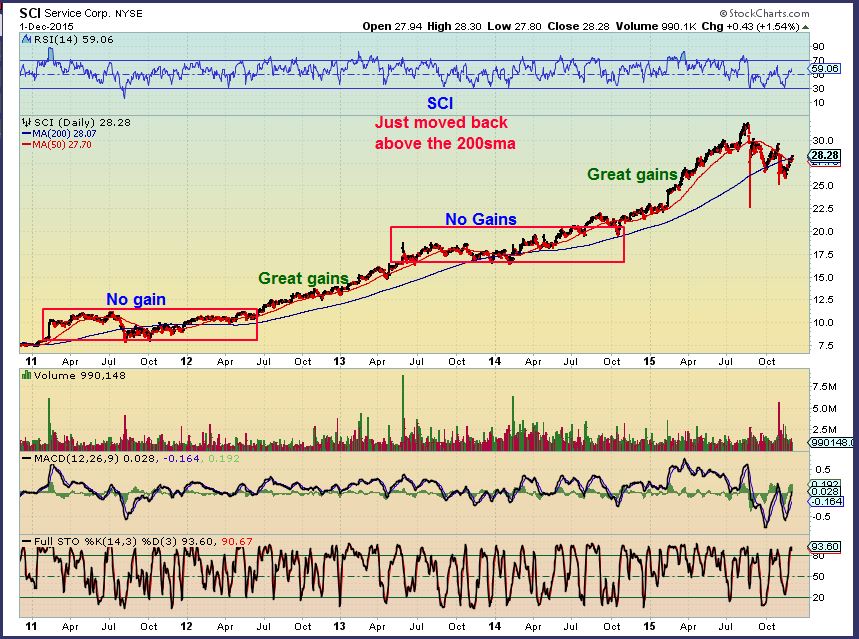
SCI – Great gains. This just re-gained the 200sma, so could be a long term buy & hold. Note: Great gains at times, but will it base for a yr or move higher now? Tough to say. It is above the 200sma and is trending higher, but bases can be brutal.
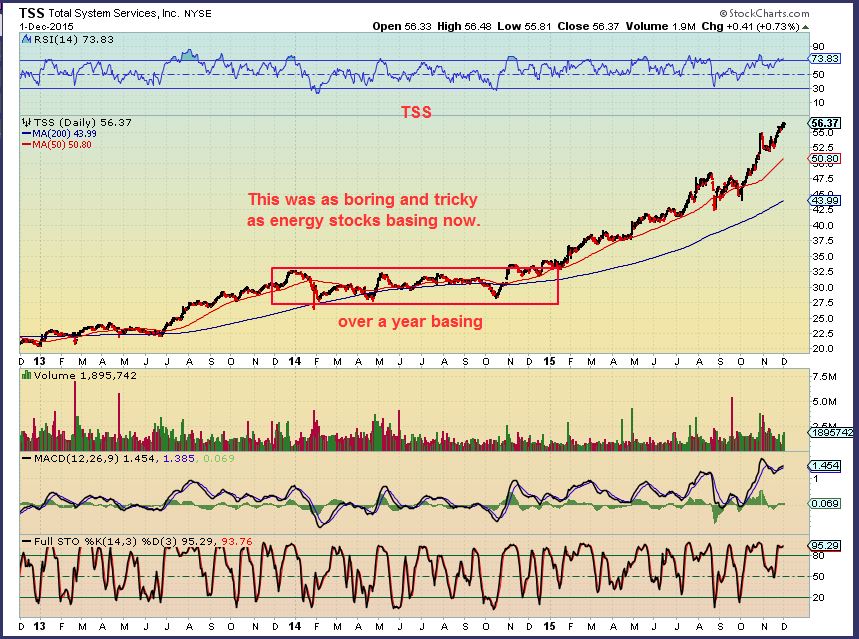
TSS – Looks great, $35 to $55 in a year and may be turning parabolic. Wait for a pullback to the 50sma. Please note that buying it in early 2014 above a rising 200sma – you made no money for a year and withstood big drops as it based out. That base looks the same as energy stocks now.
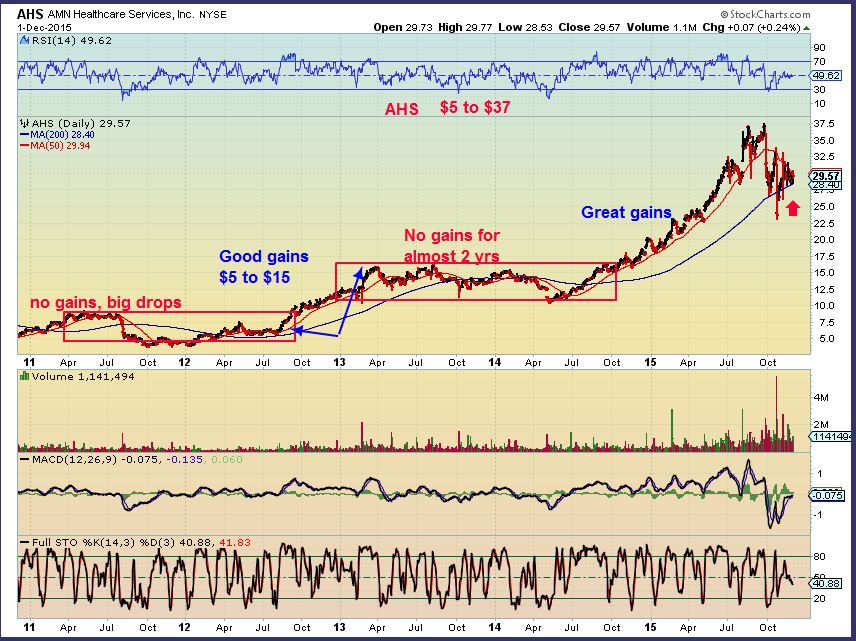
AHS – So its back to the 200sma, this would be a buy & Hold above a rising 200sma – but will it take off higher or base out for a yr?
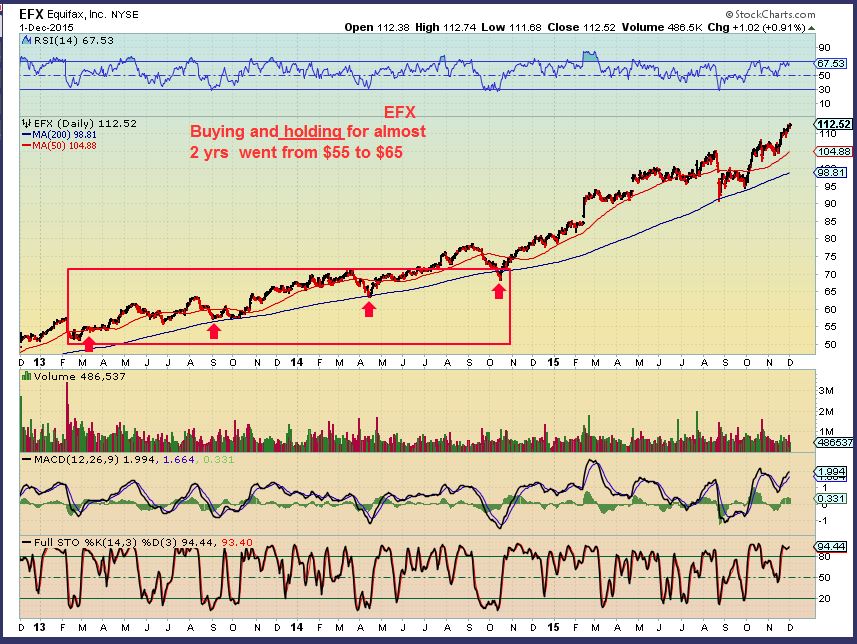
EFX – Looks great and doubled in 2 or 3 yrs. Buy and Hold still wasnt easy with those swings, but its in an uptrend above the rising 200sma. Was this any easier to hold 2013 to early 2015 than the energy stocks recently? No. Buying this break out in JAN 2015 was good – you are up 40%. ( However you can do that in Miners in 2 weeks ) 🙂
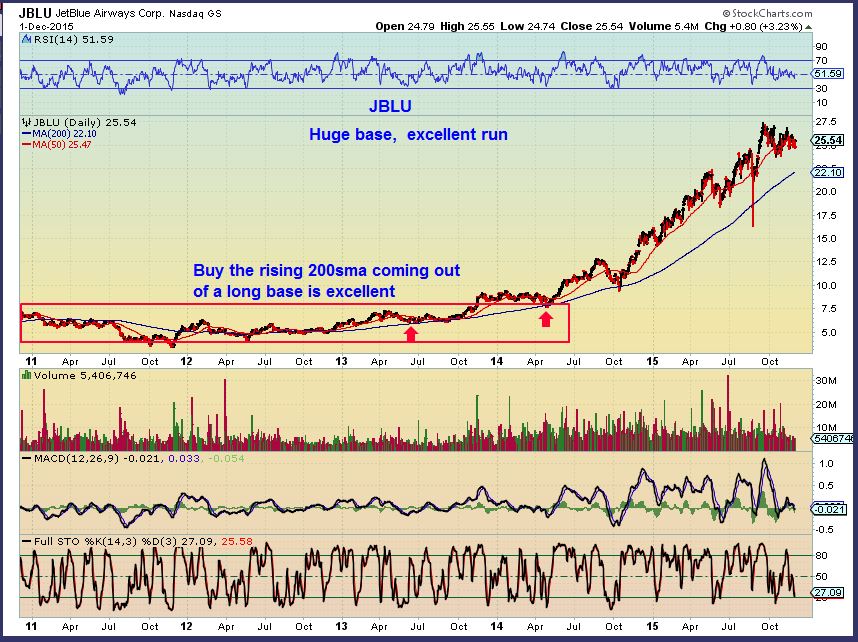
JBLU – ( See also DAL – above the rising 200sma and sitting above it in a base now). JBLU is a possible bull flag now. A Buyer didnt make much money from 2012 (Rising 200sma) to early 2014 & 5 to $7 in yrs, but really took off Oct 2014 to Oct 2015. Over 100% .
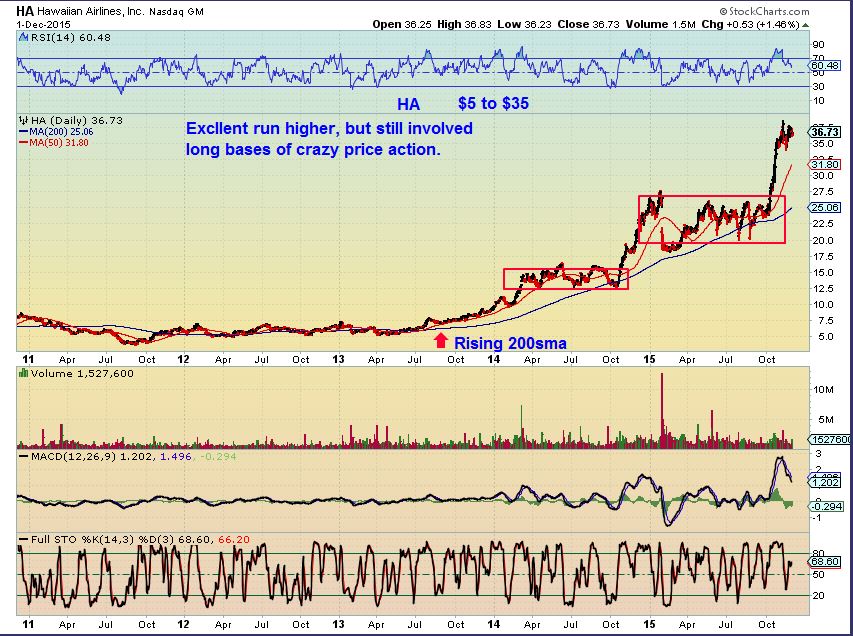
HA — Excellent run, but also tough to hold depending on where you enter. $5 to $35 . Great run, very extended here though. Look for a pullback. See also DAL.
So when you look at a stock with a rising 200sma , you see great gains over 5 yrs and say “Why didnt I buy that!” Really stop and look at those stocks. Could you have bought and held? Some dips are $10 to $20 dips. If you own 1000 shares, thats a $20,000 dip. Some time periods are a year long base action. That is fine if you buy it, hold it, and ignore it. What if you watch it daily? Owning a stock bouncing from $15 to $18 and back repeatedly can be difficult too, even if it remains above a rising 200sma.
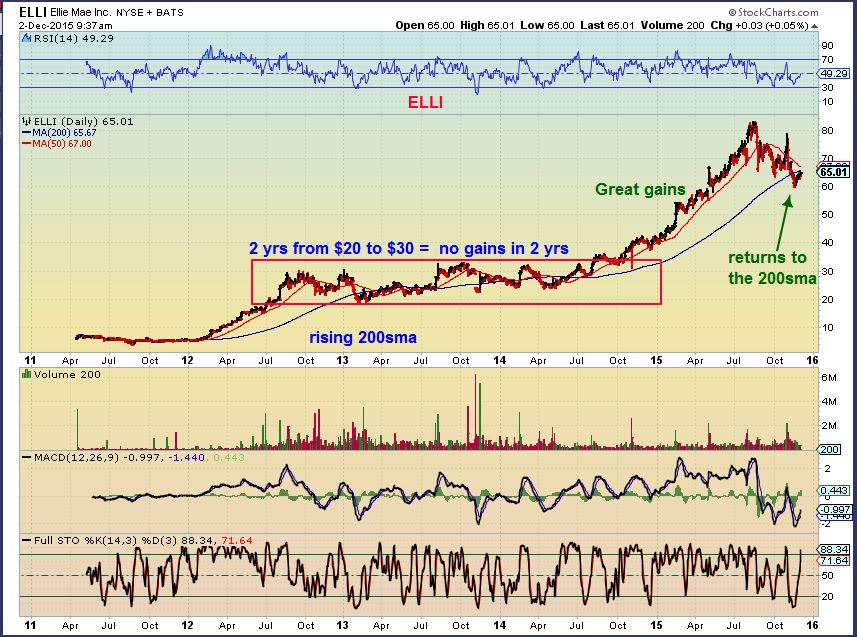
If that is your style of investing, the above stocks can be watched by you for favorable entries – as well as LION, PAYC, AVOL, PSA, PNK, ALK, TSS, REGN, and ELLI (below).


I hate those steep $12 sell offs in Gold.
Ditto
This will test the resilience of the miners . Presently AUY is impressive.
I added an additional set of charts and commentary to the end of this report. Refresh to see it.
Alex any thoughts on GDX ? Honestly I am confused..
Looks good doesnt it? Gold down $14 and it sits on the 10sma.
Look at the chart of GDX in my report ( I will repost it here) . That is a back test of the break above the blue line so far.
On the basis that c banks are running the show – this is a biiiig month.
ECB tomorrow, FED and in the middle OPEC. On verra.
Feels like it never ends, huh? Hard to get comfortable
And just as I type that
on twitter: “Iran says majority of members of OPEC agree on cutting output – BBG”. Oil spikes and comes back. We’ll see what actually is agreed
Oil Inventory report released…Build up higher than anticipated / OPEC not expected to make changes at this point,
It’s all about the $:€ and OPEC. On verra
The only question is if oil holds this summer lows ~ $37.75. Testing that is inevitable; will OPEC crash it right through?
SOLAR stocks are looking like interesting set ups here
SCTY, FSLR, SOL, YGE,
POT getting ugly. No position, just watching (falling knife or buying op?
Alex,
Is breaking the 50 sma on GDX the only way to make this DC RT ?
No – Its more about when the peak of the daily cycle came in. Left side of 1/2 way or right.
So if we got a 23 day cycle, you want to see day 12 or more as the peak.
If it was a 30 day cycle, you want day 15 or more as the peak day.
It basically guages strength and anticipation of what the next daily cycle would do.
Ok….thanks, whew…… I thought I was missing something. 🙂
Dumped my JFS.UN as planned, at the break of 200 dma (sma and ema are within a penny of each other).
I have about 15 more I’d like to eradicate, many of them in PM sector – major housekeeping to do come January.
Will try not to abuse the helpful nature of Alex and others, by lining them all up here; not more than one per week anyway:)
I posted a new post, but the email alert didnt fire .
The 200 day SMA piece may me sad. Tails, I lose. Heads, I lose.