
Did You Short The Gold Break Down?
In my weekend report I warned about a possible false break down in Gold. I received emails saying that many ‘shorted this sucker for the final flush down phase’. I repeat, Please use & honor your ‘stops’, I see things differently. I’ll explain after a market review.
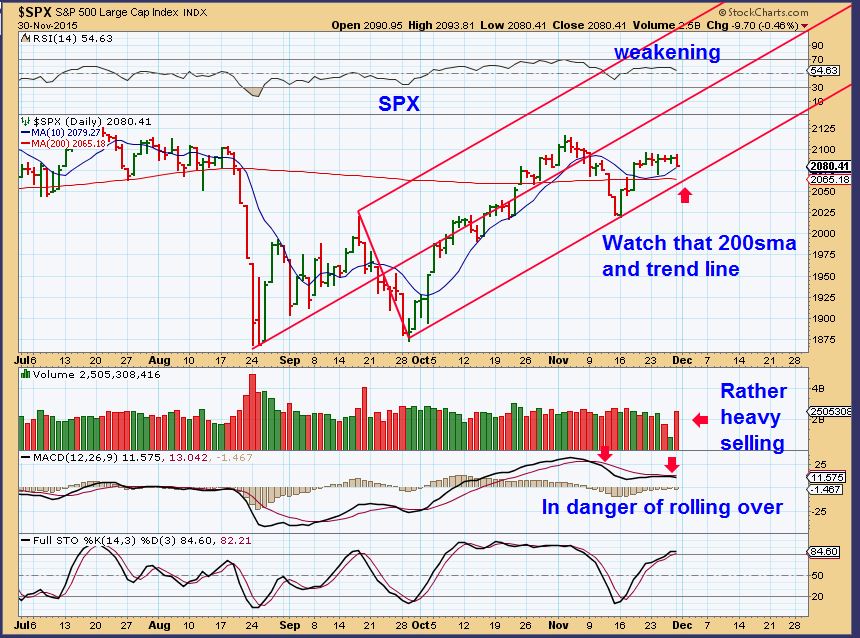
The SPX was looking bullish and I expected a break to higher price, but today there are areas that need to be noted and watched.
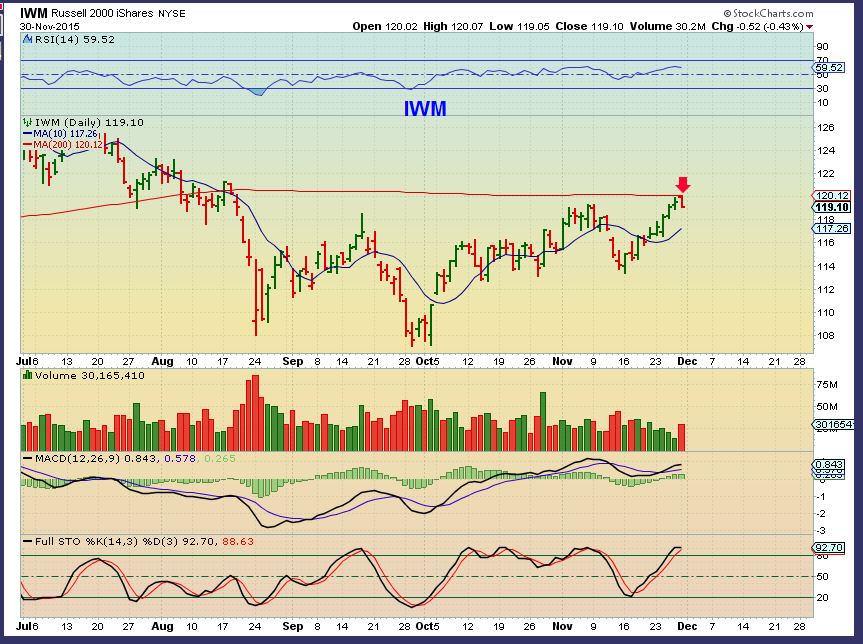
IWM – This also had a semi high volume rejection at the 200sma. That doesn’t mean that it is done, but we’ll watch to see if the 10sma or another area of support can hold it up.
Here is where it gets interesting…
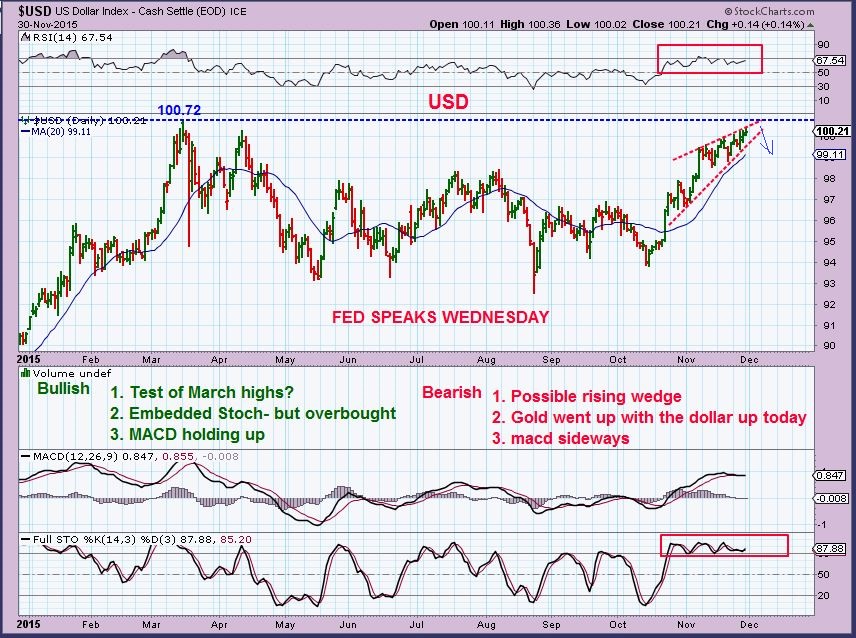
USD – I lean towards a drop coming , rather than a break out & rally at this point. The Dollar rose Monday and even though Gold broke to new lows Friday, Gold then recovered Monday with the USD higher? There is more to this story later.
Then we have OIL & ENERGY. Some Energy stocks are strong, OIL is meandering around weakly. I reported this in the wkend report as perplexing, and yet here is more of the same.
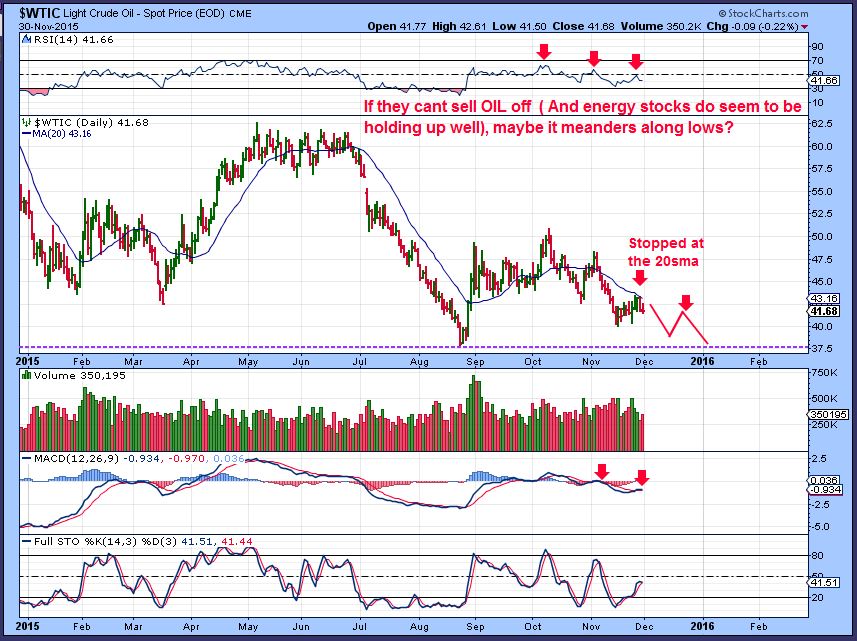
WTIC #1 – Rejected at the 20sma and weak today, but many Energy stocks look strong. I have been saying that OIL would be weak and has ‘failed’ and should move lower for 30,40+ days. On day 23 – can this thinking be reconciled with rather strong looking energy stocks?
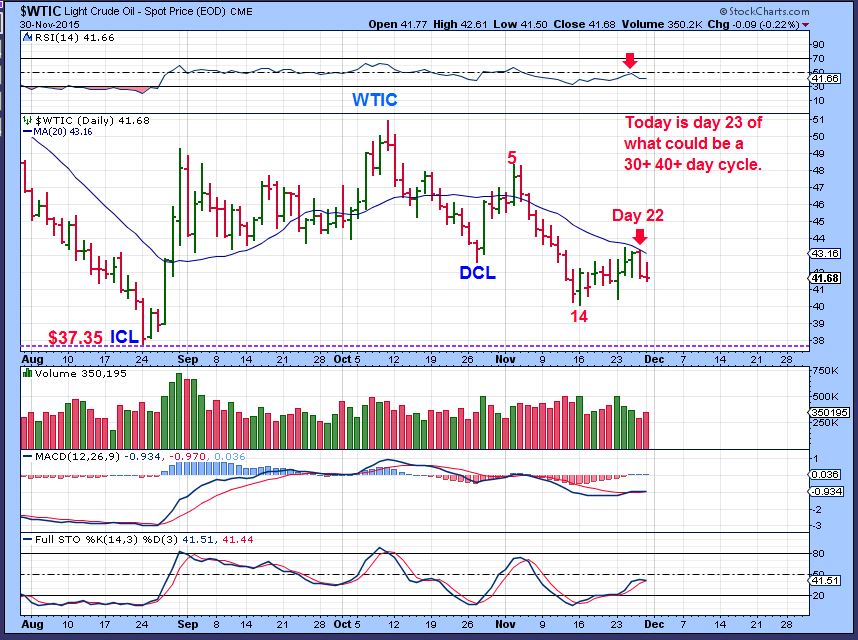
WTIC #2 – Maybe OIL doesn’t CRASH, it just remains weak ,while Energy stocks firm up in current bases? I showed this A-B-C-D, but I DID say that it was NOT confirmed yet. It still isn’t.
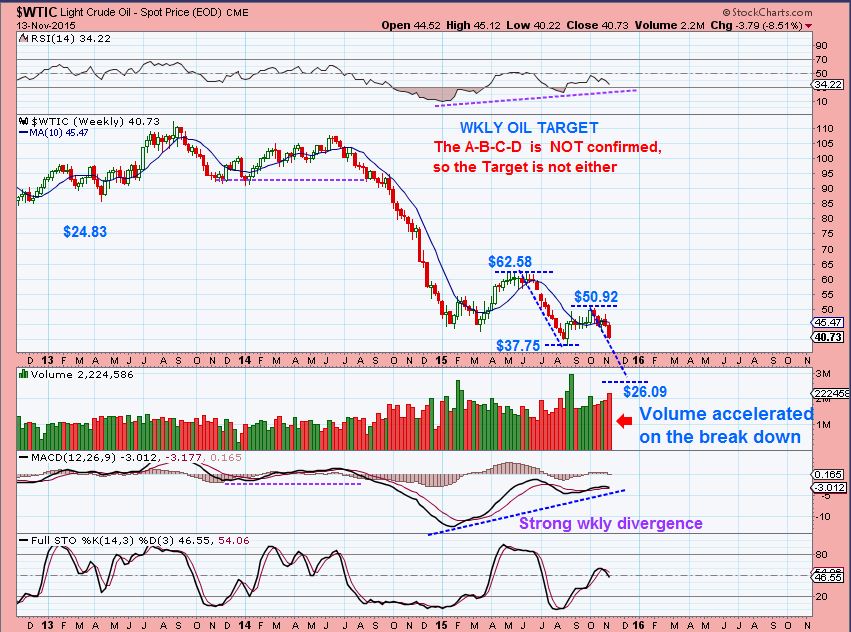
So we have this possibility, just basing out for a while.
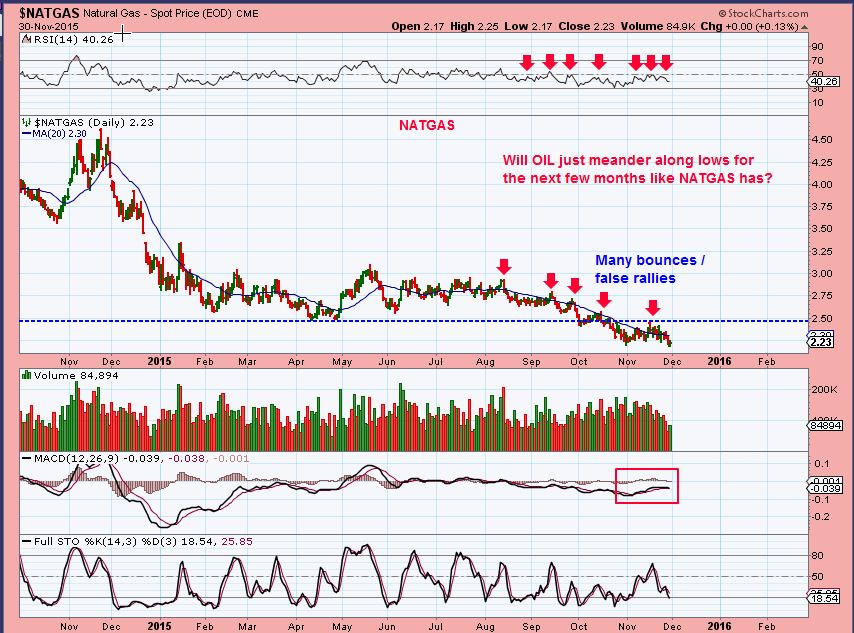
In other words, will OILS weakness look similar to NATGAS? It has also been meandering along at lows with many small bounces to the 20sma? If so , Energy Stocks could base and others may continue higher as they are accumulated.
Let me show you some of those Tricky Energy stocks that I’ve been pointing out ( And yes, I got stopped out of them). These remain above their 50sma presently.
.
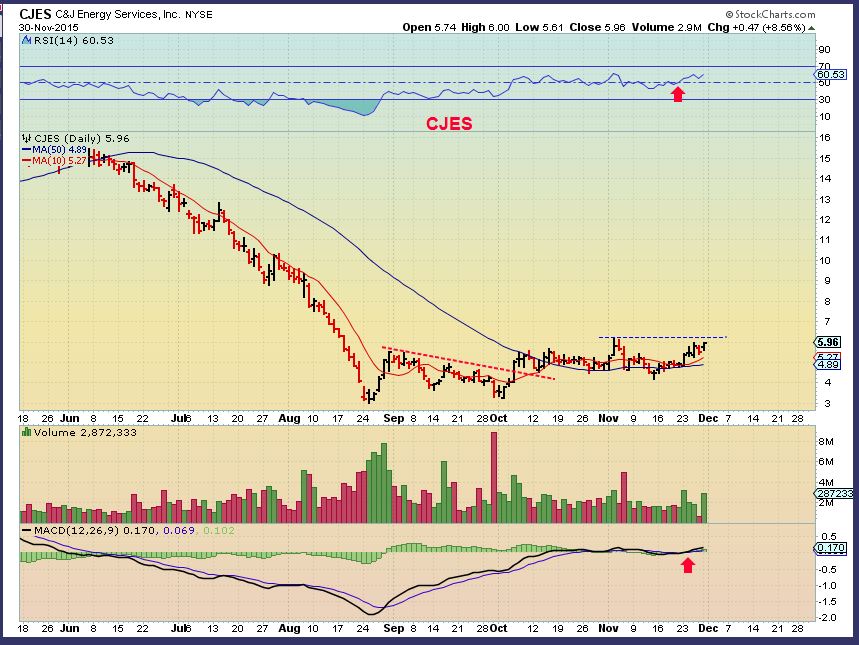
CJES – I pointed this out below $5 and I bought and sold around $4.80 – $5. Why is it at $6 as OIL remains weak? It is putting in a solid base so far. Up almost 100% from Oct 1.
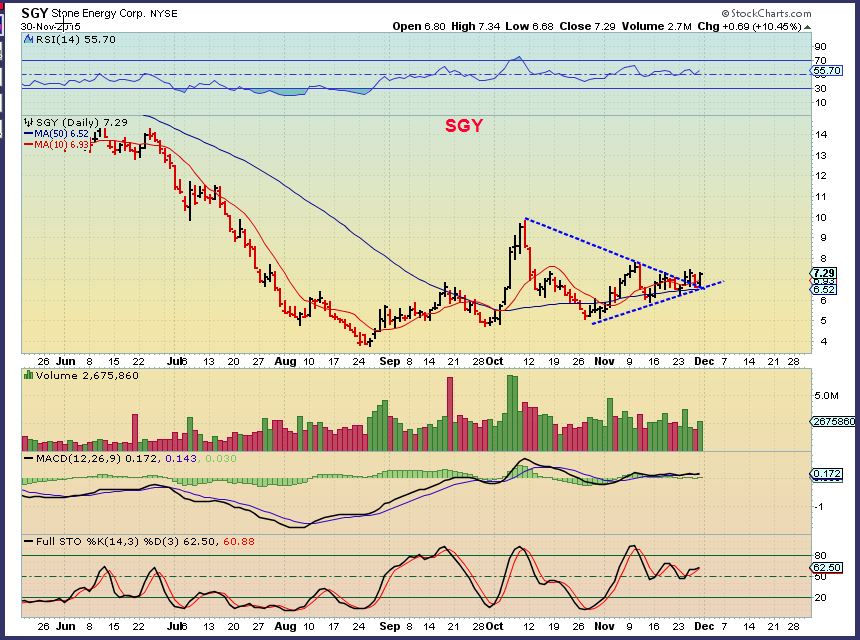
SGY – Keeps climbing. I think I sold this above $6.30 since OIL was going to become weak, and its now at $7.29. Looking at this chart, in time this could easily double, but it’s not an easy ride.
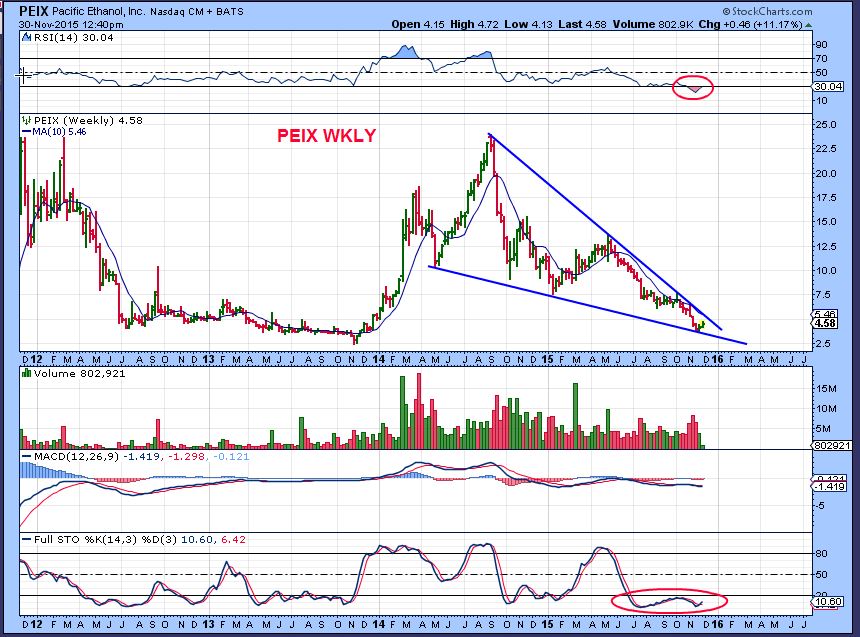
PEIX – I was watching PEIX Monday morning and emailed a friend about it’s potential. This could be HUGE if it breaks out. It was up 9%, then 11% this a.m. and volume was looking good. I charted this after lunch.
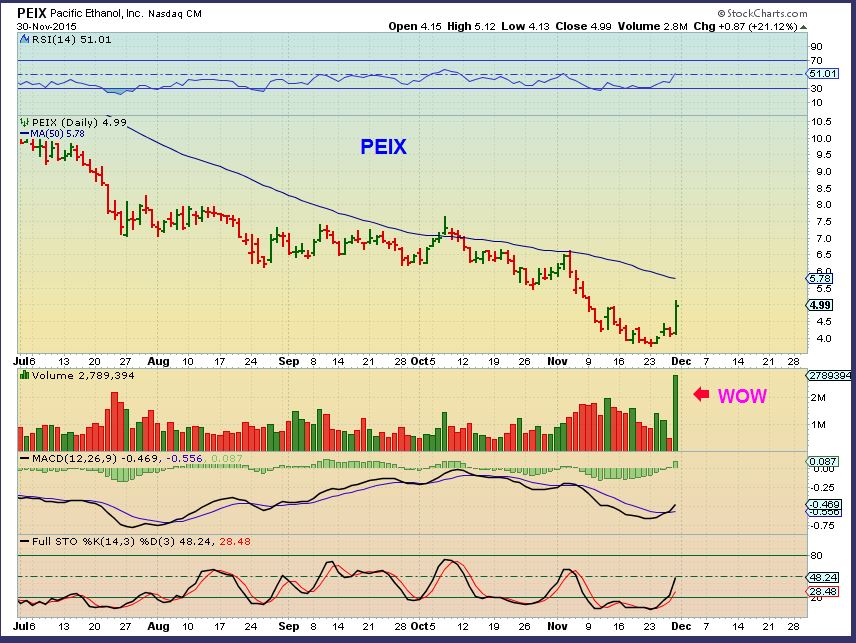
Zoom in…WHERE did that volume come from? Up 21% by the close – I should have just jumped in since it was that oversold. I waited for a pullback into the close. Longer term I believe that this has strong potential.
SO Energy still looks good despite Oil & NATGAS weakness. See also BCEI, BBG WTI, XCO, BAS, etc – but be selective (See REXX, LGCY, etc for weaker ones below the 50sma).
LETS GO TO PRECIOUS METALS
I’m going to keep this simple
.
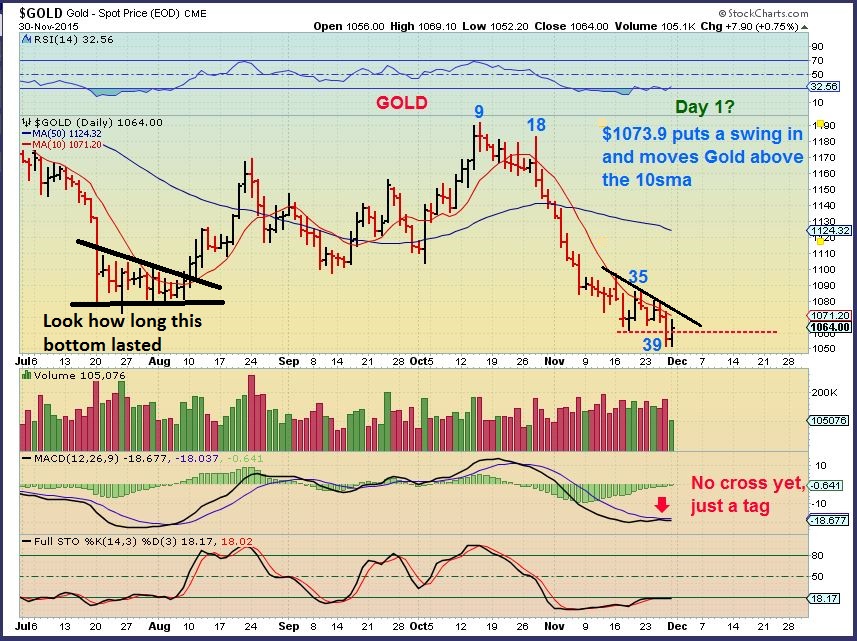
GOLD – Broke down Friday , and somehow recovered Monday with the Dollar moving higher. We never had a close above the 10sma or an overhead trend-line break to confirm a DCL. I think we may have just seen an oversold, overdone, overly bearish extended 39 daily cycle. Why? …
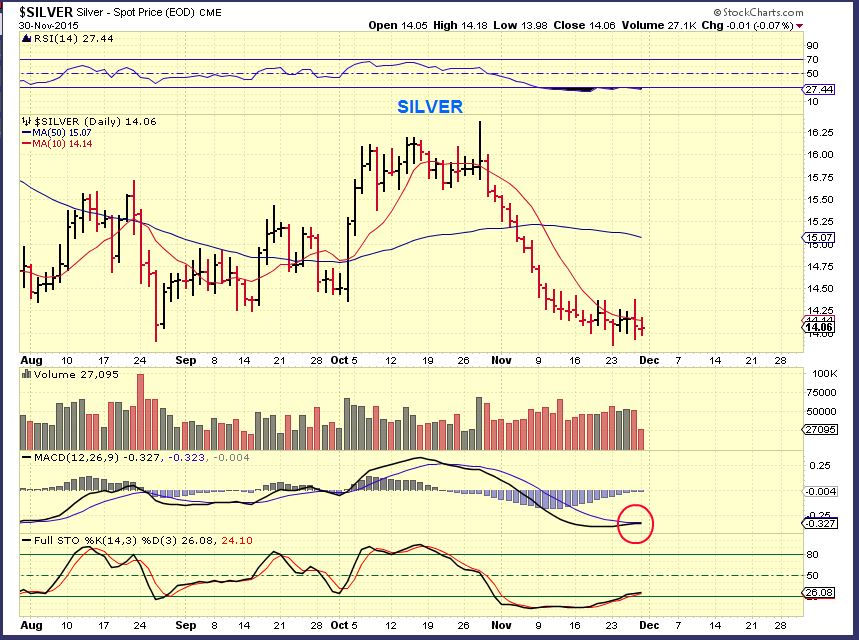
SILVER – For 1 thing – As mentioned in the wkend report, Silver didn’t lead the sell off to new lows, and silver miners held up nicely.
GDX – Is this bullish or bearish? Clue just ahead…
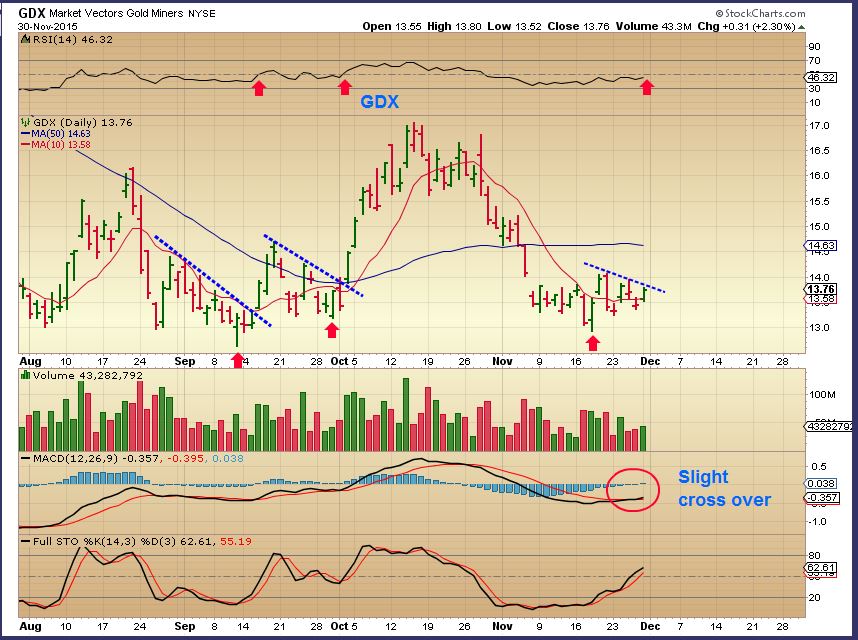
Look at GDX components. Bullish or bearish with GOLD breaking to new lows 2 days ago?
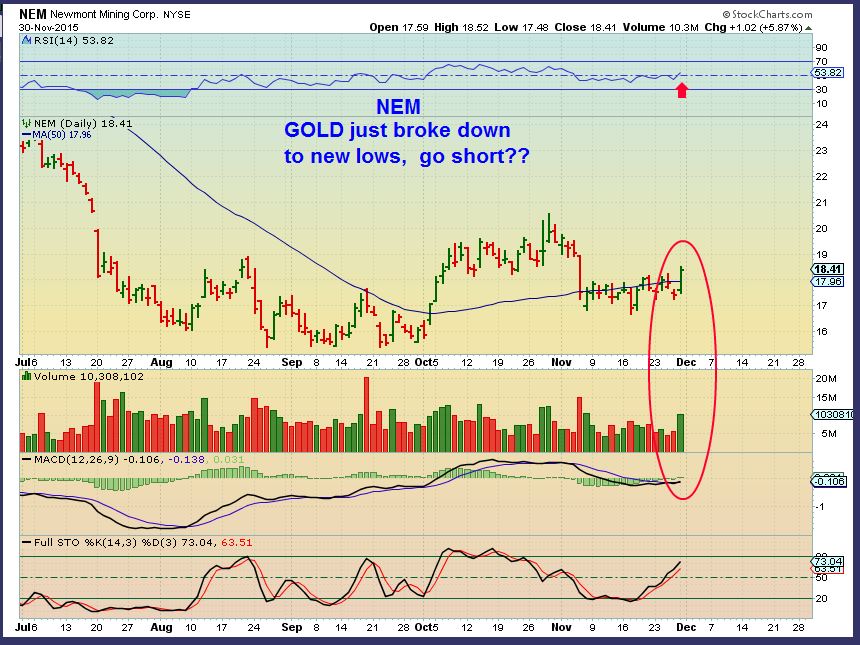
NEM – This with Gold breaking to new lows
ABX – With Gold breaking to new lows 2 days ago.
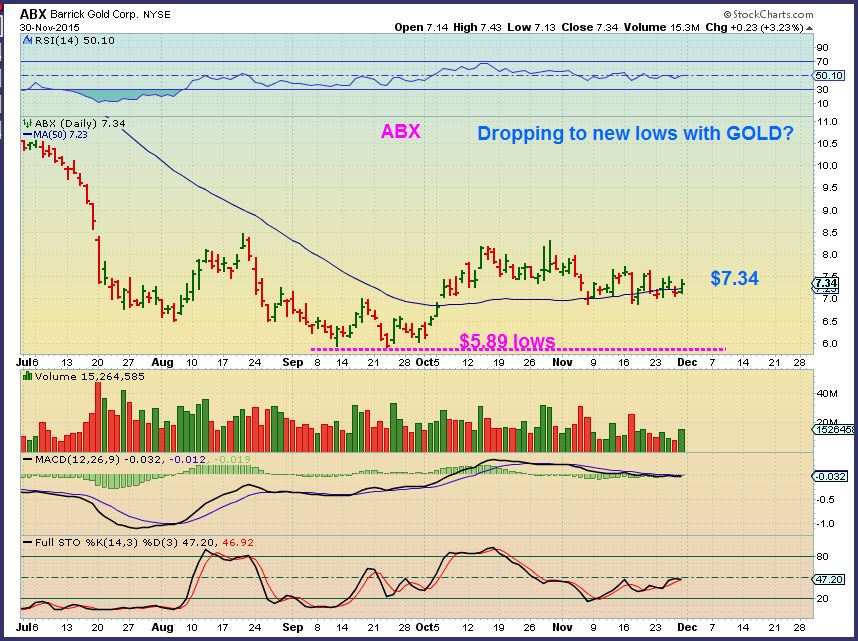
Components of GDX are not at recent lows, while GOLD broke down and recovered. What about a few other Miners. They usually get KILLED when Gold drops.
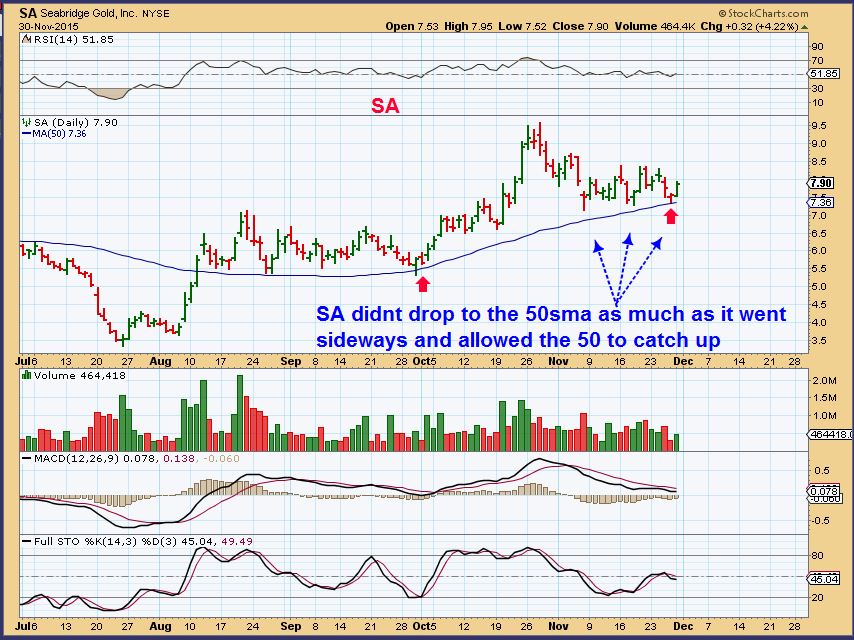
SA – very strong
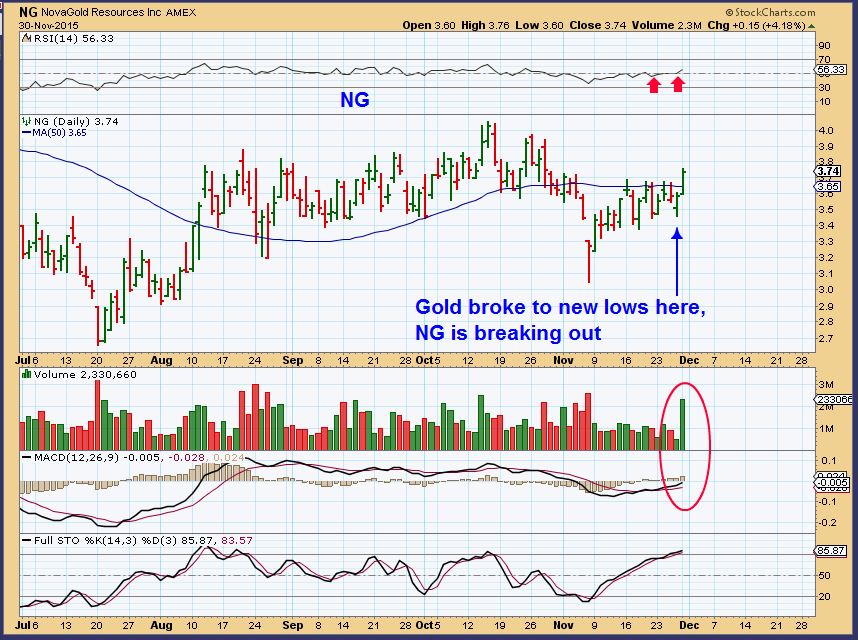
NG – Breaking back above the 50sma with strong volume.
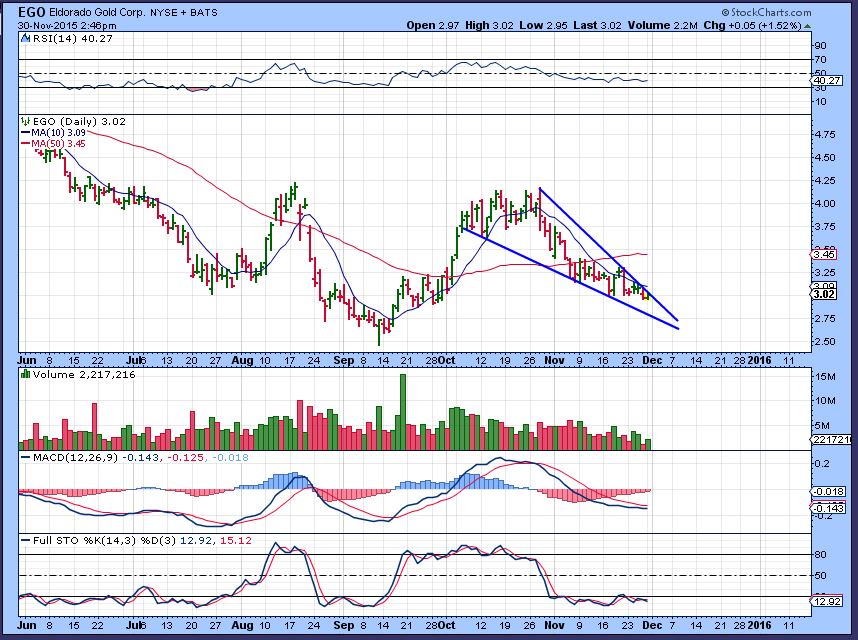
EGO
Many are shorting the recent break down as weakness and utter failure in Gold. I see things differently and wanted to share that with you in the weekends report with the things that I was looking at.
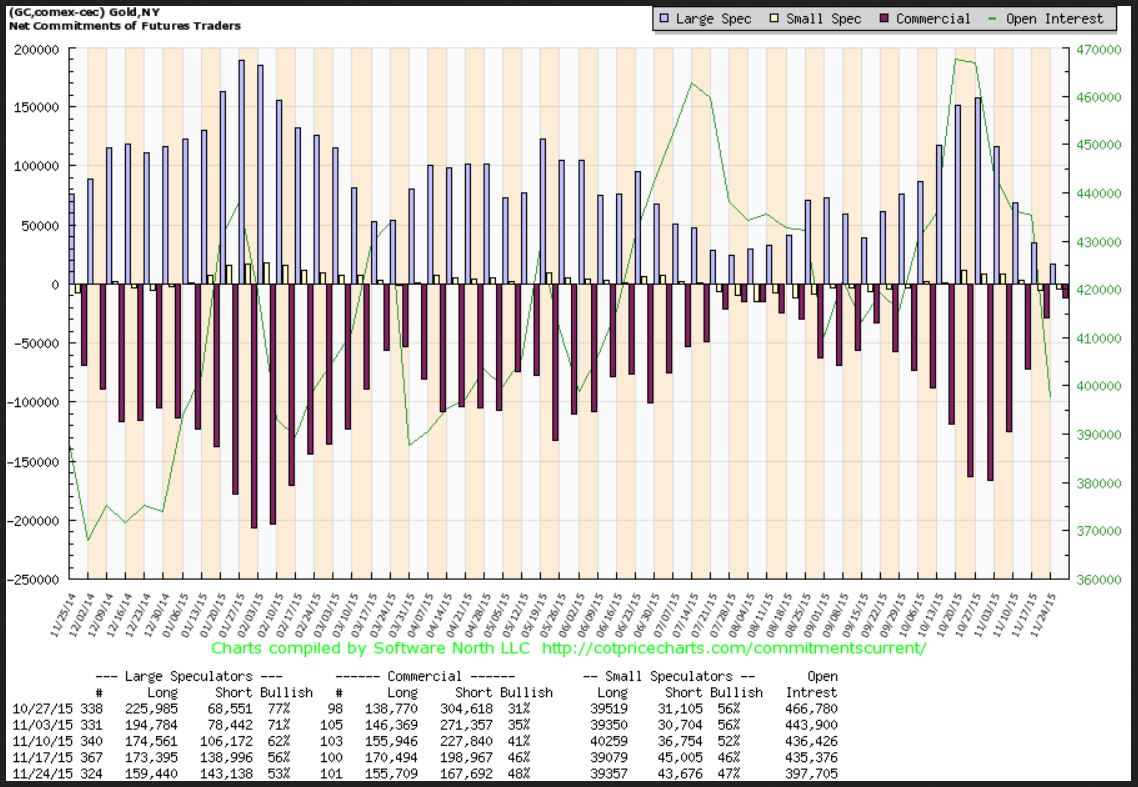
In conclusion, The SMART MONEY had abandoned their shorts as I pointed out in the COT over a week ago. How can they switch to heavily long? By causing a stop run and buying that dip when others are selling. Now that dumb money has gone heavily short, the rally may begin. We will see. Notice the latest C.O.T. report.
The C.O.T. was released for last Tuesday. It is at prior ICL levels. SMART MONEY IS NOT SHORT.
I think that we are seeing a Bullish, not a bearish set up In precious metals. Watch for a swing low in Gold soon. IF GOLD closes above the 10sma, I think we have an ICL and MINERS can be bought. I actually added some today with the above charts showing MINERS strength above the 50sma and the thoughts shared in the weekend report. Even if you just want to grab a quick 10% and sell because you dont trust it, charts like SA, NG, etc. are technically acting correctly.
~ALEX
I am also going to post some other bullish set ups below. There were many set ups that looked great Monday, use stops below support if you enter any of these.
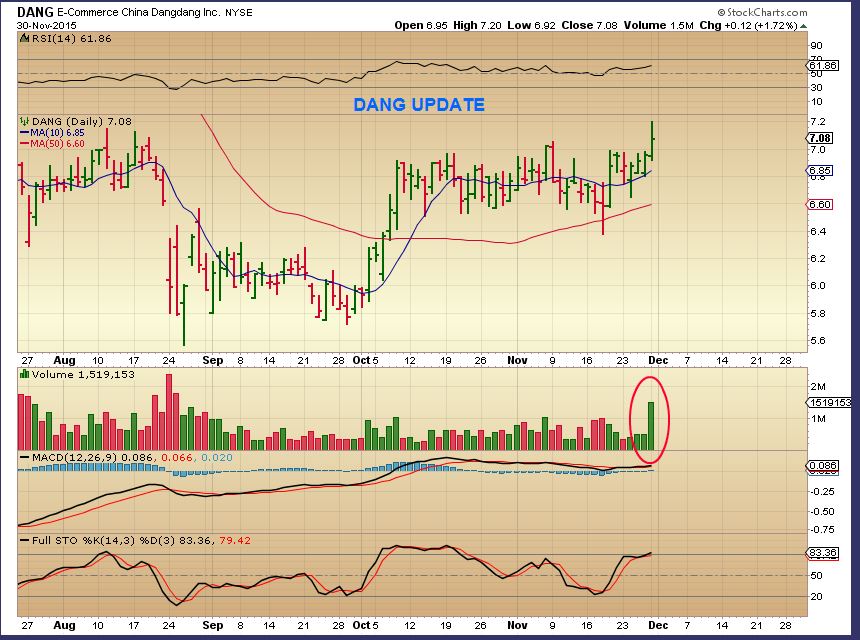
DANG posted here a few times
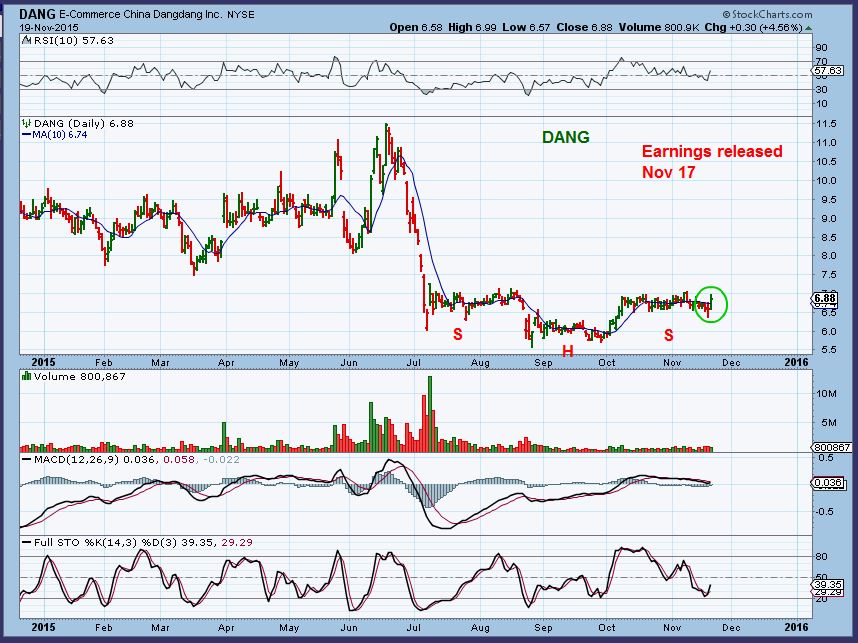
Dang begins breaking higher.
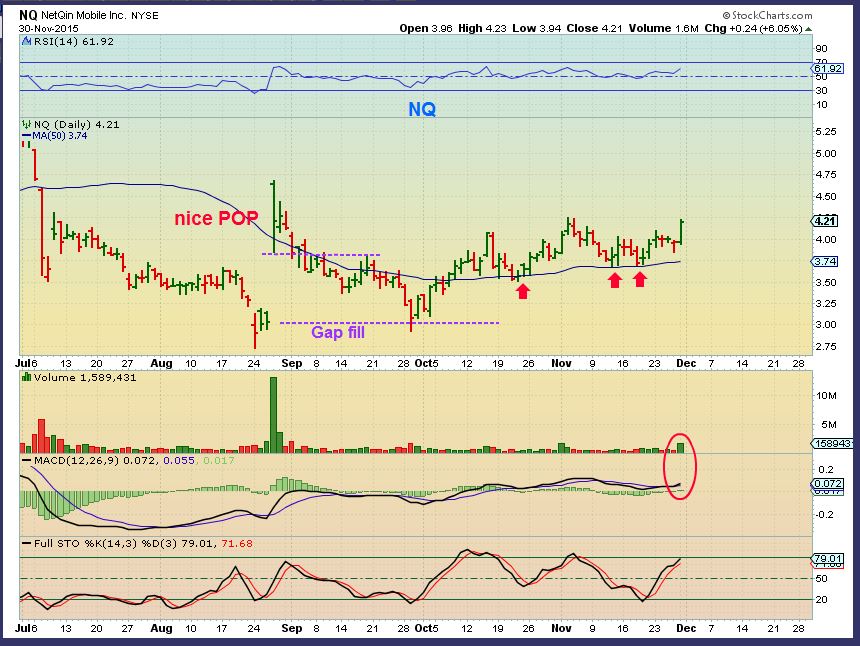
NQ- supported at the 50sma and starting to move higher.
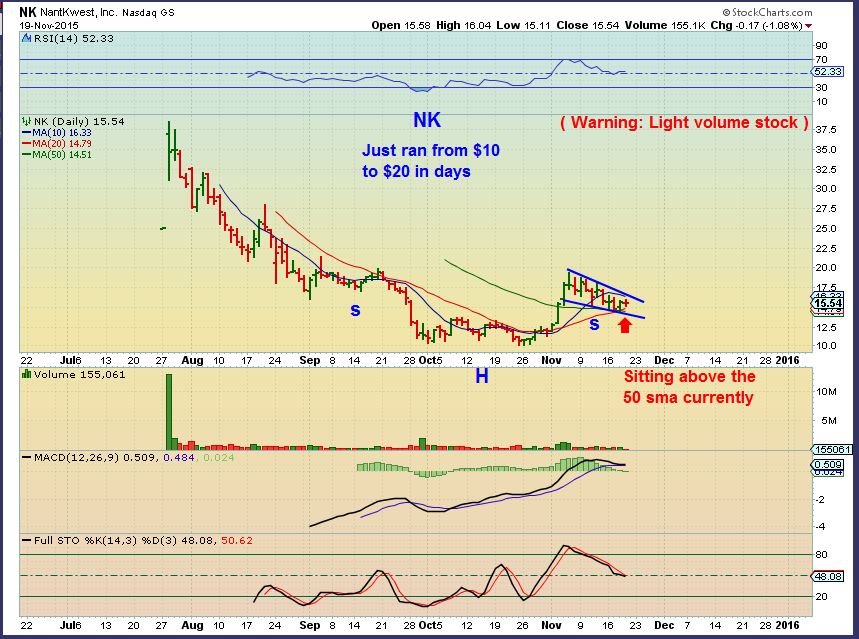
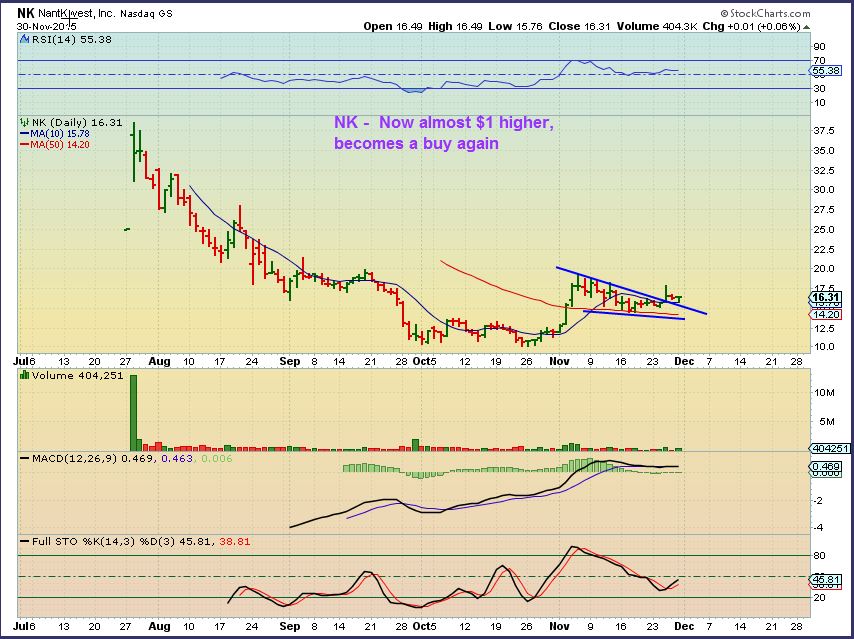
NK – I pointed this bull flag out Nov 19. It broke out & back tested it, and its a buy again (chart 2).
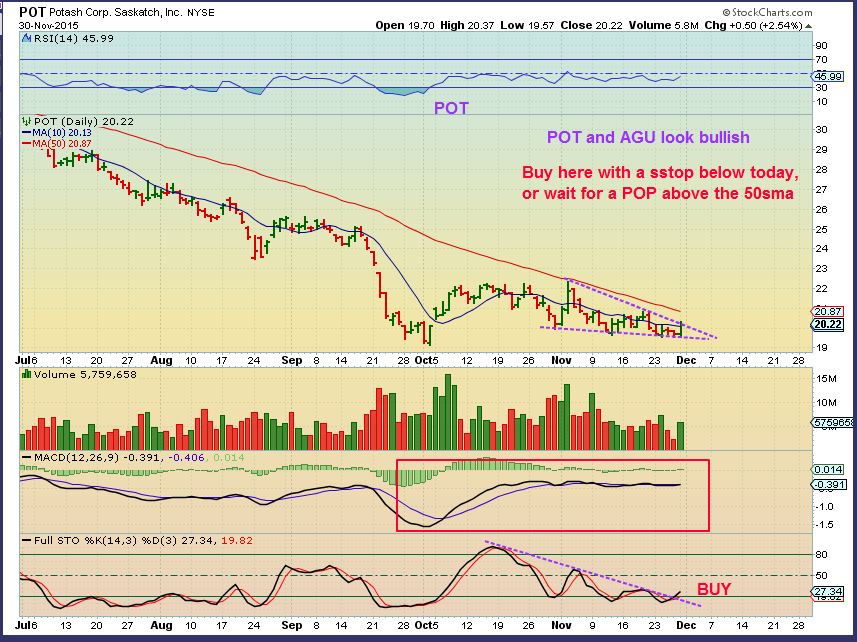
POT – POT, AGU, AGRO, etc looking bullish.
I will list some interesting chart set ups for you to look up on your own too. Happy Trading!
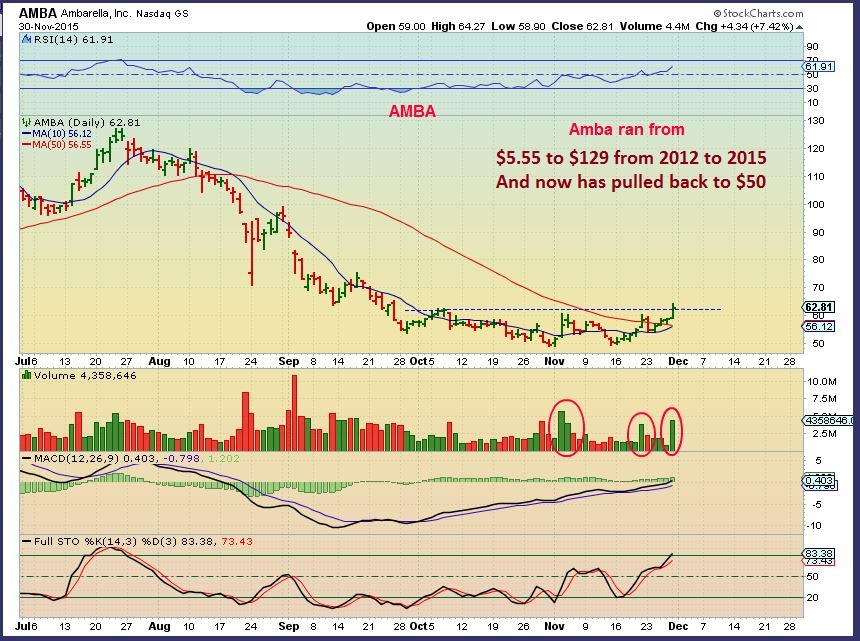
IDRA, GPRE, GLF, AKRX, CMCM, CRUS, SFM, AMBA


Looks like GOLD formed a swing low Yesterday? FWIW
3rd time in the last 2 weeks….
Those are not confirmed swing lows, they are merely price swings.
Excellent done ALEX….. I see what you explain.
Many thanks.
Thx Geurt
It’s dawned on me CF that you talk short and long term however I won;t be buying into any of your great ideas again for a long term hold UNLESS the stock has at least a 200DMA that has stopped falling and better still, is rising.
The thing that jumps out at me of the IWM chart above is the flat 200DMA. There is no buyable trend there. Or holdable. No point being in.
The same goes goes for stocks which have been battered down – never mind near ATHs. If 200DMA falling then no point buying for a longer term hold. It’s just gambling. A flat 200 that was falling has a better chance of a foundation building. A rising 200 from falling/flat has a better chance still of a rising trend.
I should have realised this long ago. But that’s what experience and thinking brings.
Anyone reading this don’t get me wrong. CFs service is brilliant. You just needs to know what you want from it.
Number 1 Rule in Trading. Always trade the trend! I’m with you on that JDWM
What time frame 🙂
If you are looking at daily charts, then the trend should be dictated by the weekly chart. If you are looking at a 2 hr chart, then the trend should be dictated by the daily chart. Etc. IMHO
yeah, I was joking-
You called it rule #1 – and said you were with him on that, buy only with the trend , but Ive never seen you use it on a daily with your bat patterns . I figured it was the trend on a 5 minute chart?
Again, I was just joking.
I’ve been real bad the last several years in ignoring the trend. My account shows it ;-(. I’m constantly looking for the bottom in miners and oil. It could be years away, who knows. I need to get back to the rules. It would be nice to hear everyone’s trading rules here. It can only help us.
Mine vary according to short term or longer term too. And they are very different.
Al list would help, if its not propitiatory!
Its not , but I break the rules all the time when circumstances allow for it. I had a list of top 10 on my desk top P.C. in a folder somewhere, I’ll see if I can dig it up later. 🙂
EDIT: For example 1 rule was never add on the way down, I have done that. Never double down at lows .
No, First Rule of Trading is You do not talk about Trading https://www.youtube.com/watch?v=pOa4fvUlhiE
lol
Please be aware that buying with a rising 200sma is not risk free
either. Some stocks get very extended and drop fast back to that
200sma.
Look at AMBA on a 3 yr, that has the 200sma rising and then
crashed. Look at TASR, look at MU – All flying along above their rising 200sma, they failed too.
Yes, you must realize that long term and short term are different. Buying after a sell off is a low risk set up, because the stop is below price and the selling is stalling. %-Gains can be huge short term (Some are up 100% JD).
IF you want to buy long term with the 200sma, you must have bought my recommendations for NKE, ULTA, UA, etc a year ago? They may not be a good buy here though, because the markets experience change..
The Euro is strongly bid today and still (!) hangs just under major support of 1.08 (currently 1.062). As I’ve said before if – biiig if – euro breaks above (and better still 1.09) then the break below 1.08 is likely a failed breakdown. If so, this will put downward presure on US$ and could be bullish commodities.
ECB decisions re QE and rates on Thursday.
Technicals suggest Euro can strengthen.
Big players are are playing out the swing traders in gold. Today is the 3rd time when they play this game in the last 2 weeks.
Bottoms often form the battle lines. Look at GOLD in AUGUST
https://nftrh.files.wordpress.com/2015/12/gold-cot.png
Yes, that is exactly what I am pointing out, the COT set up matches prior lows. The SMARTMONEY closed thier shorts and are now long (Actually it is even better than prior lows).
Thanks Alex for chart on POT. Scalped it this AM, and keeping eye on for re-enter. 🙂 Nice.
Hey W
Not much room inside that apex, huh? I’d like for price to remain above the 10sma , then I’d expect it to break out higher soon rather than breaking down, but one never knows. Nice trade.
I didn’t try another scalp. Looks broken. Happy I got out with profit.
JD
ORLY and LAD may be your investing style, above the 200sma and climbing, but you’ll need to wait for them to return to their 200sma. I’m not sure what your buying strategy is. UA has returned to the 200sma.
thx muchly
AAP too, but it dropped fast to the 200sma and is under it
Hi Alex,
In regards to gold and miners….any hints to look out for whether this expected move up is just a DCL or an ICL ( any differences on the initial upleg). Or is this just determined based on the type of pullback. Wondering if I should sell at initial resistance….or set stops and potentially give up any gains if this happens to be the 4th DCL and it rolls over? Thx for your insight.
Hi Curtis,
I have been debating this in my mind, because a 3rd or 4th daily cycle would be pretty weak and could roll over after 5-8 days. At this point for Gold, we need it to break above the 10sma and put in a confirmed swing low first.. Miners are ahead of the metals.
The COT , Sentiment, etc. matches an ICL much more than a DCL, but it may be best to trade it as though it is a dcl until it really moves higher. since It would make sense to drop quickly to below $1000 or 1033 area for a test of 2008 if that needs to happen. Stalling at the lows is going to make it difficult to be patient.
thx Alex
BLOX – They sold it off before earnings and apparently yesterdays earnings were good.
CHECK OUT TC – Refresh . slammed down on high volume yesterday, Up almost 50% on much stronger volume today . ( Thompson Creek Metals) . Volatility in many areas
SGY & WG have follow through in Energy . REN bull flag?
CBAK on the 50sma trending higher?
GDP, REXX UGLY.
NETE has been crazy lately
GIGA ridiculous.
NQ – Earnings last night…broke down. Was above the 50&200sma, 200 started turning higher.
NVDA – sweet run for the past couple yrs, over extended above the 200sma.
GG finally joining in, ABX breaking higher has moved GDX up quickly while GOLD was in the Red.
Now Gold is catching up. Looks good
Does anyone have an opinion of this chart? (JFS/UN.TO)
Price stopped today right at first support; next support is at 14.00
Irrelevant as it may be, I’m down 6% and need to decide if I’m out, or add more if it gets above 20 dma.
From a seasonal point of view, the next 6 months look promising.
http://stockcharts.com/freecharts/seasonality.php?symbol=JFS%2FUN.TO
You may find support right here. The 200sma is at $14.33, but technically the chart is weak.
The volume is SUPER LIGHT – ( only 8500 today). That can be good or bad. Its good that its falling on light volume, but if the 200sma is broken and bigger money starts to sell as a result of that, it could drop fast.
That said, I dont think that I would add unless you see some buying come in. You may get a bounce at the 200sma , if it breaks it could cascade sell like it did with the 50sma. A bounce may only form a H&S .
.
refresh for a chart- click to enlarge
.
Thanks Alex – man, you’re fast!:)
This almost qualifies as a “thin trader”. Lighter than average volume this week is good.
My patience has run out on this one – will dump if 200 breaks.
Thanks again.
Ur welcome- Sorry it couldn’t have been uber bullish news.
I’d flip the money into SA and grab a couple of bucks , but that’s just me 🙂
haha! SA starter position filled!
REXX downgraded? Wow……..
yeah, They gave it a price target of $0.75. Not pretty.
You should re-post your GDX overlay chart again today. GDX is moving up pretty good now.
https://www.tradingview.com/chart/GDX/eFXdtlUM/
This the GDX chart you referring to? Hit the play button to include Today’s action.
Thats the one – Thx.
Could be on our way here with Miners acting bullishly despite Golds weaker action.
https://www.tradingview.com/chart/XAUUSD/ndw0hK1Q/
I thought Gold was moving up a week and a half ago, lets home its starting up now. Day 2
nice….
The chart I posted below of TC, it was up 43%. Now its up 72% . Wow.