
Ready To Run?
Not a whole lot has changed since my Weekend report. This is a week with a Fed Mtg on Wednesday, and I dont usually expect a lot of action until the deed is done. My weekend report covered a couple of different scenarios going into the Fed Mtg, so lets see how things played out on Monday.
.
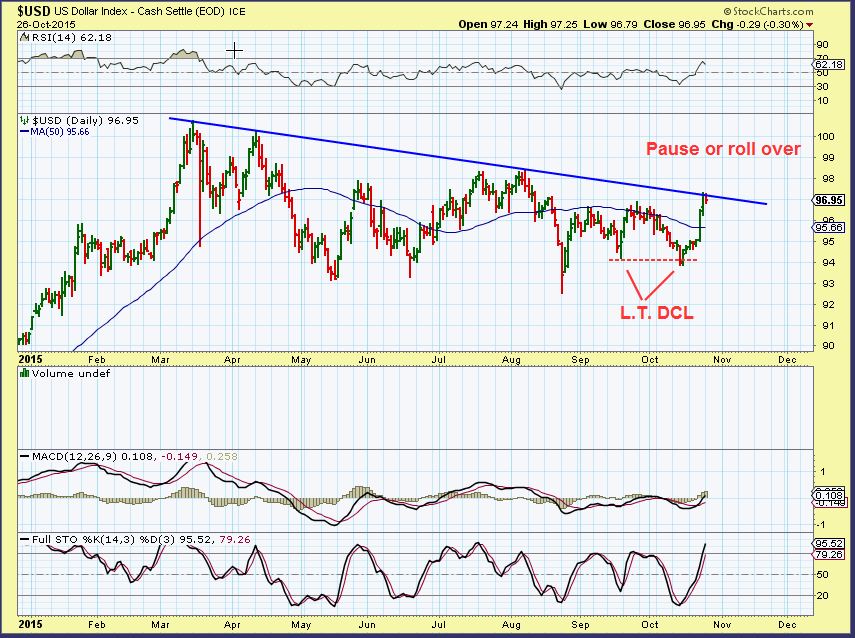
$USD – 2 left translated cycles and then a strong surge higher with news from the ECB & CHINA last week. We are pausing at resistance. Is the USD waiting on the Fed?
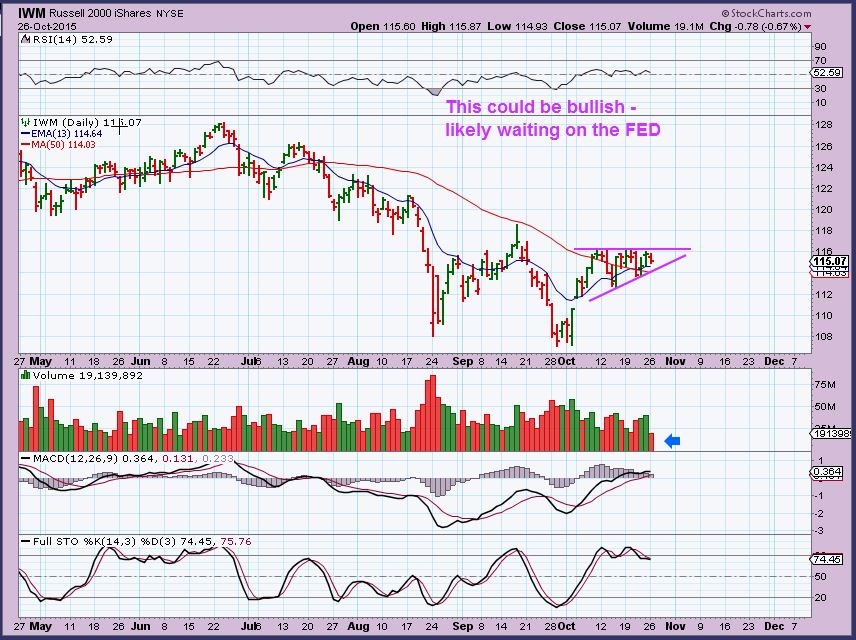
Looking at the SPX, DJIA, & NASDAQ, not much changed from the weekend report. The patterns on the under-performing IWM & IWC are the same, and they are a bullish pattern at this point.
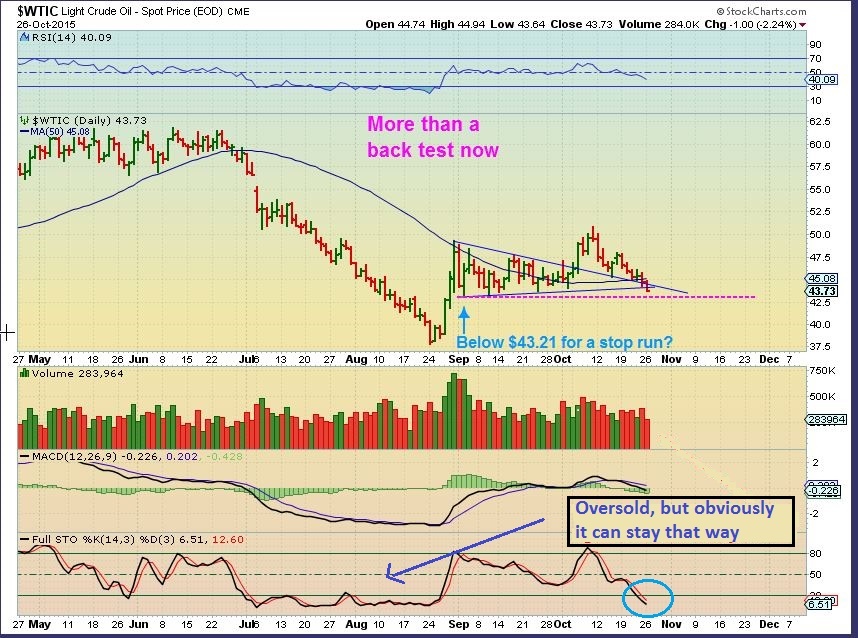
WTIC – Ever since Oct 9, I’ve been calling for a break out and back test of the triangle. We actually broke back down below the triangle today.
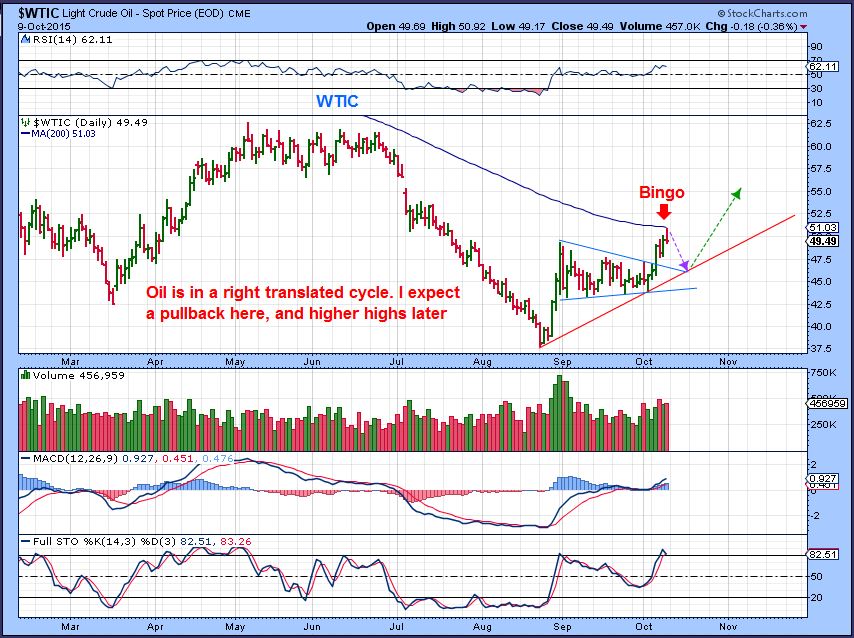
Late in Oils cycle, we still should turn higher soon, and the “Talk” is even getting quite bearish again on CNBC. Maybe we’ll see a stop run below the Magenta line. It is best to wait for the reversal before buying (especially for the UWTI fans).
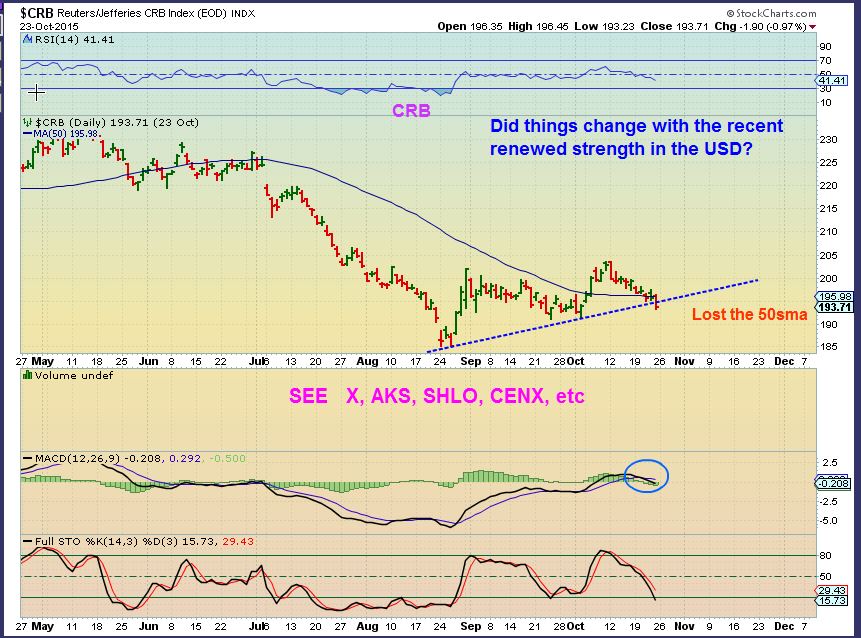
The CRB broke a trend line today and lost the 50sma again. Commodities where setting up nicely, but I don’t like the way X, AKS, SHLO, etc sold off recently.  FCX, MTDR, and VALE still look fine, so I want to see how all of this looks going forward too.
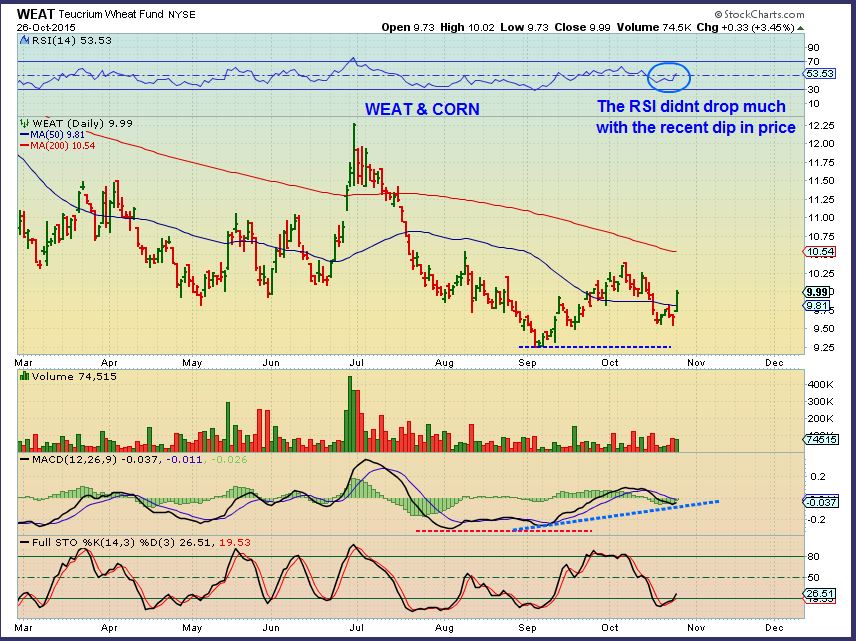
WEAT & CORN looked Bullish today, reversing off of higher lows. Since they both also lost their 50sma and recovered, there is still hope for the others that do the same.
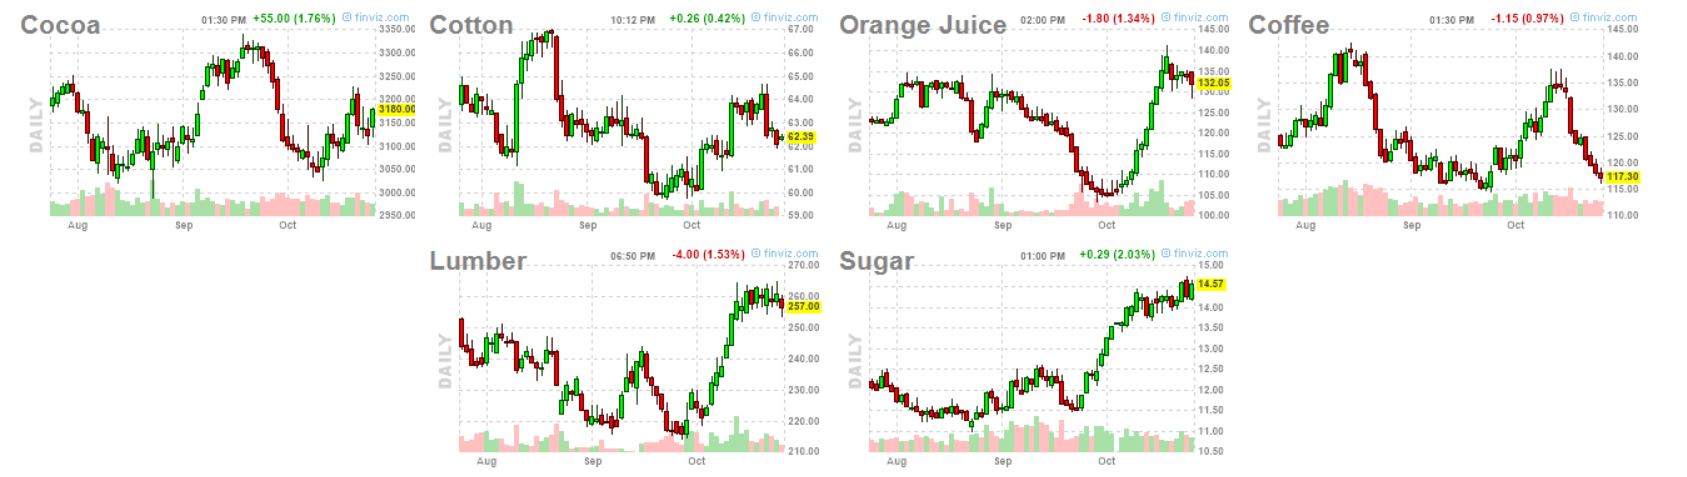
Various SOFT commodities look fine.
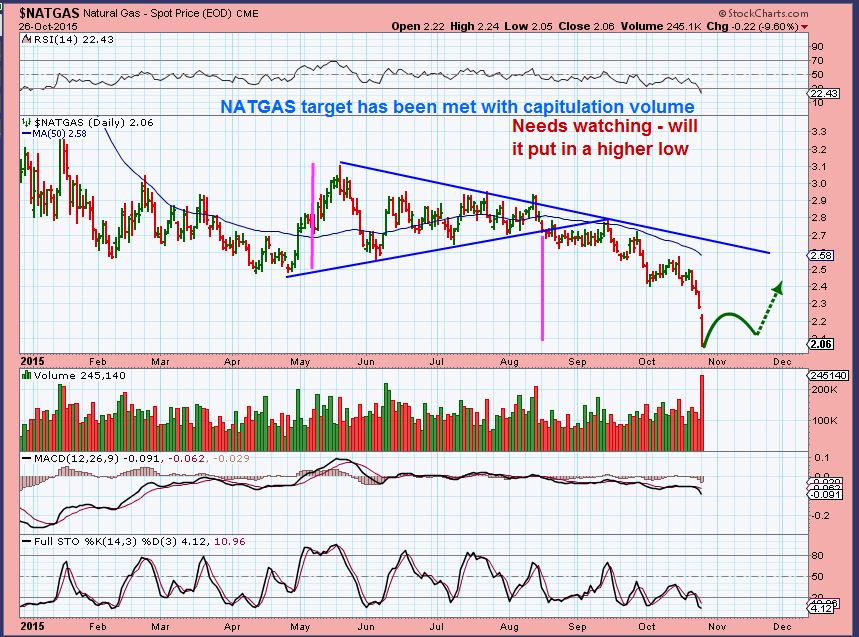
Lets run through NATGAS. It seems close to a blow off capitulation type low. It has been ugly and it may be better to just let this run its course and buy a dip after a low is established.
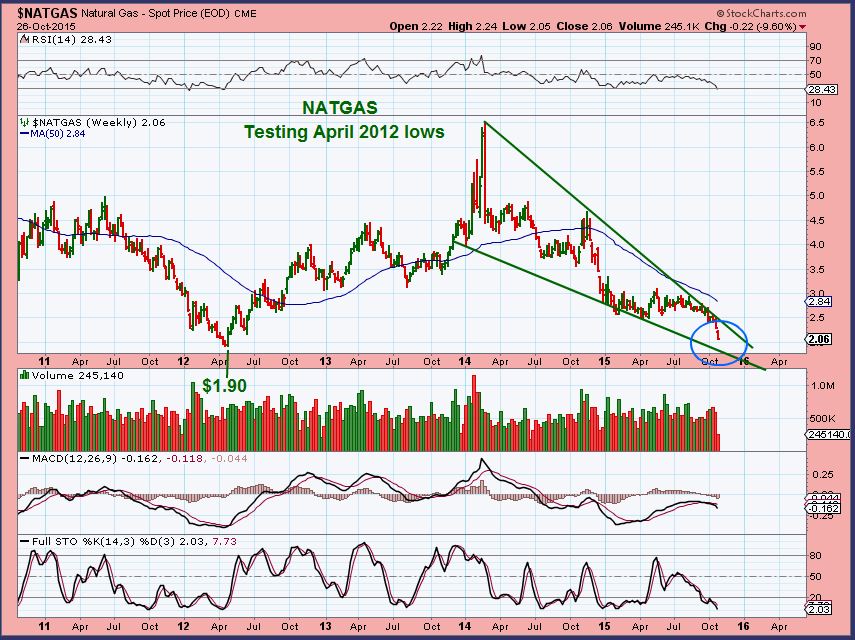
LONGTERM NATGAS – NATGAS has been selling off since 2014. We are approaching support in the $1.88-$1.90’s area. (I forgot to label the lows of 2012. They were $1.90 also). Lets zoom in…
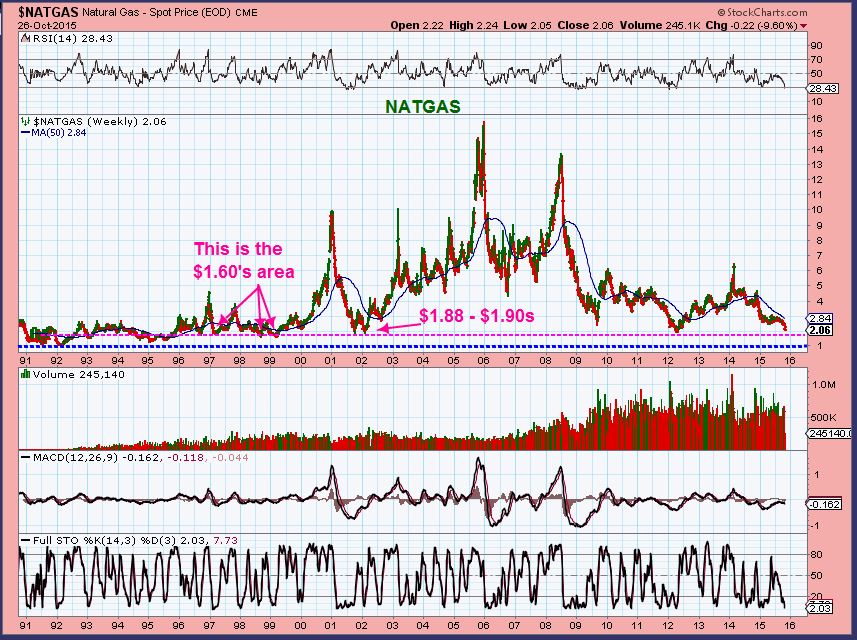
NATGAS – Natgas was down about 10% today!! It may be testing the 2012 lows on a 4 yr chart, and also may complete this bullish descending wedge.
NATGAS – With this close up you can see the gap down & 10% sell off today. We see capitulation type selling, but this volume is a misprint (Stock charts changed it later Monday night). It has basically completed a measured move from the Triangle break down now, but it CAN extend further. I drew a small bounce, but then I went back to 2012 to see how NATGAS moved off of those lows and it was a Big bounce. It was $1.90 to $2.76, and then back to $2.17. Big moves.
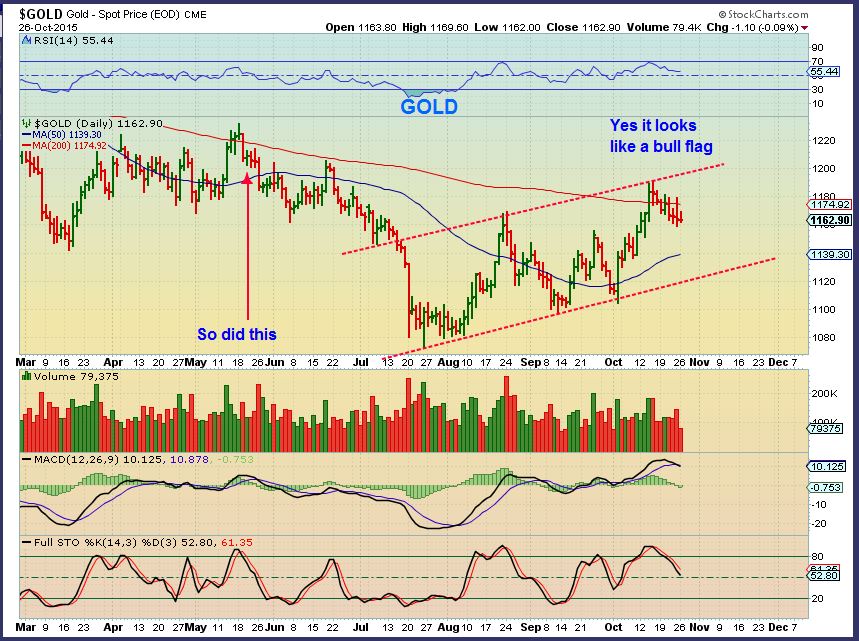
GOLD – Gold did not change much at all from the weekend report. Bull Flag? We’ll see after Wednesday.
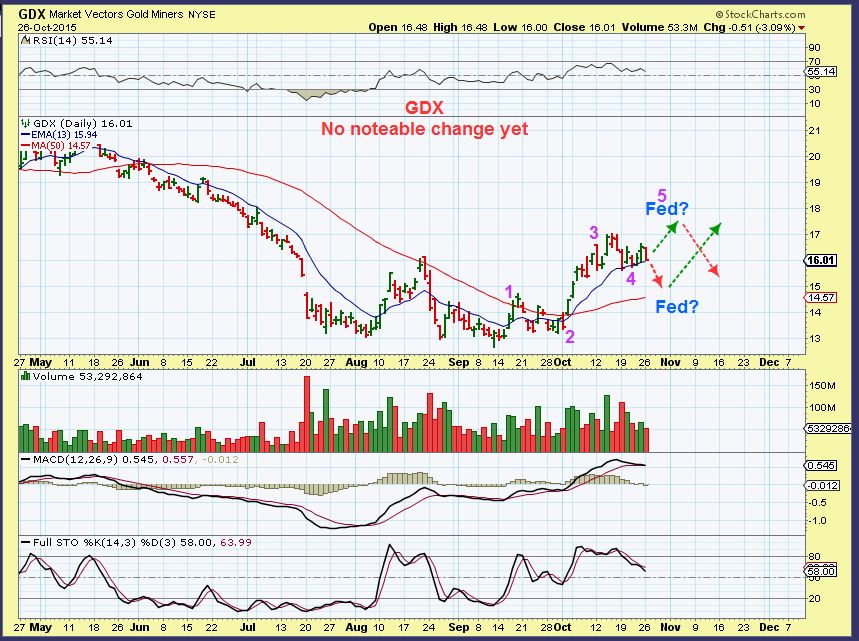
GDX – See the weekend report
SO basically I am trying to be patient and wait for more clues, but honestly the real evidence will probably be revealed after the Fed Mtg.
Did anyone notice the nice recovery in Chinese stocks lately. I loved some of the set ups. If you get a chance, check out 3 month charts of LITB, YELP, CYOU, BZUN, HGSH, SOHU, BIDU, CHNR, NCTY for example.
As mentioned in earlier reports, with earnings being released, I still see some stocks rocket higher and others drop like a rock. Its a very tricky environment. This a.m. BABA and YAHOO are up nicely.
~ALEX
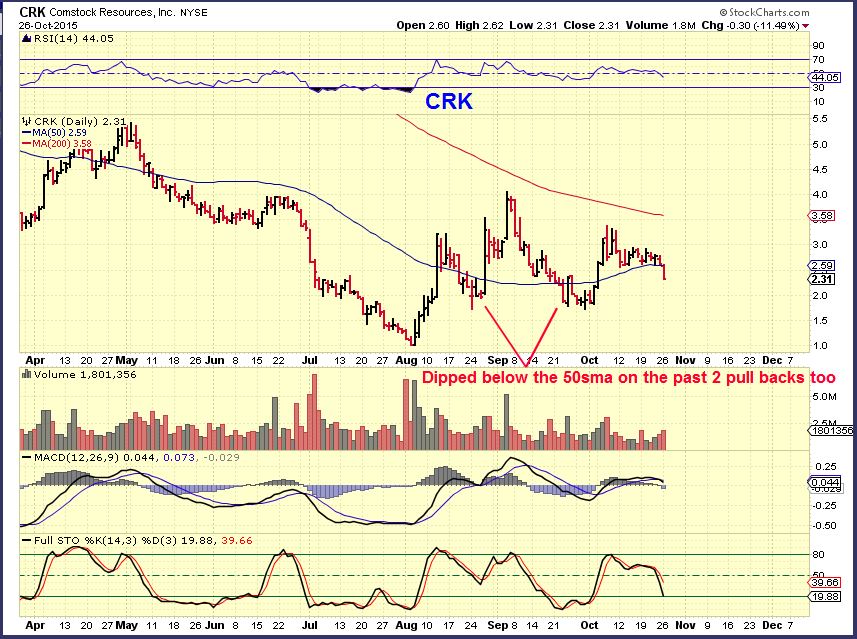
Side note: Some Energy stocks were holding up nicely, others were selling down. I got stopped out of CRK Monday as it dipped below the 50sma. I knew that it has dipped below the 50sma in the past and still recovered, so I was tempted to just ride it and see what happens, but doesn’t this look like a possible H&S forming? Risk/Reward said to honor my mental stop.
Please honor your stops – even if you see a bullish side ( I could have said , “CRK broke the 50sma in Aug and Sept , but shot straight up shortly after.” )


Oil still going down, when it turns so will Gold and Miners. IMHO. Keep an eye on $42.76 WTI
Good to remember Bill the line in the sand 42.76
And…. what’s in your eyes Nat.Gas doing with your analyses? (EW)
Thanks Bill.
NATGAS, wow, no way to tell right now. It could just keep going lower. If I had to guess, I would say look for a bounce a few days after OIL moves higher. Just a guess, not based on any TA
WOOO! OIL Just hit my target $42.76, which is the 61.8% retracement. Lets see what happens.
We have a bounce off of the 61.8 retrace, now need a higher low.
My entry point is always suspect. Is that what you do, wait for a higher low? What time frame?
Sometimes I wait, but if I’m in front of the screen and the cycle timing is right and 30 minute & chart 15 minute charts have divergence, etc I might take a stab. Often it bounces around and isnt a straight up move though, so you can watch it on smaller time frames for divergence.
Also- If it was GOLD and I was looking at Miners, I’d look to see if any individual Miners were leading the way . So maybe wait for some Oil Stocks to move too?
Looks like some energy stocks starting to rebound.. EXXI, RIG
Yes, EXXI and GST hit the 50sma and held . The XLE did similar.
It should be interesting to see how they close
May be prudent to wait until the RSI reaches the level of oversold as it did the last three times. See chart
FIB re-trace for 42.76? -OR- low volume node there? or other reason for that level?
I had it at the 61.8% retrace. Looks to be a Gartley pattern forming which should run up from here. Very similar pattern than previous January. I would look to get to the same level of overbought on the RSI as I circled.
Good morning ALEX….. thank-you-so-much for explaining Nat.Gas.
This helps me a lot. I will keep an eye very close to it.
Have a good day and a blessed week my friend.
I haven’t kept a cycle count of NATGAS, so I cant tell when a low is actually due. That makes it difficult, because we can get a bounce & still drop to the $1.90 area, while the bounce looks like The Low.
It is always safer to wait for a higher low, but not always easy because that first bounce can be pretty big.
Maybe a 1st bounce target on UNG would be 10.8x? Futures expire today and inventory report is tomorrow AM at 1030 Eastern. Then maybe this? 13EMA meets 50% retracement of recent breakdown…
Alex, Nice review of the larger commodities picture.
Thx Rube – I’m trying to get a larger Big Picture, but that break down in steel stocks and aluminum didn’t help : (
AUY & SAND made a deal …Sand took a hit for it, but AUY has strong volume on the way up. It actually looks like it wants to break out of this flag ( caution: Fed Wed) .
I took the trade @ $2.45 with a tight stop under the 13sma. (Edit: The 13sma is not shown here)
.
Thanks for sharing the trade!
For me I probably have to see follow through soon or cut my position. I wont be in front of a screen tomorrow – I may hold a smaller position through the fed, but its risky.
So may flags broke down in Energy, I guess they can go either way under current conditions and the FED can change anything 🙂
SAND also has a bought deal financing for an additional 8.8 million shares. Guess they needed it to pay AUY.
Mid day – AUY has 5 Million volume, so may end with 10 Million ( that’s Average lately) , so price could stay in this area which turns out to be a flag continuation at this point.
With that in mind- If someone thinks that the FED MTG will drop Gold, you have until tomorrow 2 p.m. to get out of Miners, but exiting in the morning may be better.
Would anybody like a handle with their cup? 🙂
test
U passed 🙂
Welcome in the battle.
tesss ti ….. scared u for a minute .. huh.. ;o)
Lurking & Working I presume?
Or just pre-fed boredom, not posting today. I hate pre-fed trading sessions really.
ha ha.. working yes.. and working on my discipline ..to stay with my waves/trading plan.
….annnd looooooks like im being rewarded with the sexiest hammers forming … . (wink)
What sector are you seeing hammers? Energy or Miners? And make sure they hold until the close….oh yeah, and its a Fed Mtg tomorrow. Thats always fun.
hangon… will show
I’m seeing reversals starting in energy.
Check out AREX, it was down a lot too.
yes.. i saw that too..
but u jinxed me .. i went to go back & get some.. they disappeared? lol
heres 1…
https://www.tradingview.com/x/XDWcAPz7/
TGS is still working 4me… (i know u dont like) ha
I just didnt like it because the volume was 40,000 and 50,000 a day.
It finally has some volume to work with. Thats probably all you though Cha $ Ching
some miners flipping b/f red/green.. ng ngd mux
this flips me out how they ride that fib line up…. (hope that never gets old)
https://www.tradingview.com/x/nlEUpWIb/
energy…
sorry..bossman is in/out today
SD OAS … also lookn ready…? https://www.tradingview.com/x/qGaRNQhW/
https://www.tradingview.com/x/jaevUGZa/
I don’t see anything about either one that tells me a turn up is happening. Fib levels? Maybe
Let’s go! Running out of patience here!
Marginally
OIL low (USOIL) is $42.59, if that gets retested and holds we should be good. If it drops below, all bets are off.
Isnt that cute. CRK is suddenly up 3 cents and is now approaching my sell price yesterday where I got stopped out : )
What happened with CJES and KEG? Getting slammed.
I dont see any news on CJES. Seems to have lost its 50sma and is trying to get back above.
Likely just following OIL now into a daily cycle low.
KEG lost the 50sma and never closed back above it again
Wow, I was in both of those a week ago, glad I had stops.
Did you see BAS?
Tran and IYT, IWM look to be leading the way down . SPY QQQ red but not too bad.
TZA, RUSS….up
Lowest volume day on miners in awhile. Looks like everyone is waiting on tomorrow.
Alex, GDX chart makes it look like a Fed slam to $15 area would be a buy, and Fed spike to $17 would be a sell/short. Sound right? Of course, it’s never quite that simple with these guys, is it? 😛