Pops And Drops
The Markets were ripping higher, and we enjoyed that ride for months too, along with the Bull Run in precious metals, but the question is, “Were Chartfreak readers warned or even prepared in any way for the large drop that we got as this week started?” The answer is Yes, we got a sell signal on Friday, one that I had been telling my readers to watch for . Let me show you how we were looking at the markets.
.
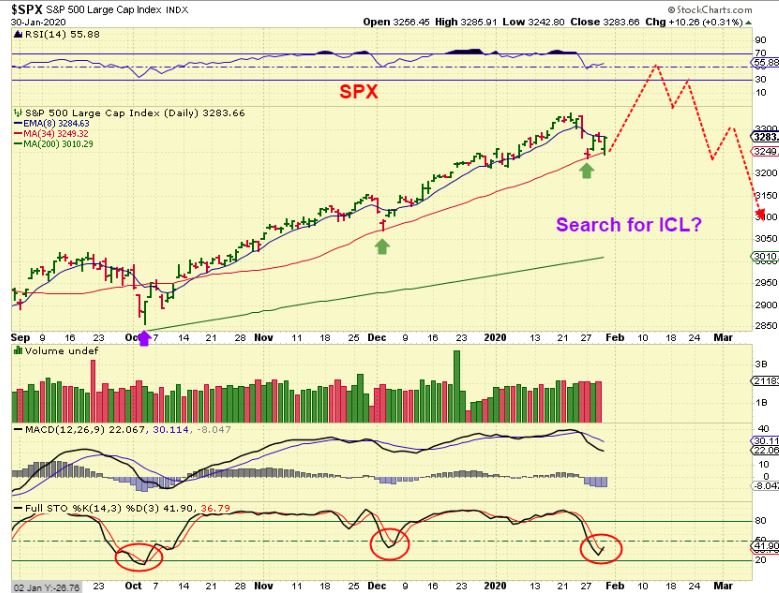
In late January, we were due to form a dcl ( a dip daily cycle low). The last one formed at the 34 sma, so I mentioned that this may be the next buy point, but I did warn that this one is arriving late in the entire ‘intermediate cycle’. With that in mind, I told my readers that we could buy it, but I also said that I would expect a break to new highs that could roll over quickly. We are due for a deeper drop into an ICL over time, so I told them exactly what to look for day after day.
.
.
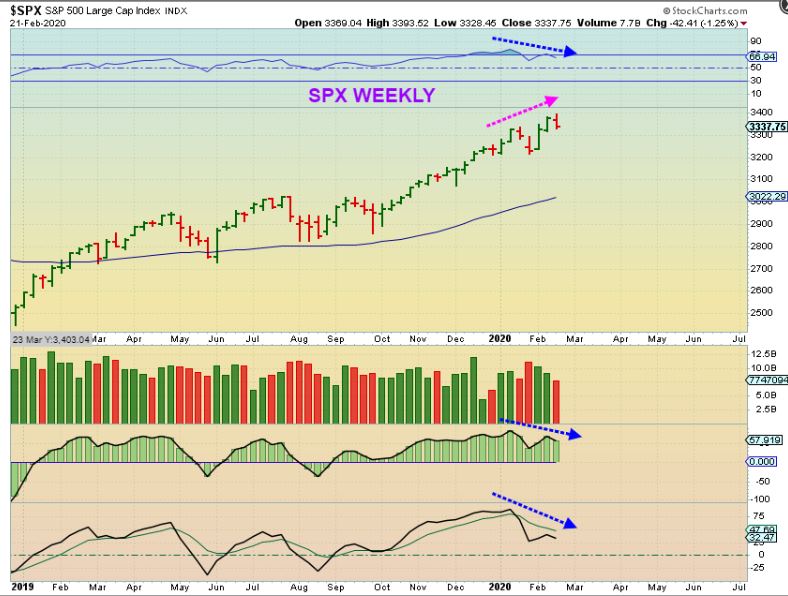
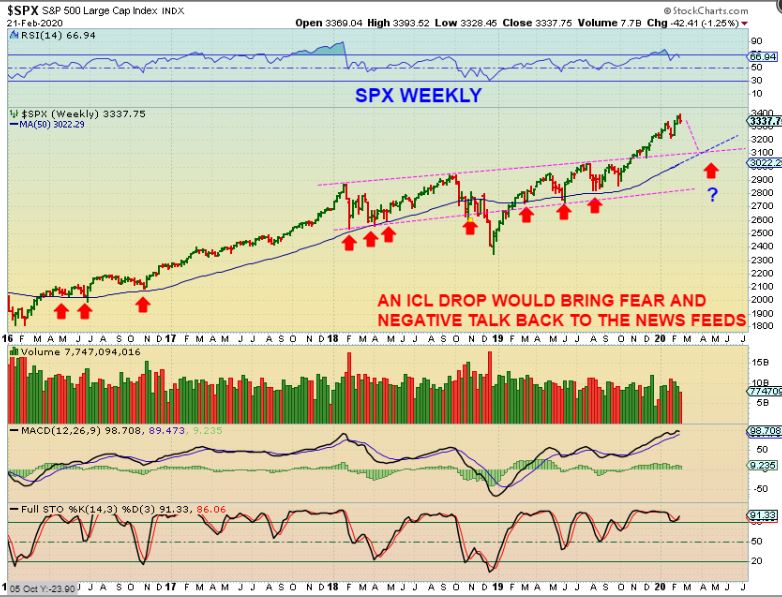
SPX WEEKLY – On Friday, a sell signal that I had been giving my readers actually triggered, so we should sell & be out. In the weekend report I pointed out other reasons why now we need to be very cautious about being long or jumping back in. I had been showing strong divergence in my indicators. This looked toppy…
.
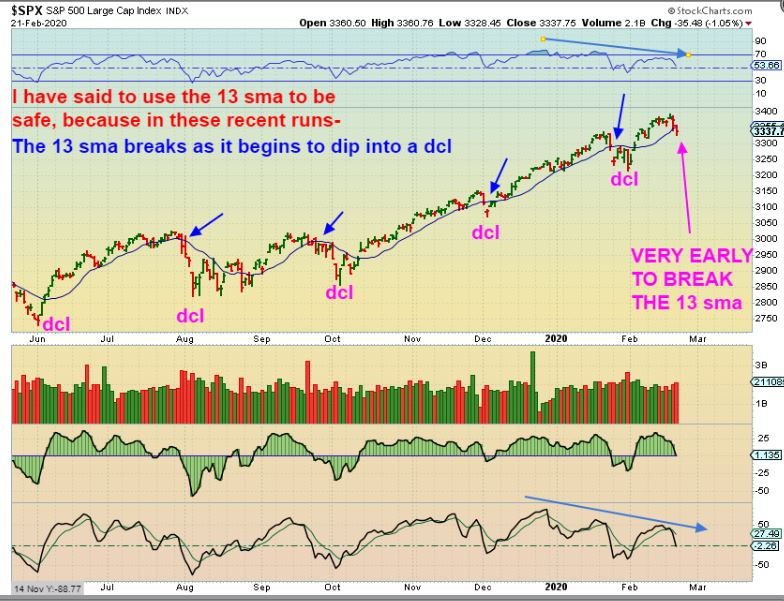
I posted this. Notice the blue arrows. After a long run, a break of the 13 sma led to a drop into a dcl. Thursday broke that 13 sma, and Friday was only day 14. A close lower was a sell. A BIG drop could follow over time, even chopping lower for weeks.
.
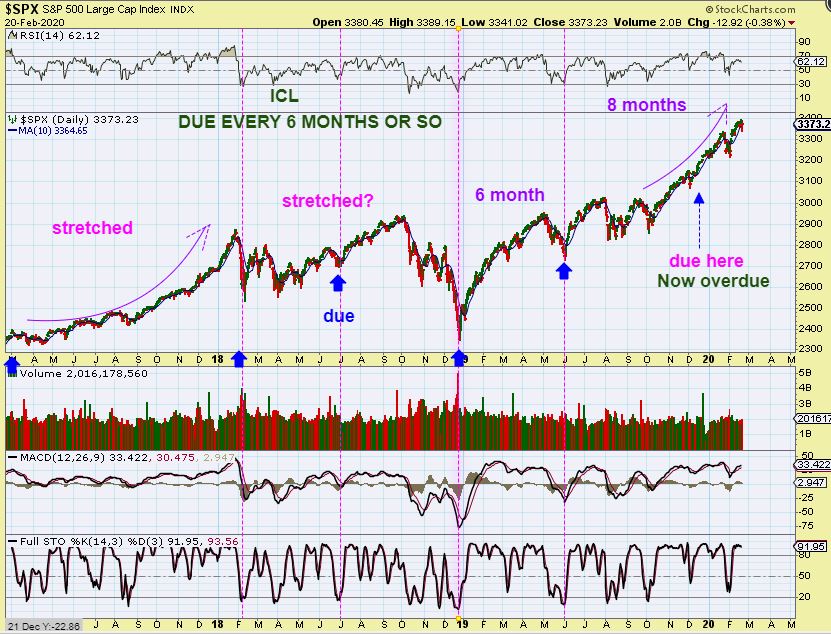
Here I tried to show that even when markets get stretched, every 6-8 months we should get a deeper dip (ICL) and we have yet to see that. An ICL ( Deeper dip) is overdue. We were expecting a drop, unless this market was just going to do a blow off parabolic drop. The sharp drop would then come later.
.
FINALLY THE SPX WEEKLY FEB 21. The Big Picture still looks as though markets could go parabolic if we only get a back test. The bull may remain healthy after a deeper ICL correction, while the shorter term daily charts above are calling a top here. This is ONE thing that I will be watching going forward. Will support hold or fail?
.
What about GOLD, SILVER, and MINERS? I had been tweeting out several charts showing that we were trading Miners successfully, but what was I putting in my day to day reports? Here is a very brief review of how we played that sector too.
.
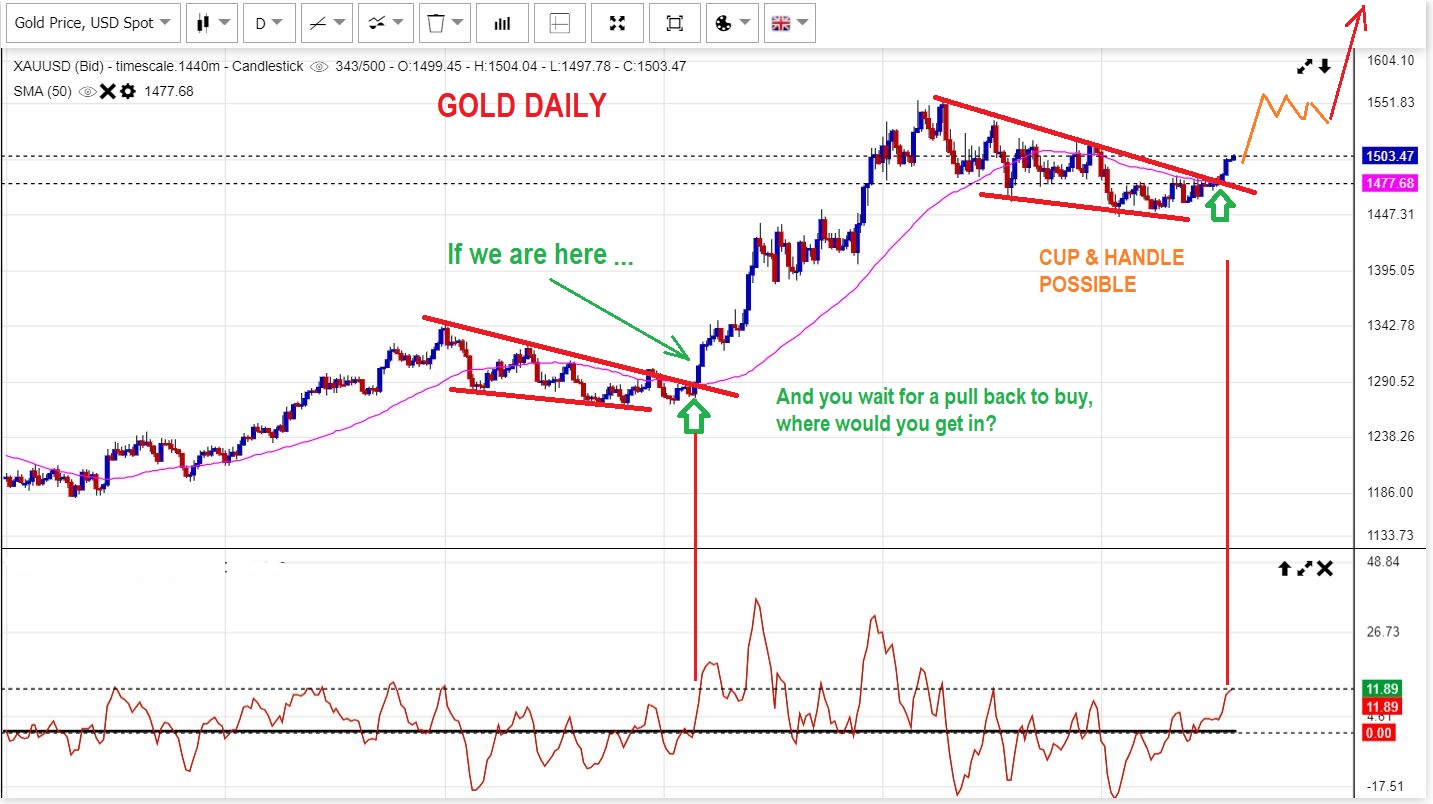
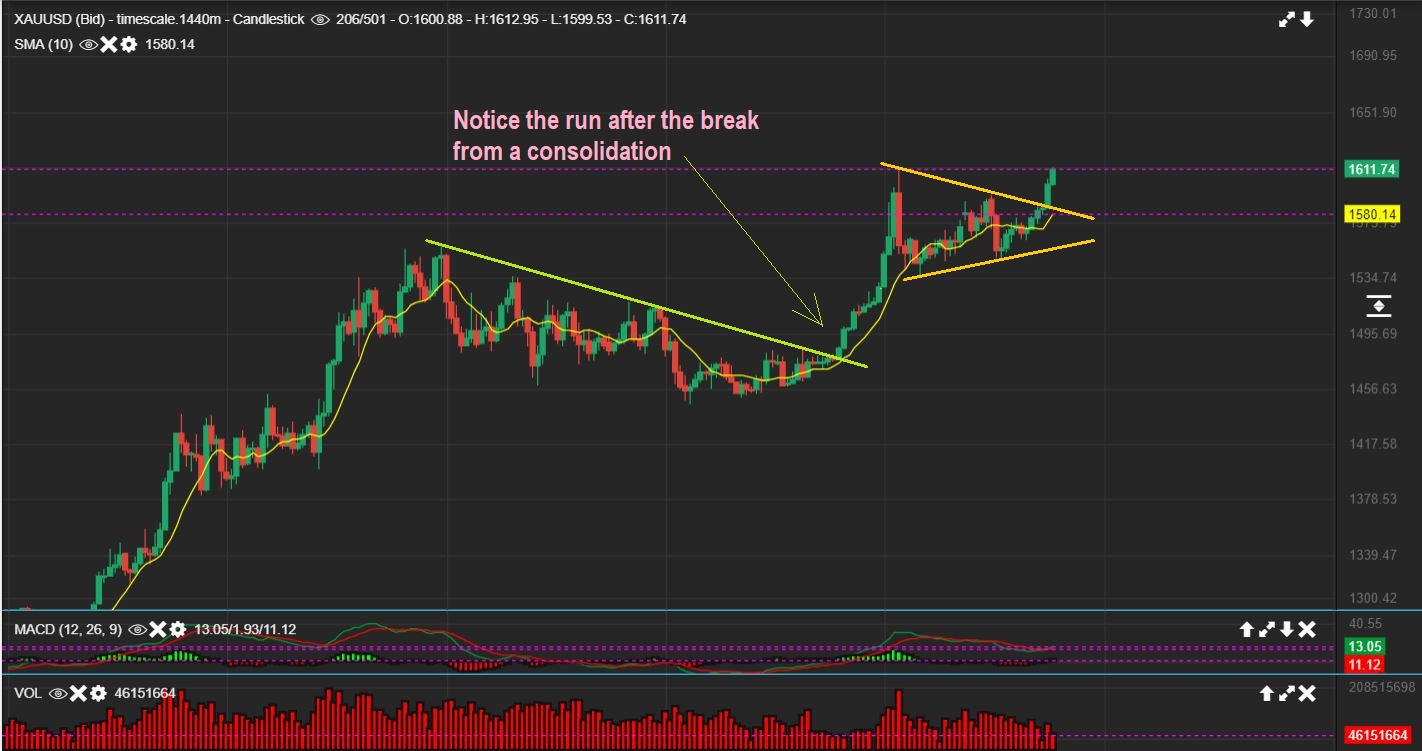
GOLD – We actually caught the ICL in November and this break out of the wedge / triangle was confirmation of the bull run continuing. NOTICE THAT I DREW IT AS LIKELY BECOMING CHOPPY AS IT HITS NEW HIGHS. Like a cup & handle. That was just to prepare us for the possible future chop.
.
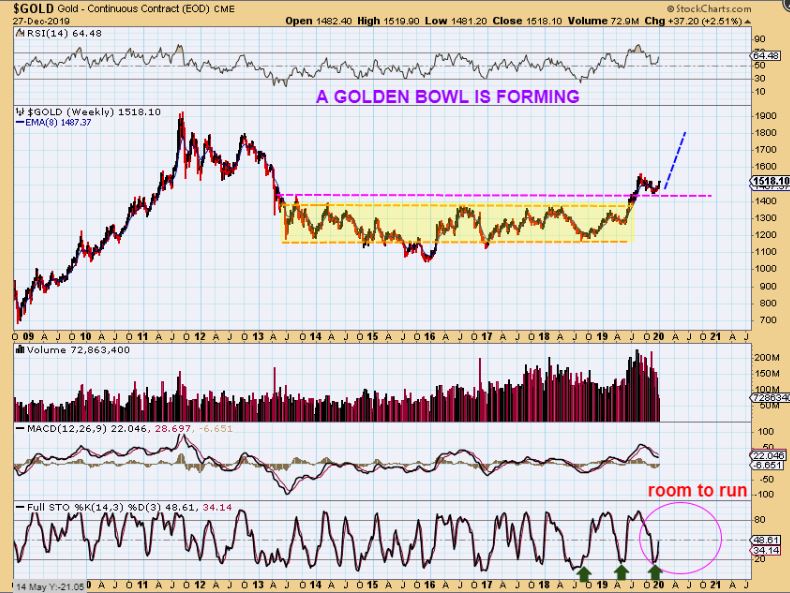
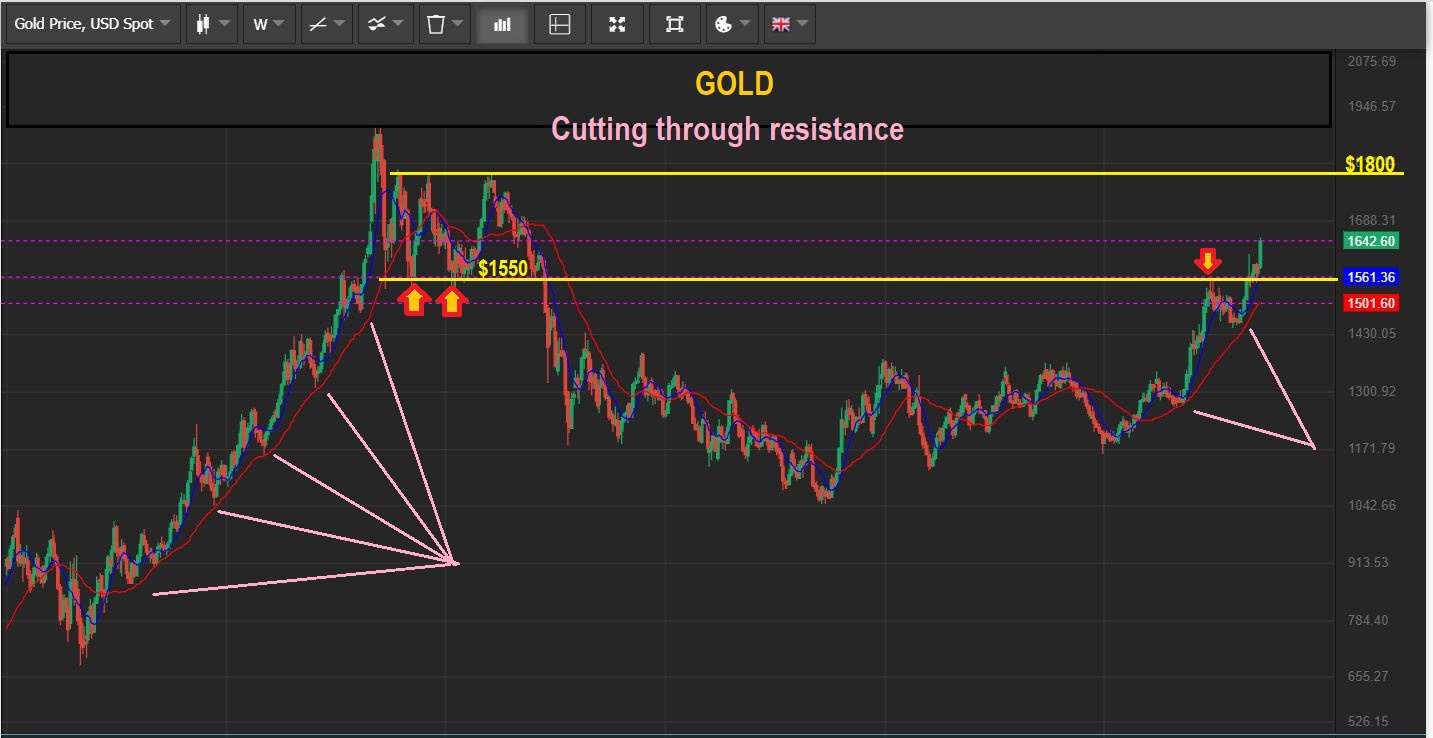
THIS WAS ONE OF MANY GOLD BIG PICTURE CHARTS THAT I POSTED WEEKLY. It shows us the Bull marching out of a base and back testing that break out. I said that Gold should continue higher.
.
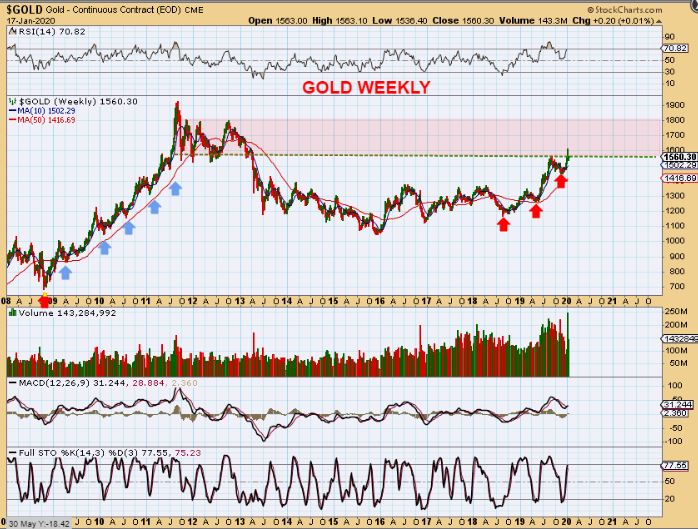
JAN 17 – There will be resistance causing choppiness, but it is still Bullish.
.
And when we ran to prior highs, it did get choppy as predicted earlier in December. It was still Bullish, and here it broke out from a triangle again. I was encouraging my readers to remain long. I posted many buy opportunities for Various Miners, some that I tweeted out too.
.
The GOLD BULL continued to act correctly with a bullish break out.
.
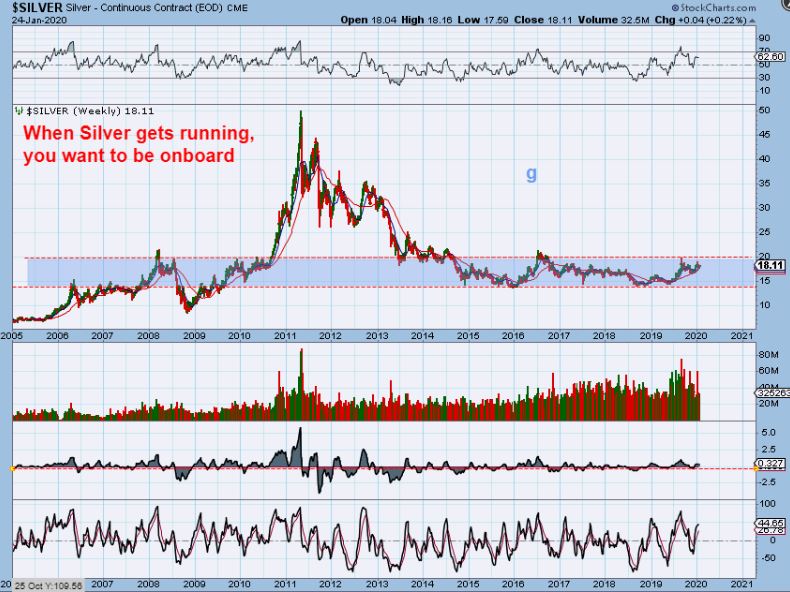
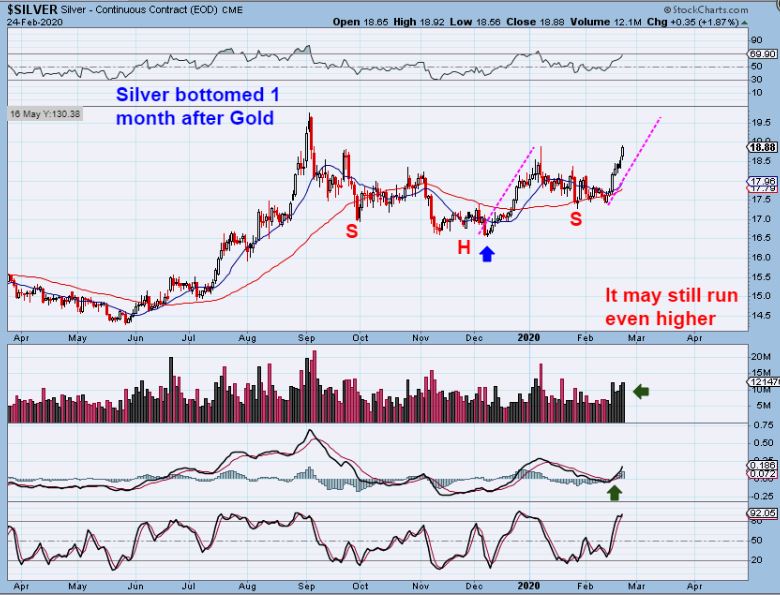
SILVER IN JANUARY was lagging Golds run, but it was still building a bullish base. CAN YOU IMAGINE SILVER STOCKS WHEN THIS BREAKS OUT? Some that we traded already doubled & tripled with Silver still inside of the base.
.
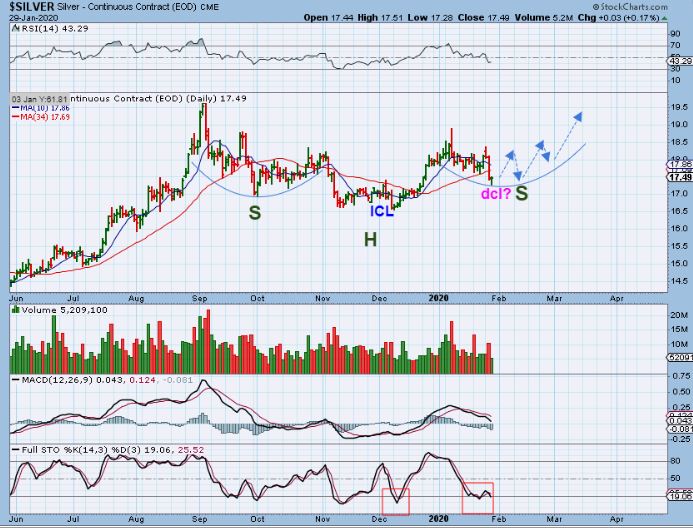
Silver at the end of January was Bullish despite the chop &drop too in my eyes. I said that I would expect to see this choppiness gradually form an inverse H&S. THAT is a bullish pattern if you see one form…
.
Well look at that! This is a current chart of Silver and the choppy inverse H&S formed.
.
AND THE MINERS? We traded many of them.
.
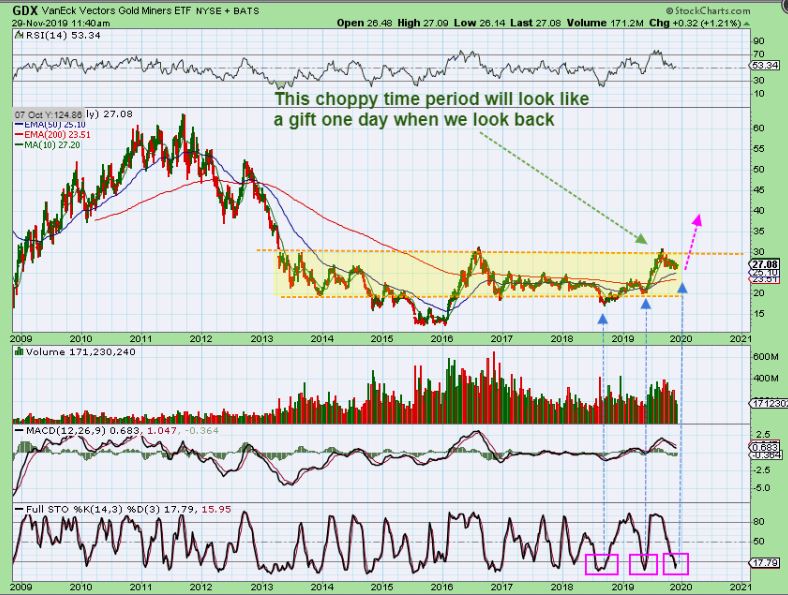
GDX was choppy as it dropped into the ICL, and I was getting a buy signal in November. I wanted to point out that that choppiness would soon be a blip in our memories in the big picture
.
.
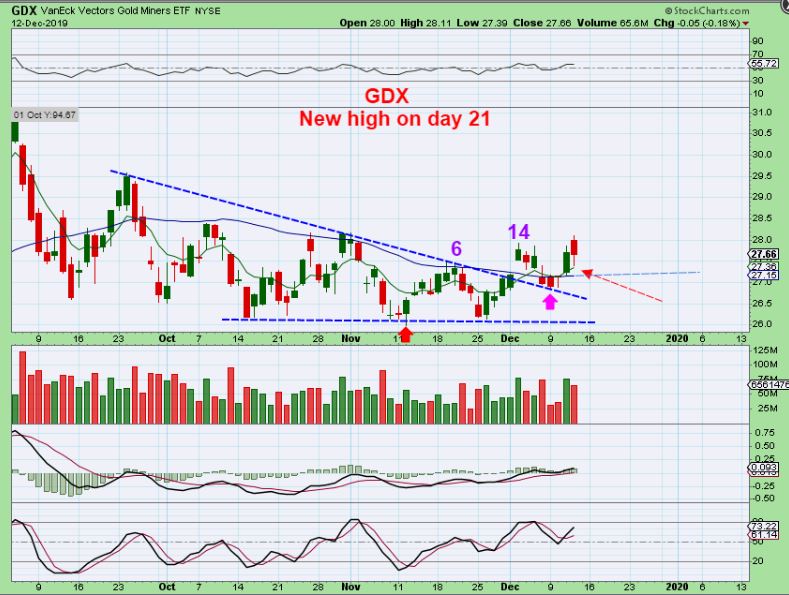
GDX – It did run from $26ish to $28, but it remained choppy and frankly it was frustrating, but as it chopped, some individual miners were running higher…
.
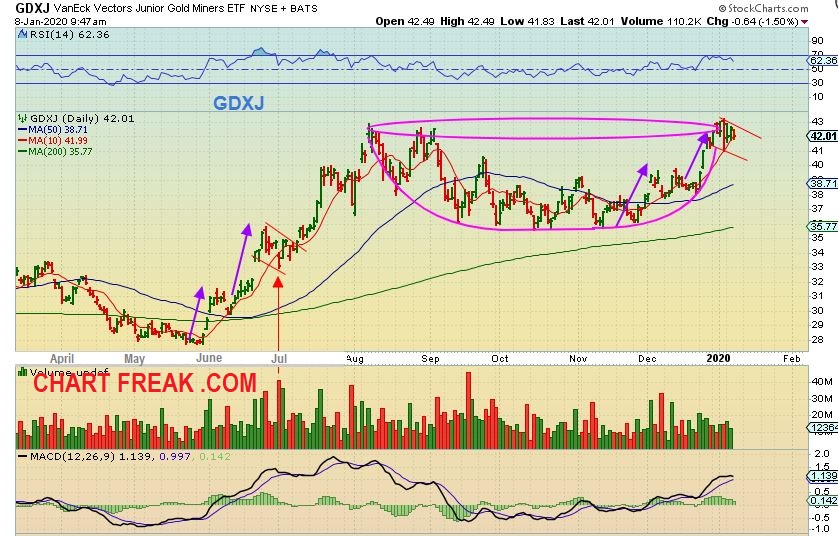
GDXJ – by the time we got into early January price ran from the November lows to prior highs. I now expected a possible handle to form, and by pointing that out here, it would help prepare my readers for possible more choppy sideways action. I also tweeted this out. Follow me at @chart_freak
.
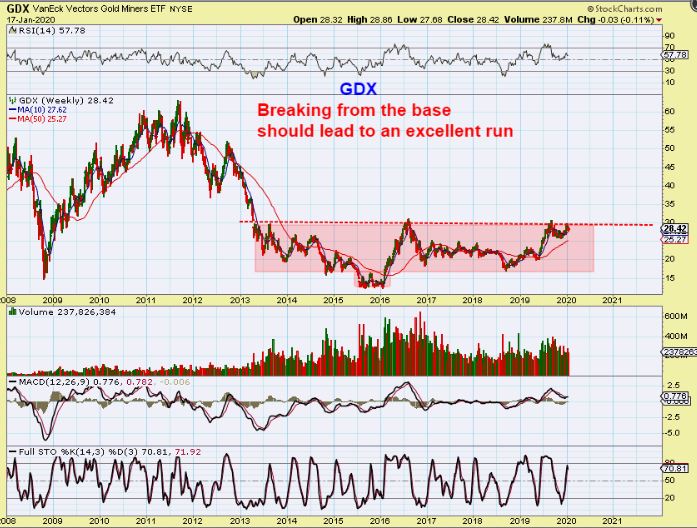
GDX JAN 17 – Though choppy, I wanted to show that the big picture weekly remained Bullish
.
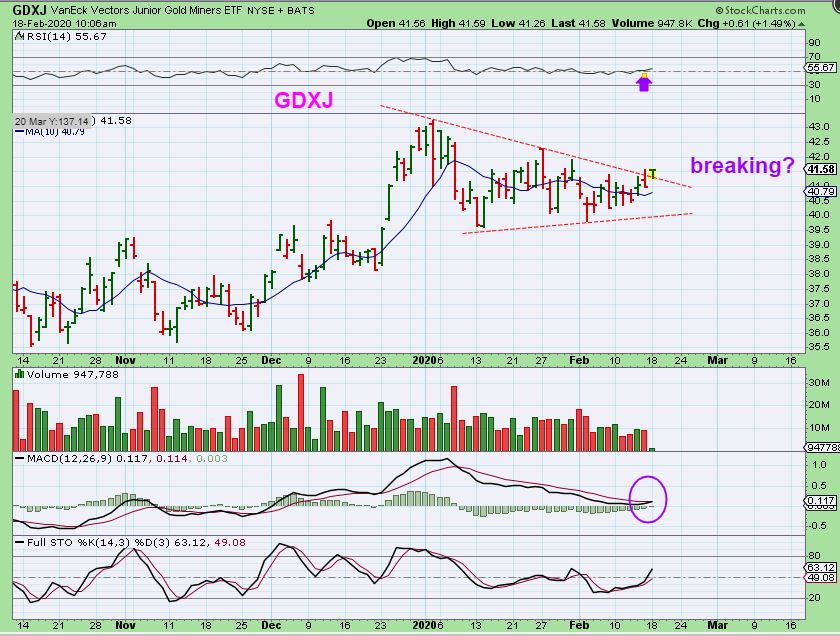
GDXJ – In mid February we finally got a break from our triangle, so I posted this at 10 a.m. in our live trading area ( an area set aside under each daily report for traders to discuss markets, share ideas, etc). This was a good place to add.
m
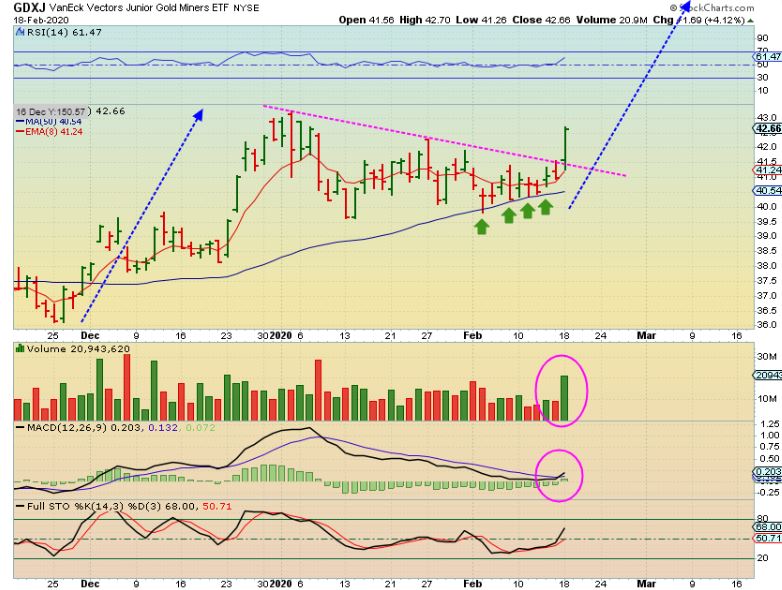
GDXJ FEB 18 – It held the 50 sma the whole time during that chop and By the close the break out was clear and volume was increasing.
.
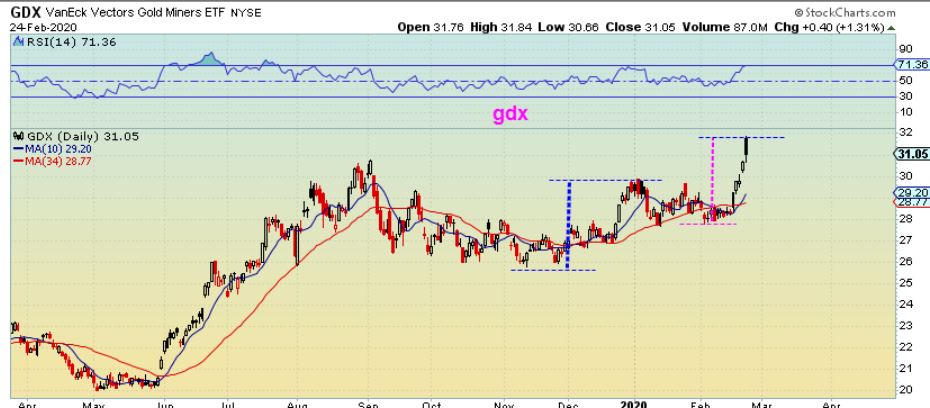
GDX FEB 24 – Now we have actually reached a ‘measured move’. This is a conservative measure and it can stretch out higher, but for now we may see a Pause in the upside (short term pause). A DCL is actually coming due.
.
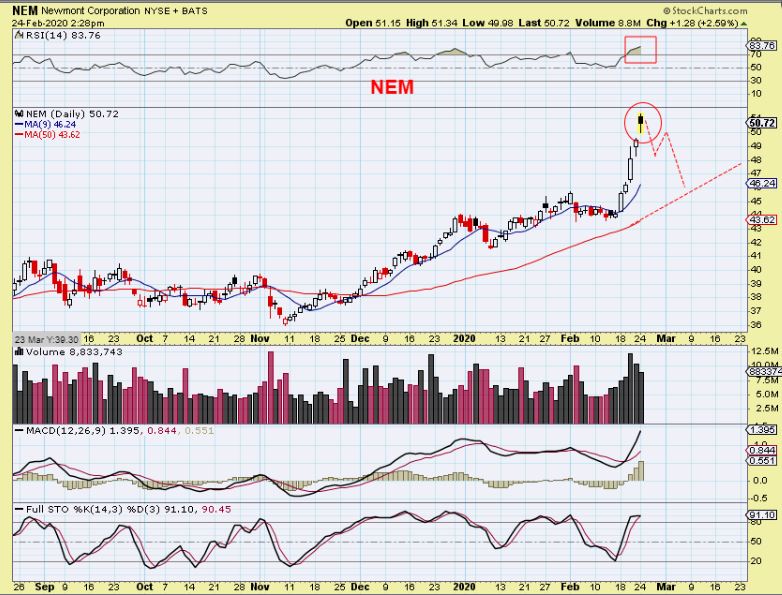
In todays premium report, I pointed out possible topping candles. Some Miners got extended , and that black spinning top may be signaling that gains can be harvested and a pull back is coming. A DCL is actually coming due in the Miners.
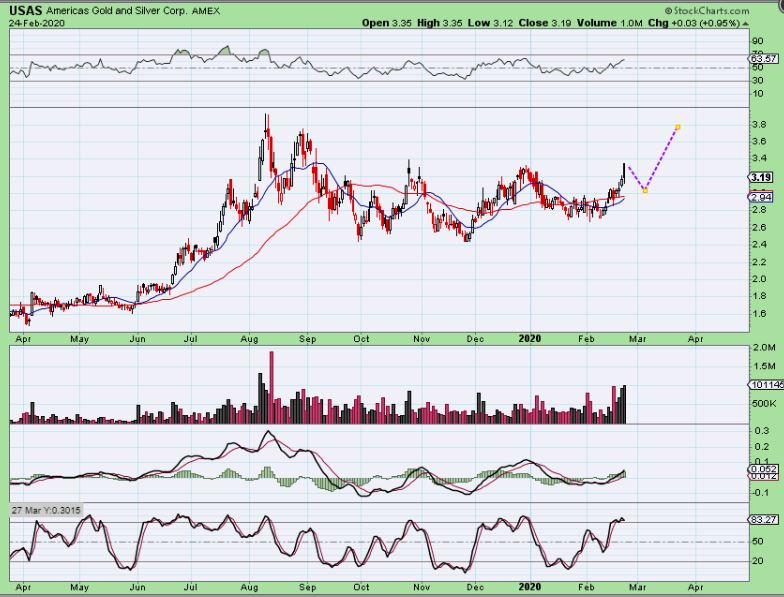
USAS –Less extended Miners may not pull back as much as others. USAS for example is a Silver stock that may run higher if Silver breaks higher. If Silver pulls back, this may do a smaller dip, since this is not as extended as other Miners. A small dip as shown is reasonable.
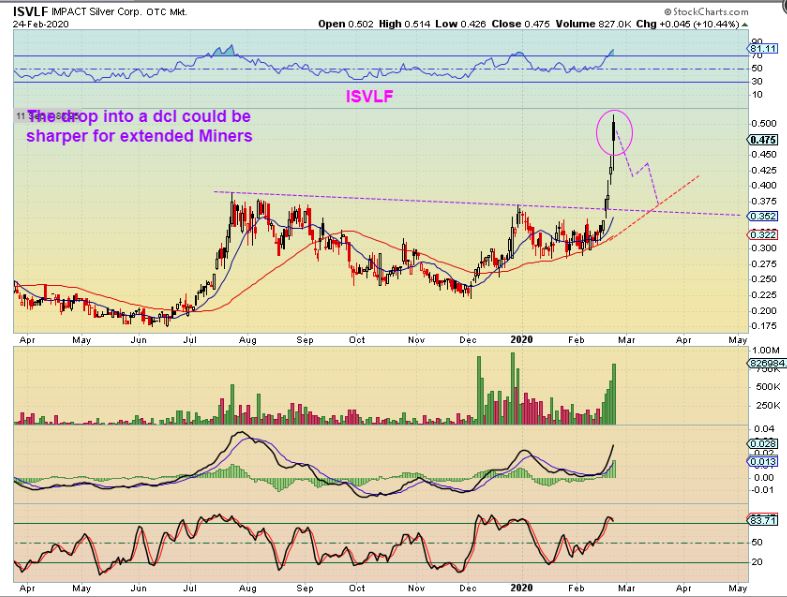
ISLVF did get extended, so a drop something like this is still possible and yet it remains bullish. This would also offer a nice buying opportunity.
,


