
Weekend Review January 5th
This week we saw some acceleration in some areas and some choppiness in other areas of the markets, so I think that this Big Picture Weekend Report can help to clarify things as we come out of a somewhat choppy week. Lets take a look…
.
SPX DAILY – I am seeing what looks to be some topping action on the daily charts, so we may continue to see some choppiness and then a dip into a dcl. The 13 sma stop would still have you long though. Since this also looks to be a R.T. Daily cycle, we should see a higher low, maybe just a chop down to back test the 50sma.
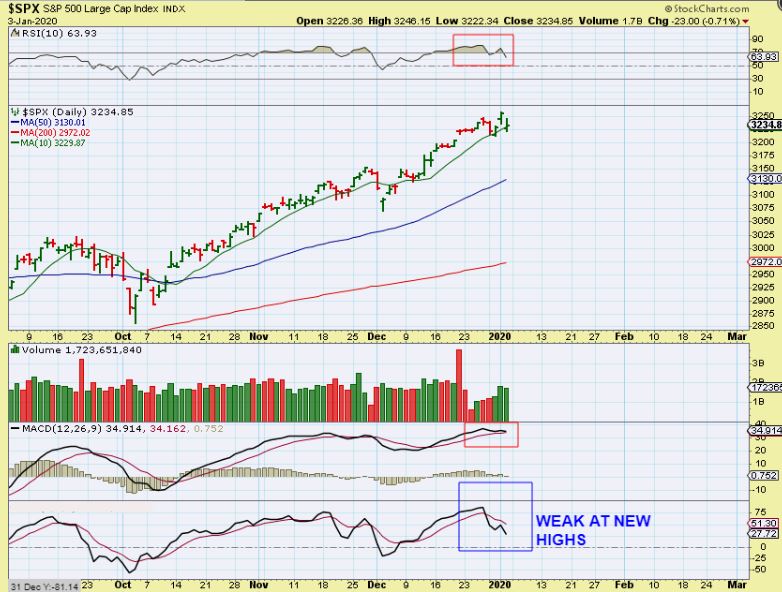
.
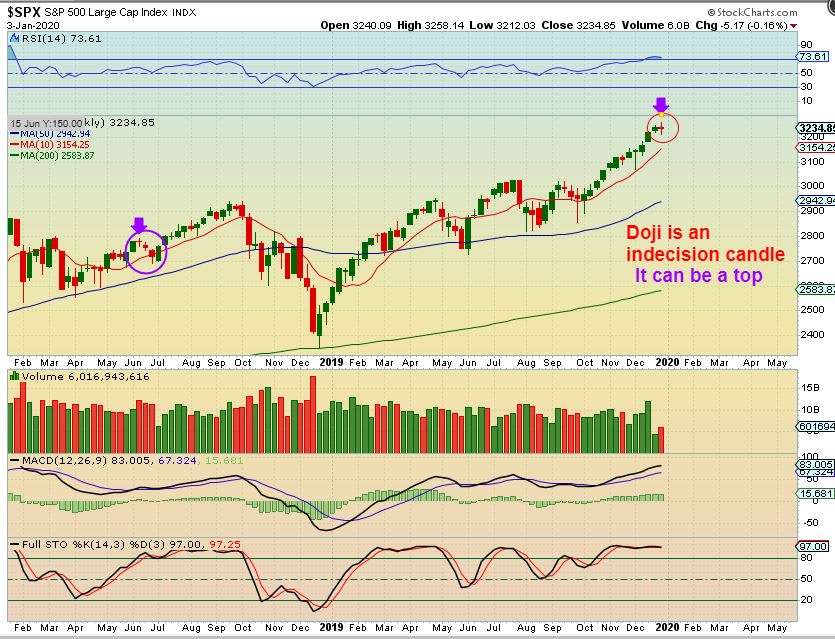
SPX WEEKLY – So the Big Picture also looks like a possible weekly topping candle.
.
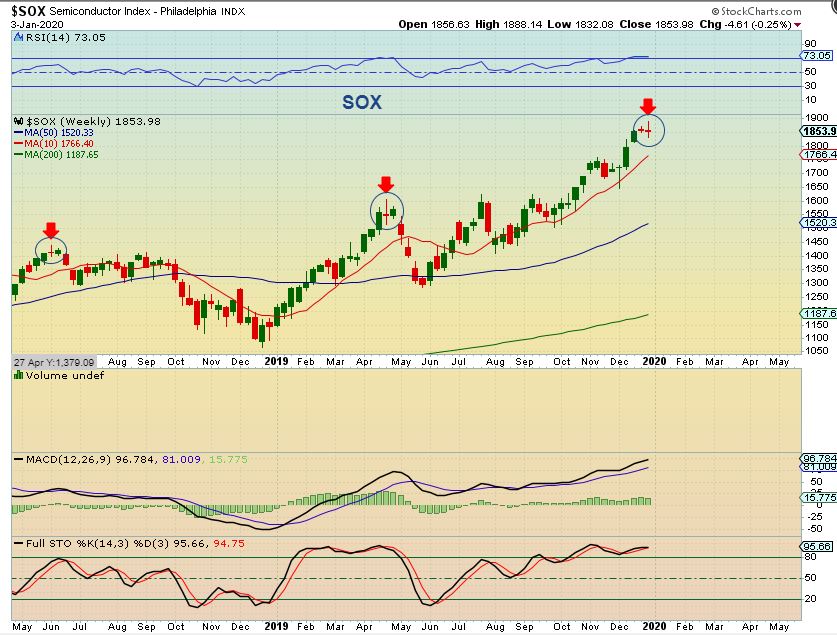
SOX WEEKLY – We see it with the Semiconductors too. It is something to keep in the back of our minds.
.
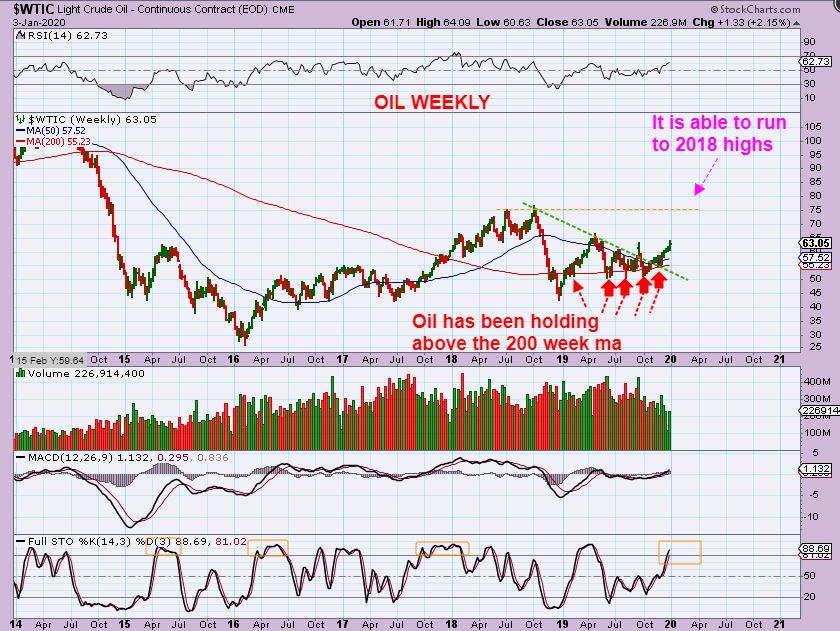
WTIC WEEKLY – Oils weekly chart shows support repeatedly found in the 200 week ma area. Oil popped on the news in the Middle East, and continued tensions there can cause price to continue to rise, eventually reaching 2018 highs. Please read the chart.
.
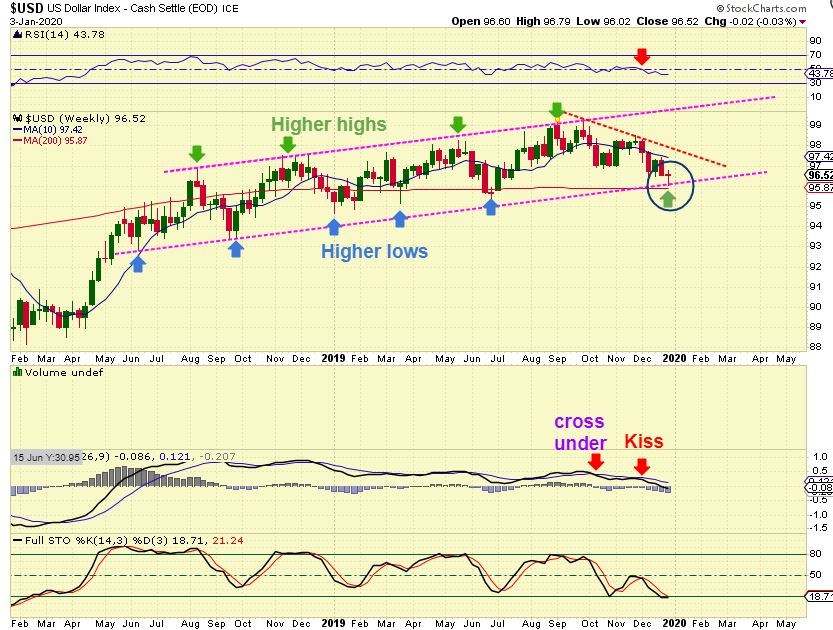
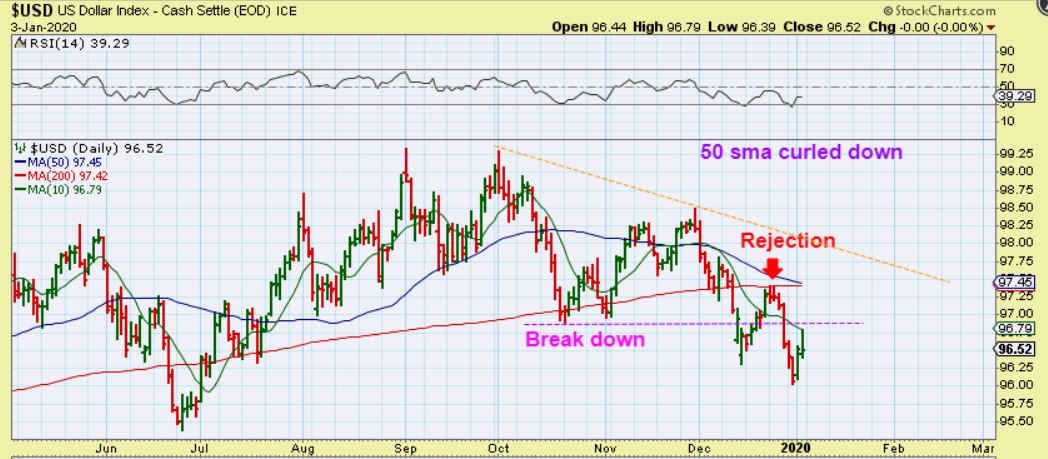
USD WEEKLY – The USD has a weekly Doji or possible reversal candle at the 200 week ma. Is this Bullish? Maybe short term, but a doji can also be a continuation candle, so we should look at the daily chart too…
.
USD WEEKLY – With a dcl in October, those lows broken in December, so the USD has a failed daily cycle. That means that it is dropping into an ICL. A weak bounce to the 200sma was rejected. The USD can bounce back up there again & gold can dip down into a dcl of its own, but Longer Term this looks to be failing in the bigger picture as Gold looks to be accelerating higher.
.
.
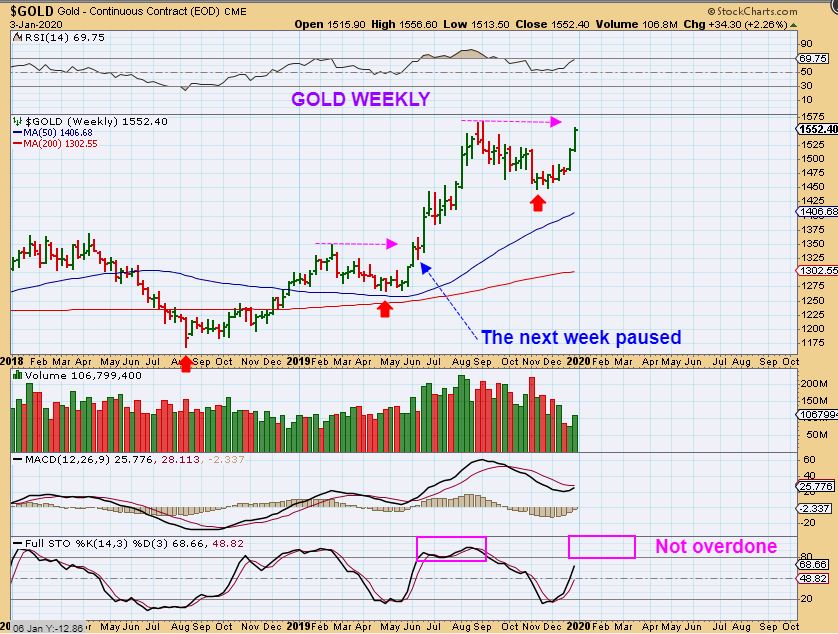
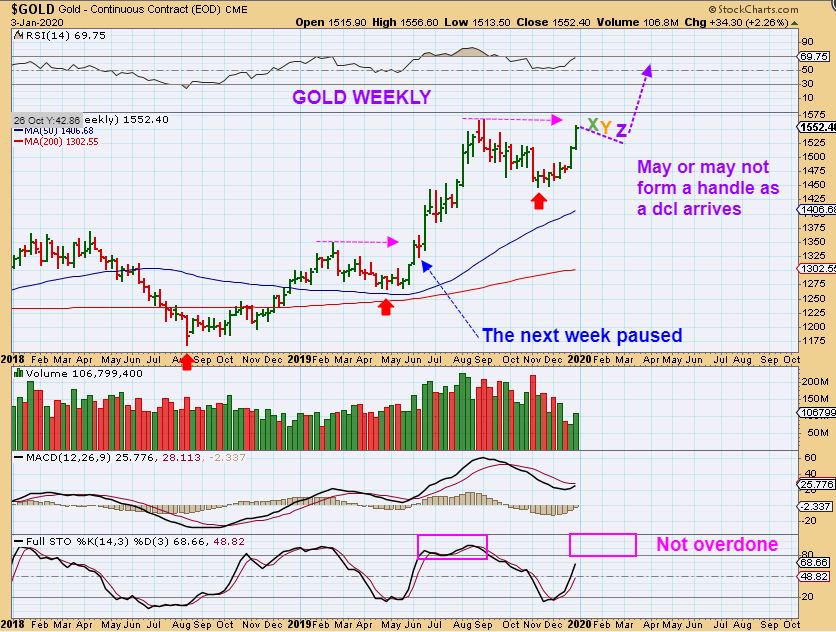
GOLD WEEKLY – Gold had a great week, adding $34 onto last weeks gains. The Miners approached the 2019 highs first and now Gold has caught up. See the chart. In June when they reached the recent highs, it paused for a week. So…
.
GOLD WEEKLY – Gold closed near the highs, so it can just continue higher, but I wouldn’t be surprised if Gold pauses here too. It is not unusual to find sellers at prior highs and as BUYERS & SELLERS do battle- a handle can form on the cup. Do not let a pause overly concern you if you see one, because…
.
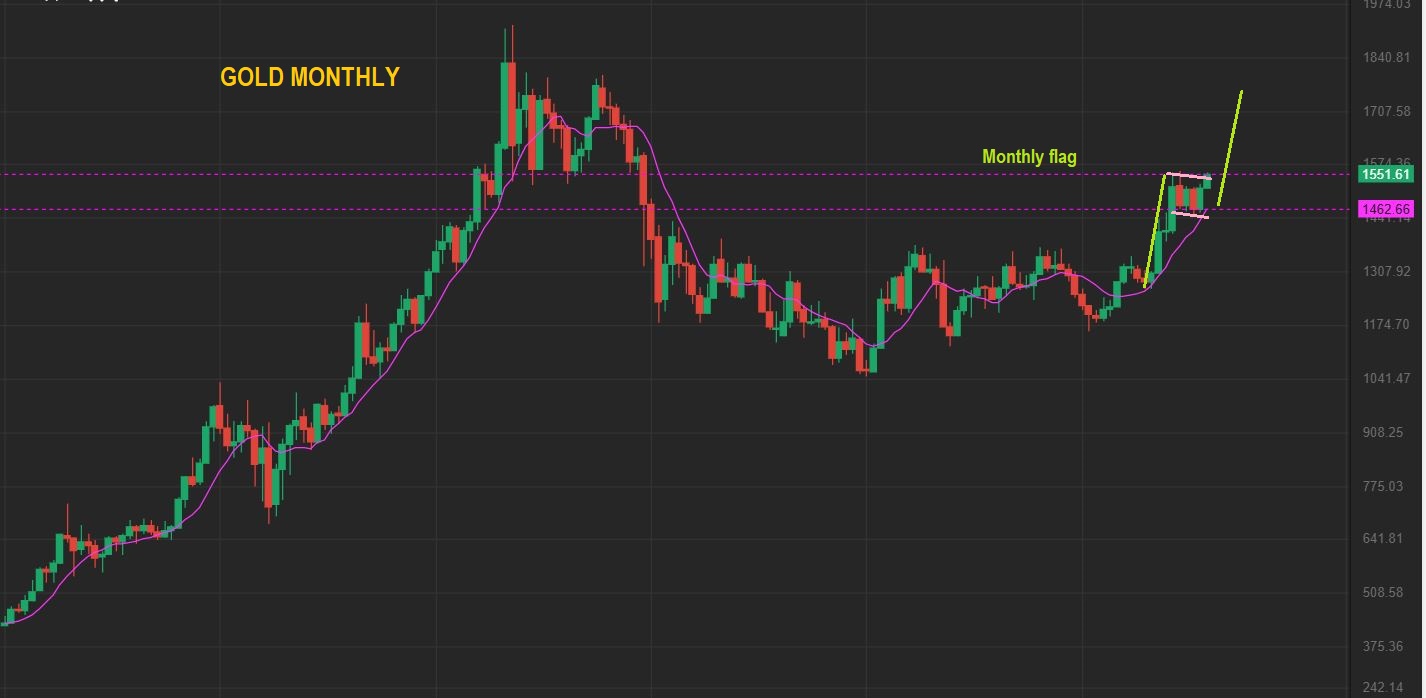
GOLD MONTHLY – The Monthly chart remains very bullish and looks like Gold will continue higher this month as a break out. Gold is at that solid resistance area again, so it is trying to push into resistance and might chop sideways as it does. That said, this is a Monthly chart and I think that this shows Gold going to the Prior highs in the coming months.
.
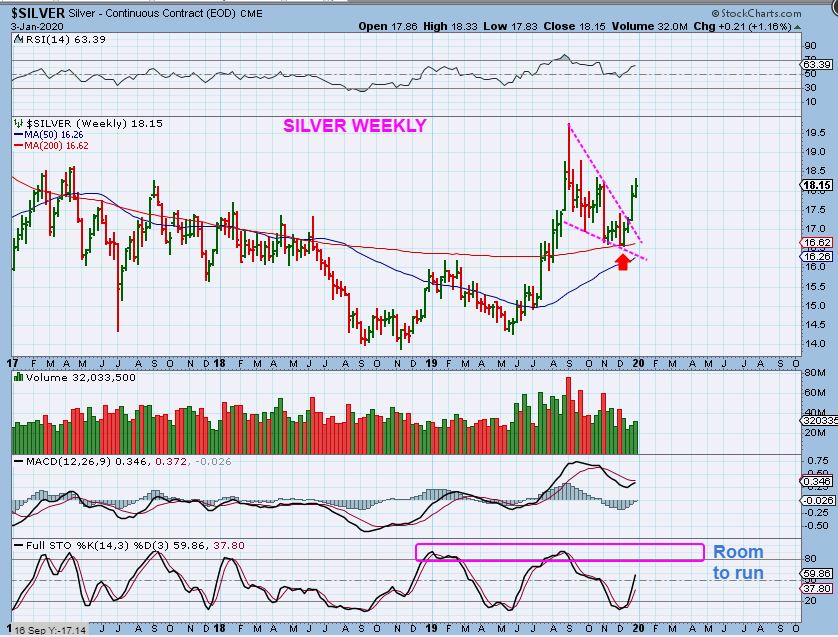
SILVER WEEKLY – Silver broke out last week after bouncing right off of the 200 week ma. It then added some smaller gains of 1.16%, small compared to Golds gains of 2.26% for the week.
.
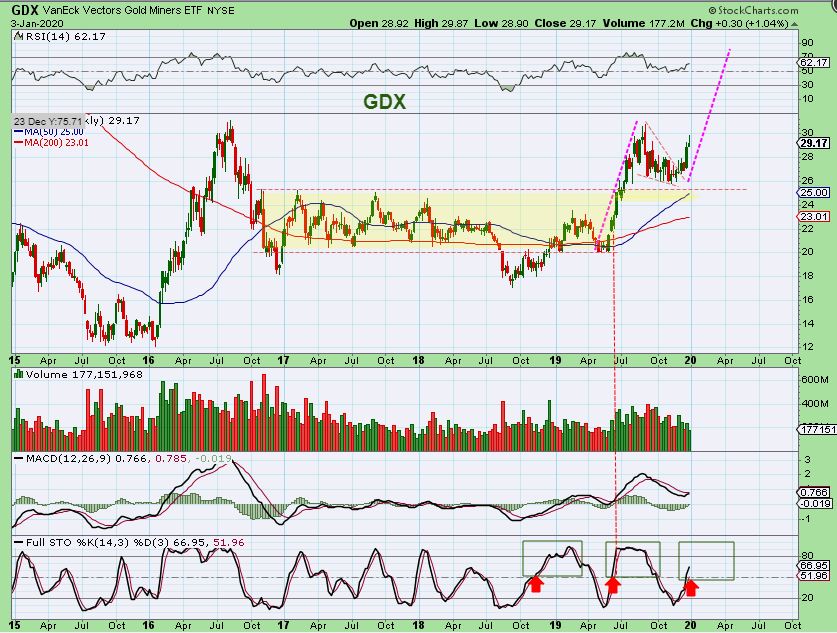
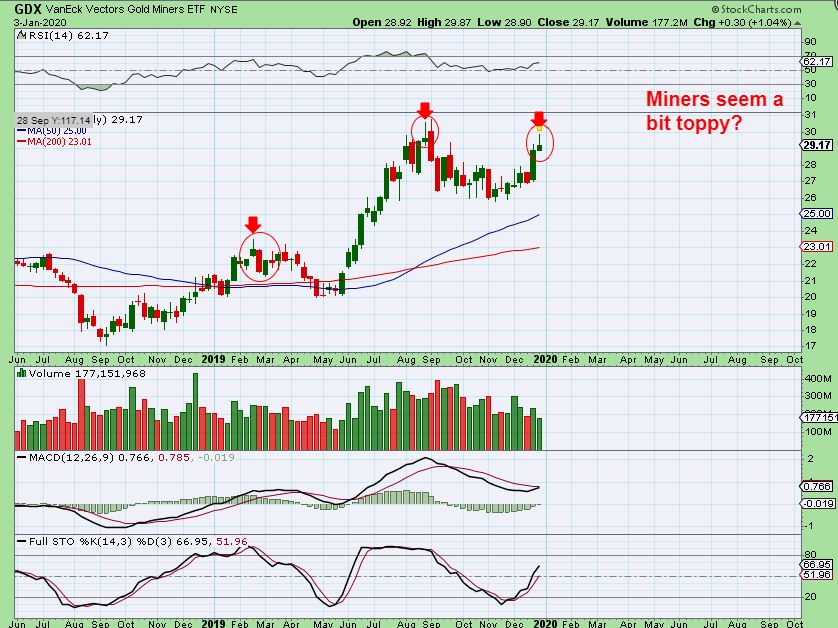
GDX WEEKLY – The smallest gains were GDX gains at only 1%, since Miners reversed into the end of the week. This is still an excellent chart set up with a break out of that yellow base, and back test with a bullish wedge or flag, and a break out higher. Let’s look at the GDX Daily Chart…
,
.
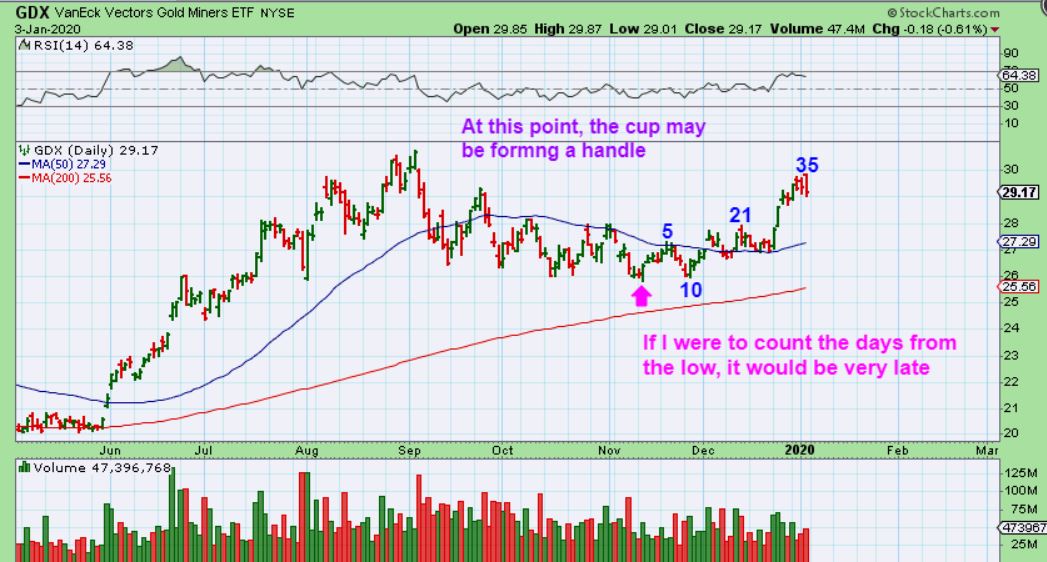
GDX DAILY – If I counted days out of the lows, we’d be on day 35 with no visible dcl- so either we are going to do a quick dip here to a dcl, or as I have been saying- just a sideways chop that puts a handle on this cup. A drop to the 50sma is not out of the question, but a choppy handle just seems more likely. Now we’ll discuss this possible dip by going back to the weekly charts…
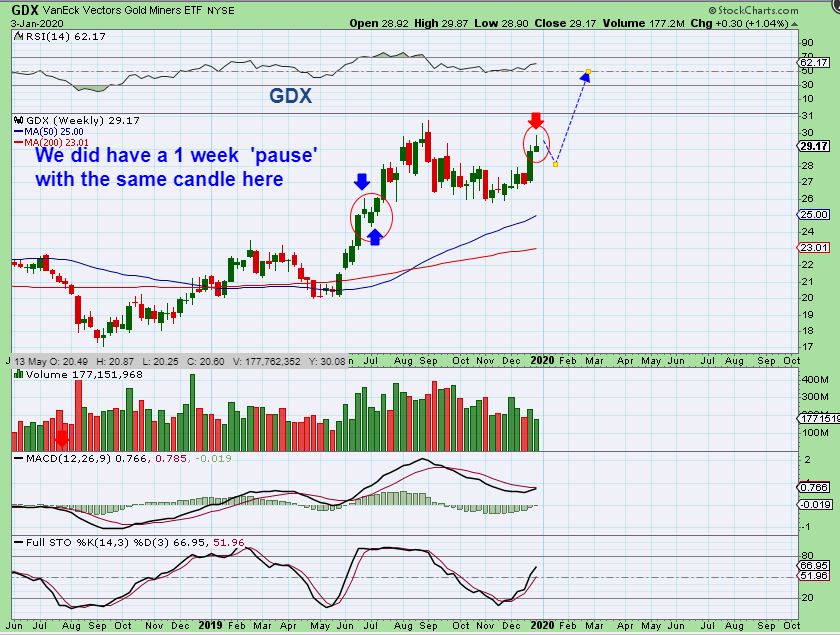
GDX WEEKLY – So I do see a shooting star, possible topping candle here. It is NOT always the ‘top’ of a run, it can just temporarily stop or pause a run at times. See the chart for similar candles as tops, but …
.
GDX WEEKLY – Now see this chart. I am pointing out the same candle on the last run, it just caused a pause midway. THIS CHART should help you to see that this is not always a top of a run, but a 1 week drop followed.
,
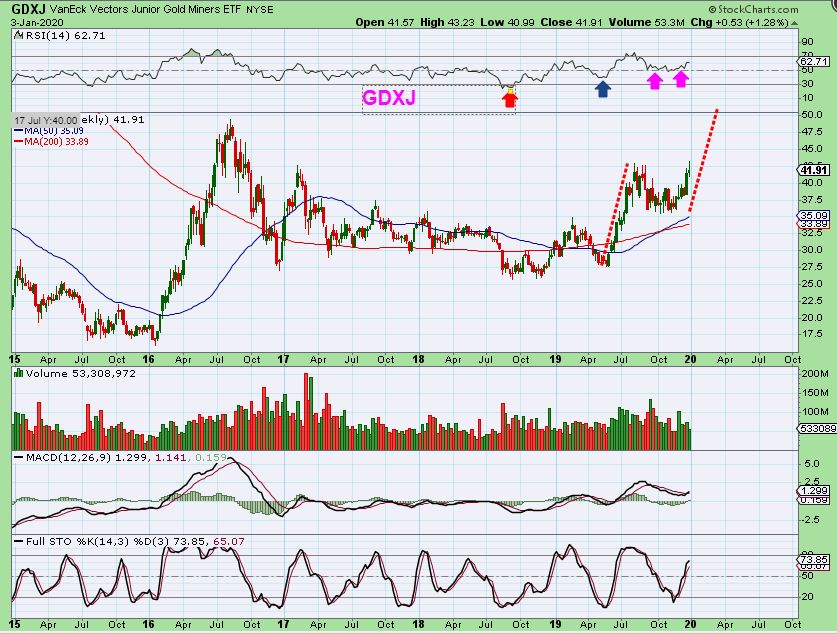
GDXJ WEEKLY – Ignore the daily wiggles and isn’t this weekly chart beautiful? So far it is really playing out exactly as I have felt that it would for a long time. It is a large cup & handle ( or really more of a Pan and Handle), and is very Bullish.
,
Finally, Lets even get more bullish
.
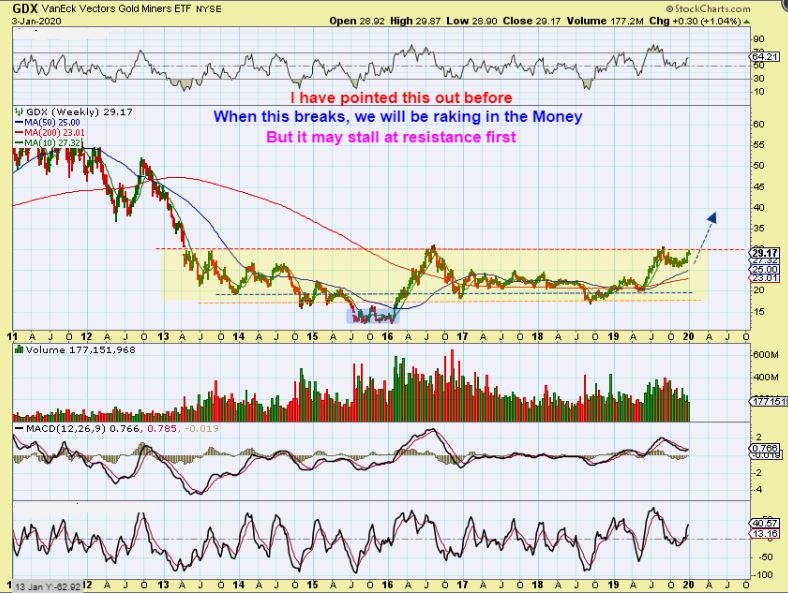
GDX WEEKLY – GDX should be able to run straight to $40 when this eventually breaks, but that is where there is more of a solid resistance area. It can power even higher under the right conditions.
.
Conclusion: We saw Gold ripping higher both Thursday and Friday, yet the Miners gapped open and closed lower on both days. I understand how that looks and how it feels, and I do get emails asking how concerned I am. At this point, I am not concerned. Miners were leading the way higher and have had a nice run. The charts remain Bullish, and I think that as Gold played catch up and finished trying to make a cup – we saw normal profit taking in the Miners. I have said even before these formed cups that it is normal to see a handle appear before they run higher. We’ll see what happens going forward, but at this point they may just churn sideways and form handles on these cups. Monday will be interesting in all market sectors , because the last 2 weeks were supposed to be holiday shortened weeks where many were on 2 week vacation. It seemed normal to me, but maybe we’ll see something new come next week. Stay frosty! 🙂
.
I hope that this Big Picture View helps to confirm the Bullishness to your outlook for the precious metals. As always, we’ll take it step by step in the daily reports.
.
Enjoy your weekend, and thank you for being a chartfreak with me!
.

